FÜR INNERE MEDIZIN I
PROF. DR. MARTINA MÜLLER - SCHILLING DER FAKULTÄT FÜR MEDIZIN
DER UNIVERSITÄT REGENSBURG
EFFECTS OF STIMULATIO WITH FREE FATTY ACIDS O PROLIFERATIO AD MIGRATIO OF HCC CELLS I VITRO
Inaugural – Dissertation zur Erlangung des Doktorgrades
der Medizin
der
Fakultät für Medizin der Universität Regensburg
vorgelegt von
Karin Susanne Grünberger aus Aufeld
2015
Dekan: Prof. Dr. Dr. Torsten E. Reichert 1. Berichterstatter: Prof. Dr. med. Claus Hellerbrand 2. Berichterstatter: PD Dr. med Sven Lang
Tag der mündlichen Prüfung: 13. Mai 2015
And those who were seen dancing, were thought to be insane by those who could not hear the music.
Friedrich ietzsche
Table of Contents
page1. Introduction ... 8
1.1. Hepatocellular carcinoma (HCC) ... 8
1.1.1. Prevalence and Incidence ... 8
1.1.2. Epidemiology and risk factors... 8
1.1.3. Carcinogenesis... 9
1.1.4. Therapy and prognosis ... 10
1.2. Metabolic syndrome ... 11
1.2.1. Definition... 11
1.2.2. Pathogenesis ... 12
1.2.3. Therapeutical options and clinical management ... 13
1.3. Metabolic syndrome and HCC – where is the link?... 14
1.3.1. Obesity and HCC... 14
1.3.2. Diabetes mellitus and HCC ... 15
1.4. Aim of the thesis... 16
2. Materials and Methods ... 17
2.1. Materials ... 17
2.1.1. Chemicals and reagents ... 17
2.1.2. Laboratory expendables... 17
2.1.3. Laboratory instruments... 17
2.1.4. Buffer... 18
2.2. Methods ... 19
2.2.1. Cell Culture ... 19
2.2.1.1. Cell culture medium ... 19
2.2.1.2. Cultivation of HCC cells ... 19
2.2.1.3. Determination of cell number and viability... 20
2.2.1.4. Human hepatocellular carcinoma cell lines... 20
2.2.1.5. Free fatty acids - quantification assay ... 20
2.2.1.6. Triglycerides - quantification assay... 21
2.2.1.7. Oil Red O Staining ... 22
2.2.2. Cell-based functional assays... 22
2.2.2.1. XTT – proliferation assay ... 22
2.2.2.2. xCELLigence System ... 24
2.2.2.3. Migration assay ... 24
2.2.3. Analysis of cell culture supernatants ... 25
2.2.3.1. Clinical laboratory analysis ... 25
2.2.3.2. Cytotoxicity Detection Kit Plus... 25
2.2.4. Statistical analysis ... 26
3. Results ... 27
3.1. Effects of free fatty acids on cytotoxicity of HCC cells... 27
3.1.1. Effects of oleate treatment on HCC lactate leakage ... 27
3.1.2. Effects of oleate treatment on cellular morphology... 29
3.2. Effects of free fatty acids on lipid accumulation in HCC cells ... 30
3.2.1. Accumulation of free fatty acids ... 31
3.2.2. Accumulation of triglycerides ... 31
3.2.3. Oil Red O Staining ... 33
3.3. Effects of free fatty acids on proliferation of HCC cells... 34
3.3.1. Measurement of proliferation by XTT – proliferation assay... 34
3.3.2. Measurement of proliferation by xCELLigence System... 38
3.4. Effects of free fatty acids on migration of HCC cells ... 42
3.4.1. Effect of free fatty acids on the migratory potential of HCC cells... 43
3.5. Effects of glucose in culture medium on HCC cells ... 45
3.5.1. Measurement of proliferation by XTT – proliferation assay... 45
4. Discussion... 47
5. References ... 55
6. Abbreviations... 63
7. Appendix ... 65
7.1. Zusammenfassung ... 65
7.2. Danksagung ... 67
7.3. Selbstständigkeitserklärung... 68
1. Introduction
1.1. Hepatocellular carcinoma (HCC)
1.1.1 Prevalence and Incidence
Hepatocellular carcinoma (HCC) is the predominant primary liver cancer. It is the fifth most common cancer and third most common cause of death from cancer worldwide (Mittal et al., 2013). The annual incidence is estimated to exceed 750,000 cases worldwide (Ferlay et al., 2011). HCC is more frequent in males than in females with ratios averaging between 2:1 and 4:1 (El-Serag et al., 2007). The majority of HCC cases (> 80%) occur in either sub-Saharan Africa or in Eastern Asia. China accounts for more than half of the world’s cases (Parkin DM, 2002).
1.1.2 Epidemiology and risk factors
The majority of patients (70 - 90%) developing HCC have a background of chronic liver disease (Sherman, 2010). In fact, any agent that eventually leads to chronic liver injury or cirrhosis is an oncogenic agent for HCC (Bruix et al., 2004). The geographical variation of HCC is owed to the heterogeneity of risk factor penetration within the population (Llovet et al., 2003). For instance, in Eastern Asia and sub-Saharan Africa, the dominant risk factor is chronic infection with hepatitis B virus (HBV) as well as exposure to aflatoxin B1 whereas in North America, Europe and Japan, infection with hepatitis C virus (HCV) represents the main risk factor together with alcohol intake (El Serag, 2011). A recent study by our group demonstrated that in Southern Germany, the most common risk factor was chronic alcohol abuse with 57.2%, followed by HBV and HCV infections with 19.9% and 20.5%, respectively (Kirchner et al, 2010). However, 5 – 30% of patients with HCC lack a readily identifiable risk factor for liver cancer.
Today, it is believed that the majority of these HCC cases are attributed to non-alcoholic fatty liver disease (NAFLD) (Sun et al., 2012). It starts with hepatocellular lipid accumulation, i.e. steatosis, and can progress with inflammation to non-alcoholic steatohepatitis (NASH), which often develops in obese people. (Hellerbrand 2010; Sun et al., 2012). More precisely, NAFLD is a hepatic manifestation of the metabolic
syndrome (Adams et al., 2007; Farrell et al., 2006). In fact, obesity and its consequences make a larger contribution to overall HCC burden than HBV and HCV infections. The reason for this is that obesity is spread wider and its prevalence is higher in some parts of the world (Sun et al., 2012). Additionally, diabetes has been proposed to be an independent risk factor for both chronic liver disease and HCC through the development of NAFLD and NASH (El-Serag and Rudolph, 2007).
1.1.3 Carcinogenesis
Hepatocarcinogenesis is a complex process that is associated with accumulation of genetic and epigenetic alterations that occur during initiation, promotion and progression of the disease. Certain mechanisms that have been revealed for cancer pathogenesis in general, can as well be applied for HCC. For instance, cellular events are often accompanied by increase of expression of several factors that influence the survival of cancerous cells by inhibiting apoptosis and regulating cell cycle. In particular, oncogenes and tumor suppressor genes have turned out to play a key role (Aravalli et al., 2008). Different concepts of hepatocarcinogenesis have been developed:
multistep carcinogenesis, cell proliferation coupled with aberrations in tumor suppressor genes and inhibition of apoptosis, and finally the cancer stem cell concept (Cha and Dematteo, 2005). A general observation is that carcinogenesis is tightly linked to chronic liver damage, as HCC rarely develops in healthy liver during normal aging. A possible explanation for this correlation might be that cancer development in liver tissue requires cell division because genetic hits are acquired step-wisely which are necessary for cellular transformation (El-Serag and Rudolph, 2007). In particular the persistent liver injury, inflammation and compensatory hepatocyte proliferation are characteristics of cirrhosis and chronic hepatitis (Szabo and Lippai, 2012). Although it is known that there is a sequence of development from NASH and cirrhosis to HCC, the exact molecular basis still needs to be deciphered (Siegel et al., 2009).
1.1.4 Therapy and Prognosis
Although new strategies for HCC therapy have evolved perpetually, it still remains a highly aggressive form of cancer with poor prognosis due to frequently late diagnosis.
Its prognosis is dismal with a 5-year survival of 11%. A widely used prognostic indicator in patients with cirrhosis is Child score or Child-Pugh score, a slightly modified form published ten years later. It includes five variables (albumin, bilirubin, presence of ascites, encephalopathy and prothrombin time), which define the degree of severity (A, B and C as the subgroup with worst prognosis) by the aid of a score system (Child and Turcotte, 1964; Pugh et al., 1973). Higher Child scores correlate negatively with prognosis (Kirchner et al., 2010). Only surgical resection or orthotopic liver transplantation turned out to be potentially curative (Blechacz and Mishra, 2013).
Nevertheless, percutaneous radiofrequency ablation (RFA) is a validated curative therapy for early-stage tumours (Fares and Péron, 2013). In patients without cirrhosis, the best treatment is hepatic resection as they can recover from resection preserving a minimum of two liver segments that are functional (Song et al., 2004). However, in patients suffering from cirrhosis, only those with well-preserved cirrhosis and those who could tolerate resection of up to two segments could be proposed surgery. Main prognostic factors after resection are presence of cirrhosis, tumor size, vascular invasion and poorly differentiated HCC. Unfortunately, often only poor prognosis is to be expected due to high rates of postoperative recurrences (Raoul, 2008). However, transarterial chemoembolisation (TACE) and the chemotherapeutic agent sorafenib can improve survival for patients with intermediate and advanced tumors, respectively (Bruix et al., 2011). Especially sorafenib, which is a multi-kinase inhibitor, offers the first effective treatment for progressed HCC (Llovet et al., 2008). Superior to all mentioned therapeutical opportunities is liver transplantation, which seems to be the ultimate cure for HCC. Advantageously, both the tumor and the underlying cirrhosis are eliminated by transplantation at the same time (Mazzaferro et al., 1996; Yao et al., 2002). For patients with a tumor burden exceeding conventional criteria however, dismal prospects are to be observed due to high tumor recurrence (Klintmalm, 1998;
Shirabe et al., 2011). Nevertheless these patients still have a significant chance of cure following liver transplantation, which has led to proposal of several downstaging therapies that are as well applied in conventional therapy (Lei et al., 2013). For instance, downstaging options are transarterial chemoembolization (TACE), RFA, liver resection,
transarterial chemoinfusion and sorafenib, respectively (Ravaioli et al., 2008; de Luna et al., 2009). To sum up, current therapeutical strategies in HCC are rather unsatisfying.
Recent studies however provide significant insights into hepatocarcinogenesis and signalling cascades which might give new impulses for the development of molecular targeted therapies (Blechacz and Mishra, 2013).
1.2 Metabolic Syndrome
1.2.1 Definition
Patients combining various metabolic abnormalities already were described in 1923 (Parikh and Mohan, 2012). However, it was more than five decades later that the constellation of the coexisting factors insulin resistance, hyperglycaemia, hypertension, low HDL-cholesterol and raised VLDL-triglycerides was first mentioned in scientific publications by Reaven in 1988, terming this cluster “syndrome X” (Reaven G, 1988).
A variety of possible names were proposed in the following, whereas “metabolic syndrome” eventually made the race to be the most popular term in nomenclature today.
Remarkably, Reaven’s definition did not include obesity or in particular, visceral obesity, which nowadays is considered as one of the main features (Eckel et al., 2005;
Alberti et al., 2005). A recent study exemplarily showed for China, one of the fastest developing countries in the world, that increased urban migration, the adoption of sedentary lifestyles and especially increasing prosperity causes increasing rates of affliction with typical wealth diseases. The rates of the metabolic syndrome are already approaching those usually found in industrialized countries in both Europe and the USA (Shen et al., 2012). Today, there is still confusion about the definition of the metabolic syndrome. The first suggestion of a suitable definition was attempted by the WHO in 1999 (Fig. 1.1). However, it was stated clearly that it has to be improved in due course of time (Alberti and Zimmet, 1998). Several other definitions, such as the one by the National Cholesterol Education Program’s Adult Treatment Panel III (NCEP: ATP III) followed. Retrospectively, the WHO definition is more suitable for research whereas the NCEP: ATP III definition seems to be more useful for clinical practice (Eckel et al., 2005).
WHO (1999)
Diabetes, impaired fasting glucose, impaired glucose tolerance OR insulin resistance PLUS at least two of the following:
o Obesity: BMI > 30 or waist-to-hip ratio > 0.9 (male) / 0.85 (female)
o Dyslipidemia: triglycerides > 1.7 mmol/l OR HDL cholesterol < 0.9 (male) / < 1.0 (female) mmol/l
o Hypertension: blood pressure > 140/90 mmHg
o Microalbuminuria: albumin excretion >
20µg/min
CEP: ATP III (2001) AY three or more of the following:
o Obesity: waist circumference > 102 cm (male) / > 88 cm (female)
o Hypertriglyceridemia: triglycerides > 1.7 mmol/l
o low HDL cholesterol: < 1.0 mmol/l(male)/ <
1.3 mmol/l (female)
o Hypertension: blood pressure > 135/85 mmHg or medication
o Fasting plasma glucose > 6.1 mmol/l
Figure 1.1 Comparison of the definitions of the metabolic syndrome. The WHO definition is more suitable for research trials, the NCEP: ATP III definition on the other hand more feasible for clinical practice. Both definitions highlight the relevance of obesity and high blood levels of triglycerides as well as hypertension.
Certain factors such as obesity, dyslipidemia and high plasma glucose levels appear in both definitions. To sum up, the metabolic syndrome is a multifaceted problem, which pieces together various metabolic abnormalities (Siegel et al., 2009).
1.2.2 Pathogenesis
As the metabolic syndrome summarizes various metabolic abnormalities with interrelationship, there is not one particular trigger, but a variety of pathways ending up to this pathologic metabolic status. There are various further complications associated with it (Eckel et al., 2005). The list of factors contributing to the development of the metabolic syndrome is long: lifestyle characteristics such as diet and lack of physical activity, obesity, genetic predisposition, chronic inflammation and the presence of cytokines, adipokines, elevated blood levels of free fatty acids (FFA), mitochondrial dysfunction and alterations in insulin signalling pathways (Gallagher et al., 2010). A distressing fact is that the incidence in both children and adults has increased drastically in the past three decades not only in Europe and Northern America, but also in developing countries such as China and India (Flegal et al., 2000; Hedley et al., 2004;
Ogden et al., 2002). The pathophysiology of the metabolic syndrome is a complex process (Gallagher et al., 2010), as it encompasses several interacting factors. Yet, the most accepted and unifying pathophysiological hypothesis is insulin resistance (Eckel et
al., 2005). The mechanism of its development is linked tightly to an increased level of FFA, which is a typical finding in obese individuals (Gallagher et al., 2010).
Simultaneously, insulin levels are elevated, which is thought to be due to an increase in lipolysis because of the activity of hormone-sensitive lipase (HSL). This enzyme normally is inhibited by insulin. A further increase of FFA impairs insulin signalling, which consequently leads to even higher levels of FFA ending up in a vicious circle (Guilherme et al., 2008). Surprisingly, this condition of insulin resistance is reversible to a certain degree, as in individuals with obesity and Type 2 diabetes mellitus insulin sensitivity improves, when FFA levels are lowered (Santomauro, 1999). A concrete example for the effects of elevated levels of FFA is their contribution to the development of NAFLD in insulin-resistant individuals, which adversely affects insulin sensitivity in other tissues (Hwang et al., 2007). Metabolically, the insulin resistance and the elevated levels of FFA result in various changes: production of proinflammatory cytokines, mitochondrial dysfunction, and abnormal levels of adipokines. Taken as a whole, these features contribute to the development of hypertension, dyslipidemia and hyperglycemia, forming the main aspects of the metabolic syndrome (Gallagher et al., 2010). An increased risk for cardiovascular disease and type 2 diabetes mellitus is associated with the metabolic syndrome in the long term (Hunt et al., 2004). To sum up, several steps of pathogenesis have already been revealed in various studies. However, it rests a confusing and challenging topic, as the individual factors mutually are aggravating. Naturally, this conjures up the question: What is chicken, what is egg?
1.2.3 Therapeutical options and clinical management
Insulin resistance plays a key role in the pathophysiology of the metabolic syndrome (see chapters 1.2.1; 1.2.2). Therefore, any therapeutic manoeuvre that improves insulin sensitivity will have a beneficial effect on the metabolic abnormalities linked to it.
However, some dietary factors are know to have no influence on insulin sensitivity but nevertheless are able to modify one or more features of the metabolic syndrome.
Therefore individualized dietary recommendations are necessary and individual abnormalities that are present at the patient need to be taken into consideration (Riccardi and Rivellese, 2000). The great majority of patients are overweight and therefore primarily should put their focus on weight reduction by adequate diet and regular
exercise. Further suggestions are to maintain a diet with reduced intakes of saturated fats and cholesterol, complete smoking cessation, LDL-cholesterol lowering drugs at high risk patients, antihypertensive drugs when necessary, hypoglycemic agents for patients who do not achieve an adequate glucose level or whose HbA1c levels are elevated. At patients with prothrombotic states, a low-dose aspirin or clopidogrel therapy should be initiated (Eckel et al., 2005).
1.3 Metabolic syndrome and HCC – where is the link?
The difference to most other liver diseases is that NAFLD occurs in the context of a systemic disease, which is highlighted by diabetes mellitus and insulin resistance (Bosserhoff and Hellerbrand, 2011). More precisely, NAFLD itself is not only considered to be a component of the metabolic syndrome but even the driving force for insulin resistance (Hellerbrand 2010). Various case reports, case series and studies have reported the association between metabolic syndrome, NAFLD or NASH and hepatocellular carcinoma (HCC) (Starley et al., 2010; Adams et al., 2005; Siegel et al., 2009). As previously described, the metabolic syndrome comprises numerous metabolic abnormalities and problems. An important factor that reduces both metabolic syndrome and HCC to a common denominator is obesity. A frequent comorbidity in obese individuals is diabetes mellitus, which therefore needs to be elucidated, as well.
1.3.1 Obesity and HCC
Obese individuals frequently suffer from insulin resistance. The mechanism of cancerogenesis in individuals with metabolic syndrome is frequently associated with insulin resistance as a key point. One assumes that defects in the signalling pathways of insulin lead to insulin resistance which in turn contributes to hepatic fat accumulation (see chapter 1.2.2) by lipolysis (Angulo et al., 2002). The level of free fatty acids is elevated in the plasma of patients with metabolic syndrome and the resulting hepatic steatosis (Bullock et al., 2004). Their excess is responsible for hepatic inflammation through the production of cytokines like TNF-α. In the following, the “second hit”
might be conducted by dysfunctional mitochondria producing free radicals and oxidative stress (Bullock et al., 2004). In particular, the process of mitochondrial fatty acid oxidation is inhibited by insulin resistance. The emerging intracellular free fatty acid (FFA) accumulation leads to oxidative DNA damage due to stimulated microsomal peroxidases (Bullock et al., 2004). This whole process causes progression from simple steatosis to steatohepatitis and is an important initial step in the development of HCC (Angulo, 2002; Luedde et al., 2007). Notably, cirrhosis is not an obligatory intermediate step on the way to HCC (Bullock et al. 2004). Another association has been drawn with regards to plasma levels of leptin, which are found to be elevated in patients with NASH and also in obese individuals pointing to a possible role for increased angiogenesis and vascular invasiveness in HCC in the setting of the metabolic syndrome (Chitturi et al., 2002).
1.3.2 Diabetes Mellitus and HCC
Additionally to lipids, the quantity and quality of carbohydrates was shown to have a major impact on hepatic steatosis, inflammation and fibrosis in experimental models (Hellerbrand 2010, Bergheim 2008, Feldstein 2003). Diabetes mellitus is a known risk factor for both chronic liver disease and HCC through the development of NAFLD and NASH. Several case-control studies revealed a significant positive association between diabetes and HCC. Approximately 10-20% of patients with cirrhosis have overt diabetes and an even higher percentage have impaired glucose tolerance. Nevertheless, it is believed that peripheral insulin resistance is “primary” and leads to hepatic steatosis, which in turn can contribute to peripheral and hepatic insulin resistance (Smedile and Bugianesi; 2005). Recent data suggests that diabetes is likely to be associated with a 2- fold to 4-fold increased risk of HCC (Adami et al., 1996; El-Serag et al., 2004). Of course, the previous described mechanism of cancerogenesis for insulin resistance in obese people exists in patients suffering exclusively from diabetes, too. As obesity and type 2 diabetes mellitus are comorbidities, the bridge is built to obesity and thus to the metabolic syndrome, again.
1.4 Aim of the thesis
Aggregating the complex confounding risk factors and etiologic mechanism of hepatocarcinogenesis, it becomes clear that a change in lipid metabolism plays a key role. Currently, it remains rather unclear whether diabetes, obesity and the metabolic syndrome are risk factors for HCC independent of NAFLD. However, it is likely that NAFLD usually mediates the relation between the metabolic syndrome and HCC, which is based on the high correlation between features of metabolic syndrome and NAFLD (Siegel et al., 2009). Thus, carcinogenesis may relate at least in parts to the intermediate steps of changes related to fatty acids in the liver and insulin resistance (Siegel et al., 2009). Naturally, it is mandatory to take a closer look at those individuals having already developed a HCC against the background of the metabolic syndrome.
Considering the different interacting phenomenona of the metabolic syndrome occurring during carcinogenesis, one might speculate that elevated FFA levels play a key role for tumor progression and metastasis, as well. Therefore, the aim of this thesis was to assess the effects of FFA and cellular lipid accumulation, respectively, on proliferation and migration of HCC cells in vitro.
2. Materials and Methods
2.1 Materials
2.1.1 Chemicals and reagents
β-Mercaptoethanol Sigma-Aldrich, Deisenhofen, Germany
DMEM medium PAA Laboratories, Cölbe, Germany
FCS (fetal calf serum) PAN-Biotech, Aidenbach, Germany
Penicillin Invitrogen, Karlsruhe, Germany
Streptomycin Invitrogen, Karlsruhe, Germany
Trypsin/EDTA PAA Laboratories, Cölbe, Germany
2.1.2 Laboratory expendables
CryoTube vials Nunc, Roskilde, Denmark
Pipet tips Eppendorf, Hamburg, Germany
(10, 20, 100 and 1000 µl)
Falcon tubes (50 ml) Corning, New York, Germany glassware (various) Schott, Mainz, Germany
Multiwell plates Corning, New York, USA
Pipettes (stripettes ®) Corning, New York, USA (5, 10, 25, 50 ml)
Reaction vessels (1.5 and 2 ml) Eppendorf, Hamburg, Germany Cell culture flasks T25, T75, T175 Corning, New York, USA
2.1.3 Laboratory instruments
Heating block:
Thermomixer comfort Eppendorf, Hamburg, Germany
Pipettes:
Eppendorf Research
(1000, 200, 100, 20, 10 and 2 µl) Eppendorf, Hamburg, Germany Pipette controllers:
Accu-jet ® Brand, Wertheim, Germany
Shaking device:
KS 260 Basic Orbital Shaker IKA® Werke, Staufen, Germany Spectrophotometer:
EMax® Microplate Reader MWG Biotech, Ebersberg, Germany SPECTRAFluor Plus Tecan Männedorf, Switzerland Scales:
MC1 Laboratory LC 620 D Sartorius, Göttingen, Germany Water bath:
Haake W13/C10 Thermo Fisher Scientific, Karlsruhe, Germany xCELLigence system:
Real-Time Cell Analyser (RTCA) Roche Diagnostics, Mannheim, Germany Centrifuges:
Biofuge fresco Heraeus, Hanau, Germany
Megafuge 1.0 R Heraeus, Hanau, Germany
Microscope:
Olympus CKX41 with Olympus Hamburg, Germany ALTRA20 soft imaging system
2.1.4 Buffer
PBS buffer 140 mM NaCl
10 mM KCl
6.4 mM Na2HPO4
2 mM KH2PO4 pH 7.4
2.2 Methods
2.2.1 Cell culture
2.2.1.1 Cell culture medium
DMEM (high glucose/10% FCS) 4.5 g/l Glucose
300 µg/ml L-Glutamine
supplemented with:
10% (v/v) FCS
400 U/ml Penicillin
50 µg/ml Streptomycin
DMEM (low glucose/10% FCS) 1.0 g/l Glucose
300 µg/ml L-Glutamine
supplemented with:
10% (v/v) FCS
400 U/ml Penicillin
50 µg/ml Streptomycin
2.2.1.2 Cultivation of HCC cells
Cell culture work was performed within a laminar flow bio safety cabinet (Hera Safe, Heraeus, Osterode, Germany) in order to avoid contaminations. The cells were cultivated in a Binder series CB incubator (Binder, Tuttlingen, Germany) in 10% CO2 atmosphere at 37°C. As cell culture medium DMEM containing 4.5 g/l glucose and 300µg/ml L-Glutamine supplemented with 10% (v/v) FCS, 400 U/l penicillin and 50 µg/ml streptomycin was used. For cell passaging cells first were washed with PBS and then detached with trypsin (0.05%)/ EDTA (0.02%) (PAA Laboratories, Cölbe, Germany) at 37°C. The same volume of DMEM was used to stop trypsin activity.
Subsequently, the obtained cell suspension was transferred into a falcon tube and then centrifuged at 500 g for 5 min. The obtained cell pellet was resuspended in fresh culture medium and cell number was determined (see chapter 2.2.1.3). A cell density thinning factor of 5 to 10 was used when cells were distributed to new cell culture flasks.
Medium change took place every second day. Cell growth and morphology were monitored and documented using a microscope (Olympus CKX41 with ALTRA20 Soft Imaging System, Olympus, Hamburg, Germany). Accrued cell culture waste was autoclaved before disposal with Sanoclav autoclave (Wolf, Geislingen, Germany).
2.2.1.3 Determination of cell number and viability
To determine cell number and viability, cells were diluted 1:2 with trypan blue solution (Sigma, Deisenhofen, Germany) and applied on a Neubauer hemocytometer (Marienfeld GmbH, Lauda-Königshofen, Germany). The test is based on the principle that live cells with intact cell membranes have a clear cytoplasm whereas nonviable cells are stained blue. Therefore, intact cells can easily be distinguished under microscopic inspection. To determine total cell number, cells were counted in all four quadrants of the hemocytometer (each containing sixteen smaller squares) and calculated with the following equation:
Cell number/ml = Z x DF x 104 ÷ 4
Z : counted cell number in all four quadrants
DF : dilution factor (in the described procedure the factor is 2)
The ratio of viable cells could be determined by setting the number of unstained cells in relation to the total cell number (blue and unstained cells).
2.2.1.4 Human hepatocellular carcinoma cell lines
Hep G2 ATCC HB-8065
Hep 3B ATCC HB-8064
HUH7 JCR B0403
PLC ATCC CRL-8024
The hepatocellular carcinoma cell lines were obtained from the American Type Culture Collection (ATCC).
2.2.1.5 Free fatty acids – quantification assay
For the quantification of free fatty acids in cell pellets, the Free Fatty Acids, Half Micro Test assay from Roche (Roche Diagnostics, Mannheim, Germany) was used.
Metabolically, FFAs are converted into acyl-CoA by ATP and CoA in a reaction
catalyzed by Acyl CS, yielding AMP and pyrophosphate. Acyl-CoA reacts with oxygen in the presence of acyl-CoA oxidase (ACOD) to form 2,3-enoyl-coenzyme A (enoyl- CoA). The resulting hydrogen peroxide (H2O2) converts 2,4,6-tribromo-3-hydroxy- benzoic acid (TBHB) and 4-aminoantipyrine (4-AA) to a red dye in the presence of peroxidase (POD).The dye is measured at a wavelength of 540 nm. For this assay, cells were seeded in 6-well plates (Corning, New York, USA) in an adequate density and grown overnight. This was followed by stimulation with different oleate concentrations for 48 hours. Cells were washed with PBS buffer and harvested. After trypsinizing and centrifugation, culture supernatant was removed. This was followed by washing with PBS two times and centrifugation until a dry cell pellet was obtained by removing supernatant. Cell pellets of all four investigated cell types of HCC were examined after 48h of stimulation with defined concentrations of oleate. A standard solution has previously been prepared according to the instructions in the protocol to generate a standard curve and to ensure accurate measurement. Therefore, Triton® X-100 was dissolved in distilled water and allowed to cool to 15 °C. This solution was combined with a second one, containing palmitic acid, having been dissolved in warm ethanol.
Next, the kit itself was prepared by combining the solutions 1-5 to make reaction mixtures A and B. The assay was performed according to the manufacturer’s instructions.
2.2.1.6 Triglycerides – quantification assay
The quantitative determination of triglycerides in cell pellets was analysed with Triglyceride GPO-PAP assay from Roche (Roche Diagnostics, Mannheim, Germany).
Triglycerides are synthesized in the liver and ingested in food, respectively. The determination of triglycerides is utilized in the diagnosis and treatment of patients having diabetes mellitus, nephrosis, liver obstruction, lipid metabolism disorders and numerous other diseases such as steatosis. This method of enzymatic determination of triglycerides is using a lipoprotein lipase from microorganisms for the rapid and complete hydrolysis of triglycerides to glycerol followed by oxidation to dihydroxyacetone phosphate and hydrogen peroxide. The hydrogen peroxide then reacts with 4-aminophenazone and 4-chlorophenol under the catalytic action of peroxidase to form a red dyestuff (Trinder endpoint reaction). The colour intensity of the red dyestuff formed is directly proportional to the triglyceride concentration in the investigated sample and can be measured photometrically at a wavelength of 540 nm. To determine
the intracellular accumulation of triglycerides in HCC, cells were seeded in an appropriate density in 6-well plates (Corning, New York, USA) and grown overnight.
Thereafter, cells were stimulated with different concentrations of oleate for 48 h and cell pellets were obtained according to the procedure described in chapter 2.2.1.5 (Free fatty acids – assay). A volume of 2 µl of each sample was analyzed according to the manufacturer’s instructions.
2.2.1.7 Oil Red O Staining
Cells perpetually were stimulated with a range of different oleate concentrations in this study. Therefore, the aim was not only to show lipid accumulation by cellular analysis (see chapters 2.2.1.5, 2.2.1.6), but also to visualize this phenomenon. Oil Red O Staining is an adequate method to stain triglycerides and lipids in cells. Compared to alcohol fixation, which removes most lipids, Oil Red O is a non-destructive technique that has to be performed on fresh samples. Cells were seeded in a 6-well and stimulated according to the procedures described in previous chapters (see chapters 2.2.1.5 and 2.2.1.6). Medium was removed gently from each well using a pipette and wells subsequently were rinsed twice with 1 ml of PBS. Fixing was achieved by removing all the PBS and adding 1.0 ml of Formalin 10%. Thereafter, the wells were incubated 5 minutes at room temperature and rinsed with 60% isopropanol followed by drying at room air. For Oil Red O Staining, a stock solution was prepared by dissolving 175 mg Oil Red O in 50 ml isopropanol, stirring overnight and filtering the solution. The working solution consisting of 6 ml stock solution and 4 ml H2Obidest was mixed and filtered subsequently. A volume of 2 ml was added to each dried well. The dye solution was removed after approximately 40 minutes of incubation. In order to clear fixed cells from surplus dye solution, wells were washed four times with H2Obidest. Subsequently, wells were evaluated microscopically and photographed.
2.2.2 Cell-based functional assays
2.2.2.1 XTT - proliferation assay
To quantify cell proliferation, the colorimetric XTT kit (Roche Diagnostics, Mannheim, Germany) was used. This assay bases upon the ability of metabolic active cells to reduce the tetrazolium salt XTT (2,3-bis (2-methoxy-4-nitro-5-sulfophenyl)-5-
[(phenylamino)carbonyl]-2H-tetrazolium hydroxide) to orange coloured formazan by metabolic active cells. Formazan is released into the supernatant. The dye is water soluble and therefore intensity can be read directly with a spectrophotometer at a wavelength of 450 nm and a reference absorbance wavelength of 650 nm. The intensity of the dye directly correlates with the number of metabolically active cells. To quantify the effects of FFA on cell proliferation, cells (4 x 10³ cells per well) were seeded in 96- well tissue culture plates (Corning, New York, USA). A proper attachment of cells was made sure by having grown cells for approximately 24 hours, before adding stimulants.
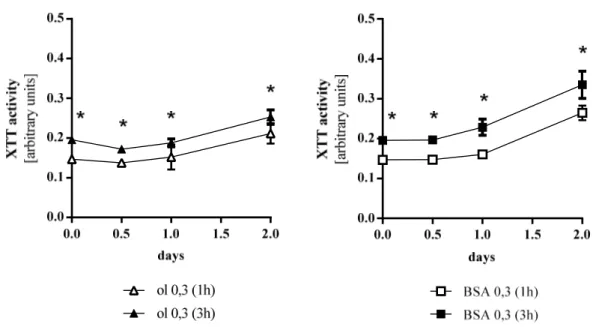
At chosen time points the colorimetric XTT assay (Roche Diagnostics, Mannheim, Germany) was used according to the manufacturer’s instructions. The intensity of the forming dye was measured one, two and three hours after adding XTT reagent with an EMax Microplate Reader (MWG Biotech, Ebersberg, Germany). Figure 2.1 shows the difference of measurements after one hour and three hours. The optical density (OD) is significantly elevated after three hours, however the relation of elevation remains constant. Values of OD at individual time points were corrected for background by subtracting the OD value of blank wells without cells. Each experimental condition was performed in triplicate and experiments were repeated three times.
Figure 2.1 Proliferation of Hep G2 cells as a function of time of measurement. Values were generated for oleate and BSA as stimulants. ol oleate. Values are displayed as mean ± SEM; * p < 0.05 (3h compared to 1h)
2.2.2.2 xCELLigence System
The xCELLigence System from Roche (Penzberg, Germany) allows examining both attachment and proliferation of cells by the use of so-called E-Plates. With the aid of interdigitated micro-electrodes integrated on the bottom of tissue culture E-Plates, xCELLigence measures electrical impedance. This value correlates with the number of cells and thus can be used as a marker of proliferation and is transmitted in real time as a change in cell index to the connected laptop. E-Plates were coated at the beginning of the experiment with 100 µl transparent DMEM (without phenol red) with FCS and equilibrated for 30 minutes at room temperature. 2 x 10³ cells/100 µl DMEM with FCS were added after the measurement of background resistance. The E-Plate was inserted into the analyzer after incubating the plate for 10 minutes at room temperature. As previously described for XTT-assay in chapter 2.2.2.1, cells were grown for 24 hours for attachment. Measurement then was paused for adding stimulants and then restarted again. The obtained data was evaluated with RTCA software. In this setting, xCELLigence system exclusively was used for the purpose of detecting the proliferation of HCC cells. The purpose therefore was not only to have an additional approach to measure proliferation apart from XTT-assay but also to compare those two methods.
The advantage of xCELLigence system is that the number of generated test values is not limited, as measurements can be observed online. Thus, tiny intervals between measurements were possible and consequentially a more specific surveillance of proliferation. Experimental trials were conducted with all four HCC cell lines. T-Test was used at measure points corresponding to those of XTT-assay (see chapter 3.3.2).
Measurement with xCELLigence started when plates with seeded cells were put into the reading device in the incubator and then grown for approximately 24 hours. With this difference to XTT-assay, where the first measurement takes place after adding FFA to cells, time points have to be regarded carefully for comparison, here. For instance, 0.0 days in XTT-assay (see Figures in chapters 3.3.1, 3.3.2), that is to say the time point, when stimulants were added, corresponds to the time point “22 hours” for Hep G2 in Figure 3.11.
2.2.2.3 Migration assay
The Cultrex 96 Well Cell Migration Assay (Trevigen, Gaithersburg, USA) was used to quantify the migratory potential of HCC cells. The assay was performed according to the manufacturer’s instructions. In general, this assay is based on a plate consisting of
two compartments being separated by a microporous membrane. Cells are seeded in the upper compartment and the membrane allows them to migrate through the pores to the lower compartment, where chemotactic agents are present. After an appropriate incubation time, migrated cells were detached carefully from the lower side of the membrane using a detachment buffer and quantified calcein acetoxymethylester (calcein AM). Calcein AM is absorbed by the cells, and intracellular esterases cleave the acetoxymethylester moiety to generate free calcein, which can be detected fluorometrically. Cells were seeded into the upper compartment of the provided 96-well plate with a density of 4 x 10⁴ cells/ well in DMEM. The distinction between random and directional migration was made by adding medium with 20% FCS or 0% FCS, respectively, to the lower compartment (see chapter 3.4.1). After incubation at 37 °C for 5 hours, cell migration was quantified by fluorimetry using a SPECTRAFluor Plus microplate reader (Tecan, Männedorf, Switzerland). Each experimental condition was performed in triplicates and experiments were repeated three times, at least.
2.2.3 Analysis of cell culture supernatants
2.2.3.1 Clinical laboratory analysis
Supernatant analysis was performed at the Department of Clinical Chemistry and Laboratory Medicine (University Hospital of Regensburg, Germany) using the Advia 1800 analyzer (Siemens Healthcare Diagnostics, Eschborn, Germany). To determine cytotoxic effects of FFA, cells were seeded in 6 well plates (Corning, New York, USA) and grown overnight followed by stimulation with different concentrations of oleate for 48 hours. Subsequently, supernatants were collected and centrifuged at 20,000 g for 5 minutes in order to remove debris and transferred in new cups for measurement. As a marker for cell viability, the amount of lactate dehydrogenase (LDH) is commonly used and therefore was determined in laboratory analysis, here.
2.2.3.2 Cytotoxicity Detection Kit
PlusLactate dehydrogenase (LDH), a cytoplasmatic enzyme that is present in all cells, is rapidly released into the cell-culture supernatant upon damage of the plasma membrane.
It is a fairly stable enzyme which is widely used to evaluate the presence of toxicity of tissue and cells. In the Cytotoxicity Detection Kit PLUS (LDH) (Roche Diagnostics,
Mannheim, Germany) LDH activity is determined by a coupled enzymatic reaction, whereby the tetrazolium salt INT (2-(4-iodophenyl)-3-(4-nitrophenyl)-5-phenyl tetrazolium) is reduced to formazan. An increase in the amount of dead or plasma- membrane-damaged cells results in an elevated level of LDH enzyme activity in the culture supernatant. This increase in the supernatant directly correlates to the amount of formazan formed during a limited period of time. The formazan dye formed is water soluble and thus can be read with spectrophotometer.
All supernatants to be examined were centrifuged (2,000 rpm, 5 minutes) for this assay.
For an amount of one hundred tests, a working solution was mixed by adding 250 µl Catalyst (Diaphorase/NAD+ mixture) solved in H2O to 11.25 ml dye solution (iodotetrazolium chloride and sodium lactate). A volume of 100 µl of each sample was diluted 1:5 with PBS buffer. A mixture of each 100 µl/well working solution and diluted sample were incubated for approximately 30 minutes at room temperature in the dark. After the reaction, the assay was terminated by adding 50 µl stop solution per well. The dye formed was read with EMax® Microplate Reader (MWG Biotech, Ebersberg, Germany) at a wavelength of 490 nm and a reference absorbance wavelength of 650 nm.
2.2.4 Statistical analysis
Values are presented as mean ± SEM or ± SD as indicated. Comparisons between groups were made using the Student’s unpaired t-test or when appropriate, ordinary one-way ANOVA test. A p value < 0.05 was considered statistically significant and p < 0.01 highly significant. All calculations were performed using the statistical computer package GraphPad Prism version 6.00 for Windows (GraphPad Software, San Diego, USA).
3. Results
Free fatty acids (FFA) play an important role in conjunction with hepatocellular carcinoma (HCC) or its pathogenesis, respectively. However, in terms of the effects of proliferation and migration in patients already having developed a HCC, no data is available at present. The aim of the thesis was to address this issue. In particular, the focus was placed on the following four aspects:
3.1 Effects of free fatty acids on cytotoxicity of HCC cells
3.2 Effects of free fatty acids on lipid accumulation in HCC cells 3.3 Effects of free fatty acids on proliferation of HCC cells.
3.4 Effects of free fatty acids on migration of HCC cells 3.5 Effects of glucose in culture medium on HCC cells.
3.1 Effects of free fatty acids on cytotoxicity of HCC cells
First, HCC cells were stimulated with different doses of oleate to reveal the cytotoxic range. Chronic exposure to elevated levels of FFA causes cell death in hepatocytes as it was shown for non-alcoholic steatohepatitis (NASH). The toxicity of saturated FFA such as palmitate thereby is much greater to human hepatoma cells (Hep G2) than unsaturated ones (Srivastava and Chan, 2008). Oleate is an unsaturated FFA commonly used in HCC research being an appropriate fatty acid for a gentle stimulation of HCC cells. Thus, oleate exemplarily was used in this thesis for all experimental trials.
3.1.1 Effects of oleate treatment on HCC lactate leakage
Srivastava et al. already revealed that based on measurements of lactate dehydrogenase (LDH) as a well-established marker for cytotoxicity, there is no significant release of LDH detectable in Hep G2 cells, which were exposed to oleate at an elevated physiological concentration of 0.7 mM (Srivastava and Chan, 2007). Our analysis of supernatants in the Department of Clinical Chemistry and Laboratory Medicine showed no explicit difference between the cells having been stimulated with concentrations up
to 0.6 mM oleate and control cells, which were incubated with DMEM (1% FCS) for 48 hours (Figure 3.1). No cytotoxicity could be found for the tested dose range. Results could be confirmed by using the Cytotoxicity Detection Kit Plus from Roche (Roche Diagnostics, Mannheim, Germany) (Figure 3.2). The experimental trial was conducted with all four cell lines of this study, that is to say Hep G2, Hep 3B, HUH7 and PLC.
Figures 3.1 and 3.2 exemplarily show the results for HUH7 cells.
Figure 3.1 LDH leakage for the detection of cytotoxicity in HUH7 cells treated with different doses of oleate. ol oleate, ctr control. The amount of lactate dehydrogenase (LDH) was measured 48 h after stimulation. Analysis was performed by the Departement of Clinical Chemistry and Laboratory Medicine (University Hospital of Regensburg, Germany).
Figure 3.2 LDH leakage for the detection of cytotoxicity in HUH7 cells treated with different doses of oleate. ol oleate, ctr control. The amount of lactate dehydrogenase (LDH) was measured 48 h after stimulation. For analysis, Cytotoxicity Detection Kit Plus from Roche was used.
3.1.2 Effects of oleate treatment on cellular morphology
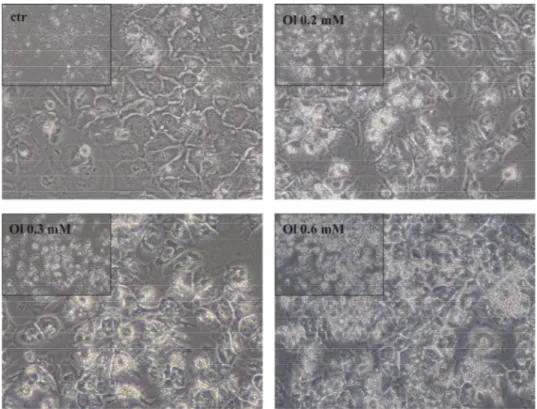
Whilst supernatants were collected for technical analysis, cells were photographed for documentation of macroscopically visible effects of stimulation with oleate. HUH7 cells cultivated in medium with oleate 0.2 mM, 0.3 mM and 0.6 mM, respectively, visually showed no signs of cytotoxicity compared to control cells. However, multiple tiny globules of fat accumulated, which could be seen as the morphological correlate for lipid uptake by HCC cells. Additionally, the cell layer increasingly condensed dose- dependently. More precisely, high concentrations of oleate such as 0.6 mM were difficult to be evaluated with regards to toxicity due to the conglomeratic growth of cells. This phenomenon considerably appeared for the highest oleate concentration, which was 0.6 mM. A link between increasing oleate concentration and visibly detectable lipid accumulation could be drawn, as well (Figure 3.3).
IV
Figure 3.3 HUH7 cells stimulated with oleate 0.2 mM, 0.3 mM, 0.6 mM, respectively (magnification 40x). Ol oleate, ctr control. Lipid droplets accumulate considerably with increasing concentrations of oleate. No cytotoxicity visibly detectable.
3.2 Effects of free fatty acids on lipid accumulation in HCC cells
The next step in this study was to investigate the role of FFA with regards to intracellular lipid accumulation. Therefore, a smaller dose range was chosen to ensure nontoxic concentrations. Liver is the key organ for metabolism of free fatty acids (FFA) (Cowen et al., 1977) and FFA are the initial point of triglyceride synthesis in liver tissue (Donnelly et al., 2005). Animal model trials have shown an increased level of FFA in plasma of tumor bearing animals (Frederick et al., 1956). Tumor cells are believed to use elevated amounts of FFA as metabolic substrates (Spector et al., 1967). Eventually, excess supply drawn from mobilization of fat tissue is utilized as a fuel source in hypermetabolic cancer patients (Legaspi et al., 1987). Cells were examined by focussing on FFA (chapter 3.2.1) and triglycerides (TG) (chapter 3.2.2) uptake. The uptake in the intracellular compartment represents an inalienable condition concerning further metabolic transformations of the FFA.
3.2.1 Accumulation of free fatty acids
HCC cells were stimulated with oleate (0.1 mM, 0.2 mM and 0.3 mM) for 48 hours.
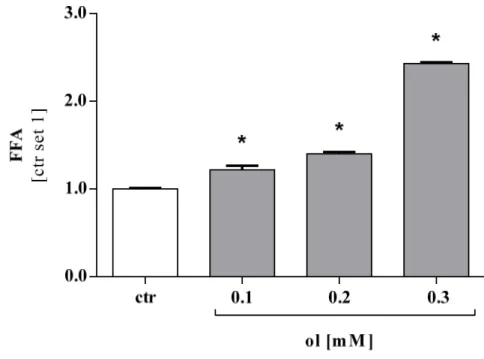
Cells were harvested and the obtained cell pellet was examined with FFA quantification assay from Roche (see chapter 2.2.1.5). The amount of FFA was significantly higher in cell pellets that were cultivated in medium with oleate compared to control.
Furthermore, the levels of FFA increased with the concentration of oleate in the culture medium. To represent the effects proved for all four cell lines, results for Hep 3B cells are displayed here (Figure 3.4) exemplarily.
Figure 3.4 Amount of FFA measured in cell pellets of Hep 3B compared to control cells.
Measurement was performed after stimulation for 48h with indicated oleate concentrations. FFA Free fatty acids, ol oleate, ctr control. Values are displayed as mean ± SEM; * p < 0.05 compared to control.
3.2.2 Accumulation of triglycerides
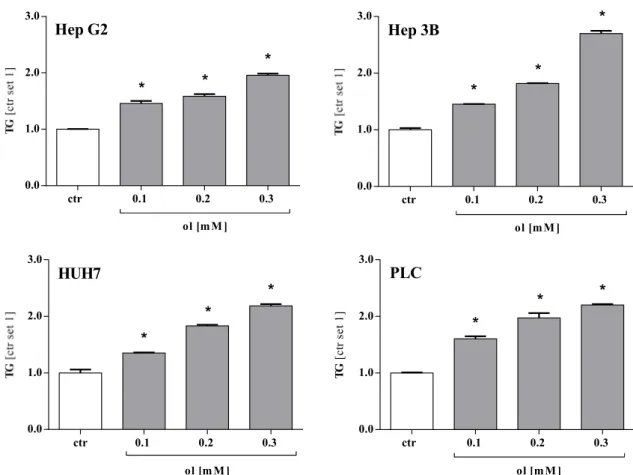
FFA appear in their free form, but are also esterificated to glycerine in the intracellular compartment yielding triglycerides. The level of FFA was measured in cells grown with the same experimental conditions as described in chapter 3.2.1. For analysis, Triglyceride quantification assay from Roche (see chapter 2.2.1.6) was used. The results were similar to the findings for FFA (see chapter 3.2.1). Compared to control, the
triglyceride level was significantly elevated in cell pellets that were cultivated in medium with oleate in the first place (Figure 3.5). Comparably to our results detected for FFA in chapter 3.2.1, the levels of triglycerides increased proportionally with the concentration of oleate in the culture medium applied on cells before investigation.
ol [m M ]
ctr 0.1 0.2 0.3
0.0 1.0 2.0 3.0
* *
* Hep G2
ol [m M ]
ctr 0.1 0.2 0.3
0.0 1.0 2.0
3.0 *
*
* Hep 3B
ol [m M ]
ctr 0.1 0.2 0.3
0.0 1.0 2.0 3.0
*
*
* HUH7
ol [m M ]
TG[ctr set 1]
ctr 0.1 0.2 0.3
0.0 1.0 2.0 3.0
* *
* PLC
Figure 3.5 Accumulation of Triglycerides in four HCC cell lines treated with different doses of oleate for 48 h. ol oleate, ctr control, TG triglycerides. For analysis, cells pellets were used. TG triglycerides. Values are displayed as mean ± SEM; * p < 0.05 compared to control.
Significantly elevated intracellular concentrations of both, FFA and triglycerides could be detected. In addition to this finding, a dose-dependent conduct was striking.
3.2.3 Oil Red O Staining
Cell analysis with regards to pathways of FFA being present in the culture medium of HCC cells revealed uptake of FFA. The discovered storage in form of triglycerides could be seen as initial step for further metabolic processes. These findings conjured up the question whether the lipid accumulation could actually be detected visually, as well.
In chapter 3.1.2, photographs taken of cells that were stimulated with oleate provided an indication for lipid uptake in form of intracellular lipid droplets. The aim now was to highlight these lipid droplets with a special staining. Oil Red O Staining technique was used following the protocol described in chapter 2.2.1.7. Cells optically clearly showed lipid accumulation in general as well as dose dependence. The latter could be visualized by the both macroscopically and microscopically detectable growing intensity of Oil Red dye intensifying with the applied concentration of oleate (Figure 3.6).
Figure 3.6 Oil Red O Staining of PLC (A) and HUH 7 (B) cells 48 hours after adding the indicated stimulants (magnification 40x). Ol oleate. The red dye tints fat in general after a fixation process of the cells. Red staining and thus lipid accumulation increases with concentration of oleate.
3.3 Effects of free fatty acids on proliferation of HCC cells
A recent review published by Duan et al. in 2012 emphasizes the significance of nonalcoholic fatty liver disease (NAFLD) of being a risk factor for contracting hepatocellular carcinoma. NAFLD is the hepatic manifestation of the metabolic syndrome, which is characterized by various abnormalities such as insulin resistance, obesity, hypertension, but also hyperlipidemia (Siegel et al., 2009). Thus, the conclusion could be drawn that the metabolic syndrome including elevated plasma levels of free fatty acids plays a key role in the development of HCC. Its relevance for tumor progress is probable. Consequently, the proliferation of HCC cells was investigated while creating an environment similar to conditions being present in hyperlipidemia. Two assays with different techniques were used for examining proliferation. XTT – proliferation assay profits of a chemical reaction where a dye is formed that can be measured colorimetrically (see chapter 2.2.2.1). The xCELLigence System from Roche (see chapter 2.2.2.2) by contrast, quantifies proliferation by means of electric impedance.
3.3.1 Measurement of proliferation by XTT proliferation assay
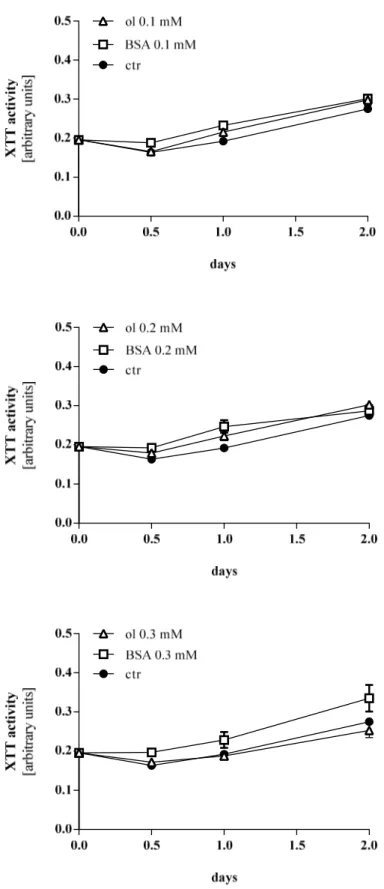
For investigation of proliferation, cells were preincubated with a definite range of oleate concentrations. Experimental trials were conducted equally in terms of time period, concentrations and cell density. Stimulation of HCC cells with oleate concentrations of 0.1 mM and 0.2 mM showed no effect on proliferation activity compared to control and cells being stimulated with BSA of equal concentration, respectively (Figure 3.7).
Oleate 0.3 mM appeared to have a rather negative impact on proliferation, as values lag behind control. The sharp bend which can be noticed in several graphs at the beginning of the assay (e.g. at 0.5 days in Figure 3.7) is a known phenomenon for this method. A possible reason is that cells are likely to react very sensitive, when a new medium with stimulants is applied and therefore initially tend to lower proliferation rates.
Figure 3.7 XTT activity of Hep G2 cells treated with oleate, BSA or unstimulted control cells. ol oleate, ctr control Cells were preincubated with indicated concentrations of oleate and BSA. Extinctions measured 3h after adding XTT to cells are depicted. Values are displayed as mean ± SEM.
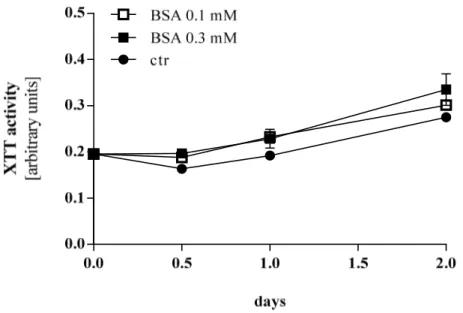
Interestingly, BSA showed a slightly higher proliferation rate compared to cells treated with oleate and control cells, respectively (Figure 3.8).
Figure 3.8 XTT activity of Hep G2 cells stimulated with different doses of BSA. ctr control. Values are displayed as mean ± SEM.
Similar findings were uncovered for HUH 7 cells (Figure 3.9). No significant change of proliferation rate could be obtained for stimulation with oleate.
Figure 3.9 XTT activity of HUH7 cells treated with oleate, BSA or unstimulted control cells. ol oleate, ctr control Cells were preincubated with indicated concentrations of oleate and BSA. Extinctions measured 3h after adding XTT to cells are depicted. Values are displayed as mean ± SEM.
The impact of BSA on proliferation (see Figure 3.8) was also confirmed for HUH 7 cells, (Figure 3.10) to an even more obvious extend as revealed for HepG2.
Figure 3.10 XTT activity of HUH7 cells stimulated with different doses of BSA. ctr control. Values are displayed as mean ± SEM.
3.3.2 Measurement of proliferation by xCELLigence System
Another approach to identify cell viability and proliferation is xCELLigence system from Roche (Roche Diagnostics, Mannheim, Germany, see chapter 2.2.2.2). In contrast to XTT assay, which metabolically forms a dye, the xCELLigence system makes use of impedance as a marker for proliferation. The differences as well as advantages of each method are highlighted in chapter 2.2.2.1 and 2.2.2.2. Thus, this method completed the investigations of proliferation by taking a completely different approach. For concentrations of 0.1 mM and 0.2 mM, no significant changes in proliferation rates were detected for all cell lines except for HUH 7. At a concentration of 0.2 mM, proliferation of cells was significantly higher all along the time slot with BSA, when compared to oleate (Figure 3.11)
Figure 3.11 Proliferation of HUH7 cells stimulated with oleate 0.2 mM and BSA 0.2 mM.
xCELLigence system was used as measurement tool. Red = oleate, green = BSA; blue = control (= BSA 0.1). Values are presented as means ± SD. * p < 0.05 oleate compared to BSA, ** p < 0.01 oleate compared to BSA.
Comparing proliferation rates obtained for 0.3 mM between the cell lines, several aspects were striking. Figure 3.12 depicts the results obtained for Hep G2, Hep 3B and PLC cells at a concentration of 0.3 mM. For all cell lines, oleate exhibited an inhibitory effect. Compared to control, the proliferation rate of oleate-treated Hep 3B cells was significantly lower at 0.5 days (36 hours). For Hep G2 cells, it was significantly lower at 0.5 days (36 hours) and 1.0 days (48 hours), respectively. PLC cells had a significantly lower proliferation rate for oleate 0.3 mM compared to BSA and control all along the time slot (Figure 3.12). Comparing BSA to control, only Hep 3B cells showed a significant increase in proliferation rate at 0.5 days (37 hours) and 1.0 days (48 hours) and a significant increase at 2.0 days (72 hours) and 2.8 days (96 hours).
As results obtained for XTT-assay (see chapter 3.3.2) gave hints that BSA itself might play a role, BSA treatment in comparison to oleate was investigated. Results for HUH7 cells depicted in Figure 3.11 already showed a distinct difference between BSA 0.2 mM and oleate 0.2 mM for the benefit of BSA. This phenomenon occurred for the other cell lines as well, however initially at a concentration of 0.3 mM. All cell lines showed significantly higher proliferation rates when stimulated with BSA than with oleate (Figure 3.12). The proliferation rate of Hep 3B and PLC cells in BSA was significantly elevated compared to oleate treated cells, all along the analyzed time slot. For Hep G2 cells, a significant elevation was revealed at 0.5 days (36 hours) and 1.0 days (48 hours) after adding stimulants whereas after 2.0 days (72 hours) and 3.0 days (96 hours), proliferation was significantly higher. To conclude, Hep G2, Hep 3B and PLC cells
showed significantly higher proliferation rates for BSA compared to oleate. This surprising aspect was already shown applying XTT-assay (see chapter 3.3.1).
Figure 3.12 Proliferation rates of Hep G2, 3B and PLC cells stimulated with oleate 0.3 mM and BSA 0.3 mM. xCELLigence system was used as measurement tool. Red = oleate, green = BSA; blue = control (= BSA 0.1). Values are presented as means ± SD. + p < 0.05 for BSA compared to control, ++ p
< 0.01 for BSA compared to control, +++ p < 0.001 for BSA compared to control; # p < 0.05 for oleate compared to control, ## p < 0.01 for oleate compared to control, ### p < 0.001 for oleate compared to control; * p < 0.05 for oleate compared to BSA, ** p < 0.01 for oleate compared to BSA , *** p < 0.001 for oleate compared to BSA
Finally, oleate and BSA concentrations of each cell line were compared among each other. Surprisingly, all cells reacted similar. A dose-dependent induction of proliferation in BSA-treated cells was described in chapter 3.3.1, and could be confirmed here. A reciprocal effect was found for oleate. More precisely, a decrement in cell proliferation was noticeable for oleate. Thus, not only a difference between oleate and BSA was revealed, but also a dose dependent change in proliferation for both, oleate and BSA.
Figure 3.13 exemplarily depicts the results found for HUH 7 cells.
Figure 3.13 Proliferation of HUH 7 cells stimulated with oleate and BSA. xCELLigence system was used as measurement tool. Red = 0.3 mM, green = 0.2 mM; blue = 0.1 mM. Values are presented as means ± SD.
In summary, investigation of proliferation showed various effects depending on different stimulants, especially for a concentration of 0.3 mM, several distinctive features could be revealed. Amongst others, oleate seemed to have a negative effect on proliferation, whereas BSA dose-dependently elevated proliferation rates especially when using xCELLigence system as measurement tool but also with XTT proliferation assay (see chapter 3.3.1).
3.4 Effects of free fatty acids on migration of HCC cells
Tumor cells in general are characterised by several changes in metabolism. Apart from an increase in proliferation, the capacity to form metastases is an important feature, too.
Metastasis is the most frequent cause of death for patients with cancer (Yamaguchi et al., 2005). Tumor cell migration is one step in the process of forming metastases.
Therefore, it is important to know how changes in the microenvironment trigger tumor cells to invade tissue. Conceptually, there are two forms of cell migration to be distinguished. The first is directional cell migration with intrinsic cell directionality and external regulation. On the other hand, there is random cell migration, which occurs when a cell possesses relatively low intrinsic directionality (Petrie et al., 2009).
Consequently, the next step of this study was to investigate the migratory potential of HCC cells with FFA in the culture medium being present. The aim was to create a microenvironment similar to the one in patients suffering from the metabolic syndrome.
Directional cell migration was simulated by providing a culture medium with 20% FCS in the lower compartment of the migration plate, whereas for random migration 0%
FCS was used (see chapter 2.2.2.3).
3.4.1 Effect of free fatty acids on the migratory potential of HCC cells
Migration assay from Cultrex (Trevigen, Gaithersburg, USA) was used to analyze the migration of HCC cell lines (see chapter 2.2.2.3). For this assay, cells were incubated for 24 hours with stimulants before migration assay was applied. Results for PLC cells are presented exemplarily, here. In random cell migration, no significant change of the migratory potential was observed for both stimulants, oleate and BSA compared to control (Figure 3.14).
Figure 3.14 Random cell migration of PLC cells stimulated with oleate and BSA. ctr control, ol oleate. No significant difference between oleate, BSA and control detectable. Values are presented as means ± SD.
Next, directional cell migration was analyzed. Similar to the findings for random cell migration, both BSA and oleate exhibited no significant effects on migration of PLC cells (Figure 3.15).
Figure 3.15 Directional cell migration of PLC cells stimulated with oleate and BSA. ctr control, ol oleate. No significant difference between oleate, BSA and control detectable. Values are presented as means ± SD.
To sum up, no significant change in the migratory potential was observed for both, oleate and BSA neither for random, nor for directional migration.