Temperature and Pressure Effects on
Lateral Membrane Organization of Model and Natural Membrane Lipids and Lipid-Peptide
and Lipid-Protein Interactions
DISSERTATION
zur Erlangung des akademischen Grades Doktor der Naturwissenschaften
(Dr. rer. nat.)
vorgelegt von
Nagarajan Periasamy B.Pharmacy., M.E., M.Res.,
aus Mohanur, India
eingereicht bei der Fakultät Chemie
der Technische Universität Dortmund
Dortmund 2007
Erstgutachter: Prof. Dr. Roland Winter Zweitgutachter: Prof. Dr. Heinz Rehage Dritter Prüfer: PD. Dr. Claus Czeslik
Tag der mündlichen Prüfung: 28.01.2008
Dedicated to my dear parents
Acknowledgements
First of all I would like to express my gratitude to my supervisor Prof. Dr. Roland Winter for his continuous support and guidance starting from date first. I am very much pleased to carry out my doctoral research under his supervision and thankful to him for introducing me in the field of liposome research.
My special thanks to PD Dr. Claus Czeslik for his invaluable help in all the experimental part and fruitful discussions throughout this work.
I thank Prof. Dr. Heinz Rehage and PD Dr. Claus Czeslik for being members of the examination committee.
I would like to thank Prof. Dr. Heinz Rehage and Dr. Anuj Shukla for their help and cooperation in carrying out the DLS measurements.
I would like to thank Prof. Dr. Rudi F. Vogel and his group at the Technische Universität München for fruitful collaborations. I thank Holger Teichert at TUM who expressed and purified LmrA protein in order to carry out this project.
I would to thank Prof. Dr. E Gratton and his group at the LFD-University of California, Irvine, in particular Dr. Theodore L Hazlett (Chip), Dr. Susana Sanchez, Dr. Oliver Holub and Claudia Y. Lee for their help and cooperation in carrying out the 2-photon excitation fluorescence microscopy measurements.
I thank Michael Sulc, Vytautas Smirnovas, Shuang Zhao, Christoph Jeworrek, Suman Jha, Matthias Pühse, Christoph Jeworrek, Dr. Nadeem Javid, Dr. Ewa Powalska, Lally Mitra, Diana Radovan, Linus Okoro, Andrea Gohlke, Dr. Rajesh Mishra, Dr. Roland Krivanek, Dr. Jörg Baranski, Dr. Karsten Vogt, Dr. Guido Jackler, Dr. Monika Khurana, Gurpreet Singh, Maximilian Andrews, Oliver Hollmann and Christian Reichhart for providing a co-operative and diversely cultural working environment. I wish to thank Dr. Katrin Weise for performing AFM experiments and Daniel Sellin for translating my thesis summary (Zusammenfassung) in German. I thank my friend Mahesh Kulharia for his support and help.
I
I thank and appreciate Dr. Werner Horstmann, Andrea Kreusel, Bertina Schuppan, Kirsten Skodzik, Milan Saskovic for their help in official matters. I would like to thank the mechanical and electrical workshop people for their help in fixing and setting up many instruments.
I would like to thank the International Max-Planck Research School in Chemical Biology (IMPRS-CB) and Dr. Jutta Roetter for providing financial support in the beginning of my PhD.
I thank all my friends, living in Aldalbert Str. 149 who make my life more comfortable and giving me pleasant memories of my stay in Dortmund. Particularly I thank my friend Nageswaran Rajendran (Eswar) for his company and stimulating discussion in many topics from physics to philosophy.
I thank my fiancée, Vidyalakshmi Rajendran who is taking care of my personal work and supporting me throughout the last 2 years.
I thank and acknowledge my parents for their endless love and all support throughout my life, which is always driving me. I thank my brother and sister as well for their love which keeps me always happy.
II
Contents
1 INTRODUCTION...1
1.1 BIOMEMBRANES... 1
1.2 CLASSIFICATION OF MEMBRANE LIPIDS. ... 3
1.2.1 Glycerophopsholipids (GPLs) ...4
1.2.2 Sphingolipids ...4
1.2.3 Cholesterol ...5
1.3 LATERAL MEMBRANE PHASES AND PHASE TRANSITIONS... 6
1.4 LATERAL PRESSURE PROFILE... 8
1.5 LIPID PROTEIN INTERACTIONS... 9
1.6 LIPID-PEPTIDE AND LIPID-PROTEIN INTERACTIONS IN ARTIFICIAL CELLS. ... 11
1.7 MODEL PEPTIDE – GRAMICIDIN D... 13
1.8 MULTI-DRUG RESISTANCE... 15
1.8.1 LABs and multidrug resistance...15
1.9 MODEL PROTEIN –LMRA ... 16
1.10 AIM OF THIS RESEARCH... 18
2. MATERIALS AND METHODS ...20
2.1 MATERIALS... 20
2.2 FLUORESCENCE SPECTROSCOPY... 21
2.2.1 Basic theory of fluorescence...21
2.3 FLUORESCENCE ANISOTROPY... 22
2.3.1 Experimental part – Sample preparation for anisotropy measurements...24
2.4 LAURDAN FLUORESCENCE SPECTROSCOPY... 24
2.4.1 Experimental part – Sample preparation for lipid-peptide interactions ...25
2.4.2 Experimental part – Sample preparation for lipid-protein interactions...26
2.4.3 Fluorescence spectrometer setup ...27
2.4.4 High pressure cell ...30
2.5 CIRCULAR DICHROISM SPECTROSCOPY... 31
2.5.1 Far UV CD spectra and protein secondary structure ...33
2.5.2 Experimental part – Sample preparation for Far UV CD measurements...34
2.6 2-PHOTON EXCITATION MICROSCOPY... 34
2.6.1 Experimental part – GUV preparation...35
2.6.2 Experimental setup – Two-Photon excitation microscopy ...36
2.7 ATOMIC FORCE MICROSCOPY (AFM) ... 37
2.7.1 Experimental part – Sample preparation...39
2.7.2 AFM setup ...39
2.8 TRANSPORT ACTIVITY OF LMRA IN DIFFERENT RECONSTITUTED SYSTEM. ... 39 III
2.8.1 Hoechst-33342 transport in proteoliposomes. ...39
2.8.2 Experimental part – Sample preparation for transport activity assay ...40
2.9 ATPASE ACTIVITY USING COUPLED ENZYME ATPASE ASSAY... 40
2.9.1 Experimental part – Sample preparation for ATPase activity assay ...41
3. RESULTS AND DISCUSSION ...43
3.1 PART I: LIPID – PEPTIDE INTERACTIONS... 43
3.1.1 Influence of temperature on the phase behavior of ternary POPC:SM:Chol lipid systems...43
3.1.2 Influence of pressure on the phase behavior of ternary POPC:SM:Chol lipid systems...45
3.1.3 The effect of gramicidin D (GD) incorporation...46
3.1.4 Summary part-I: Lipid – peptide interactions ...48
3.2 PART-II: LIPID –PROTEIN INTERACTIONS... 49
3.2.1 Phase behavior of the DMPC lipid system with and without LmrA...49
3.2.2 Phase behavior of the DOPC lipid system with and without LmrA.. ...51
3.2.3 Phase behavior of the DMPC + 10 mol% cholesterol lipid system with and without LmrA. 52 3.2.4 Phase behavior of the raft lipid system with and without LmrA. ...54
3.2.5 Phase behavior of the natural lipid system with and without LmrA...56
3.2.6 AFM measurements on model membrane systems...58
3.3 SUMMARY PART-II: LIPID – PROTEIN INTERACTIONS... 61
3.3.1 Temperature dependent generalized polarization measurements...61
3.3.2 Pressure dependent generalized polarization measurements ...62
3.3.3 AFM measurements...63
3.4 PART-III: SECONDARY STRUCTURE OF LMRA AS A FUNCTION OF TEMPERATURE... 64
3.4.1 Summary part-III: Secondary structure of LmrA as a function of temperature ...66
3.5 PART-IV: LATERAL INHOMOGENEITY OF MODEL RAFT MIXTURES... 67
3.5.1 Two-photon excitation fluorescence microscopy. ...67
3.5.2 Steady-state fluorescence polarization measurements of raft mixtures ...69
3.5.3 Summary Part-IV: Lateral inhomogeneity of raft mixtures...70
3.6 PART-V: ACTIVITY MEASUREMENTS OF THE RECONSTITUTED LMRA SYSTEMS... 71
3.6.1 Hoechst-33342 transport in proteoliposomes. ...71
3.6.2 ATPase activity using coupled enzyme ATPase assay. ...72
3.6.3 Pressure effect on the ATPase activity of the LmrA reconstituted in DMPC vesicles. ...73
3.6.4 Pressure effect on the ATPase activity of the LmrA reconstituted in raft mixtures...74
3.6.5 Summary Part-V: Effects of pressure on the activity of reconstituted LmrA in different.Environments ...75
4. CONCLUSIONS ...78
5. ZUSAMMENFASSUNG ...84
6. REFERENCES...91
IV
1. Introduction
1.1 Biomembranes
Cell membranes constitute one of the fundamental structural and functional elements of living organisms. Most fundamentally, the plasma membrane of a cell denotes the outer boundary of the system and distinguishes between the inside and the outside of the system. Besides the plasma membrane, the eukaryotic cells have a number of well defined internal membranes associated with the cell nucleus and the organelles.
Membranes thereby become the most abundant cellular structure in all living system.
This compartmentalization allows different composition between the inside and outside of the system. Communication across the boundary becomes essential both for transport of nutrients and waste and for the cellular response to the external environments. These demands for a more complex membrane function than just creating the boundaries to system. Biological membranes consist of a macromolecular aggregate of lipids and proteins, their association with each other are governed largely by the hydrophobic effect. Once the membrane is formed it is further stabilized by hydrogen bonds, electrostatic attractions and van der Waals forces.
A simple but often used model which explains the gross organizationand structure of the proteins and lipids of biological membranes is known as “fluid mosaic model” [1].
This model considers cell membranes as being a two dimensional fluid bilayer composed of phospholipids in which the proteins that are integral to the membraneare a heterogeneous set of globular molecules. The ionic and highlypolar groups of the protein protruding from the membrane into the aqueous phase, and the non-polar groups are largely buried in the hydrophobic interiorof the membrane. These globular molecules are partially embeddedin a matrix of phospholipids. Hence, the bulk of the phospholipids areorganized as a discontinuous, fluid bilayer. According to this model, membranes are a dynamic system in which proteins and lipids can move and interact.
Besides proteins, the major components of natural membranes are lipids and cholesterol, with a small amount of other materials such as fatty acids. This model emphasizes that the membrane lipids do not form a homogenous phase consisting of lipids, cholesterol and proteins, but a mosaic of domains with unique compositions.
The relative amounts of these components vary from membrane to membrane, and the type of lipids in membranes can also vary.
1
Figure 1.1: The Fluid-Mosaic-Model of the cell membrane [2]
The nature and concentration of lipids varies in both the inner and outer walls of the lipid bilayer in biomembranes [3]. From the current literature, it is evident that cholesterol and sphingolipids are abundant and restricted to the outer leaflet, and also it suggests that these lipids are not distributed uniformly but rather they cluster into domains called as lipid rafts. Lipid rafts have unique physicochemical properties that direct their organisation into liquid-ordered phases floating in a liquid-disordered environment. Lipid rafts have been morphologically characterized as small membrane patches that are tens of nanometers to micrometer in diameter. These lipid rafts may play a vital role in many important biological processes, such as signal transduction, apoptosis, cell adhesion and migration, synaptic transmission, organization of the cytoskeleton and protein sorting [4-11]. Besides these functions, lipid rafts are believed to act as a port of cellular entry for a wide range of viruses, bacteria and toxins [12]. Membrane proteins and lipidated peptides or proteins would either reside in or be excluded from these rafts, depending on their physio-chemical properties.
Hence, it is important to study their properties, such as the lateral organization and structure of lipid rafts and their influence on the conformation and activity of membrane proteins. The lateral structure of the membrane controls the mechanical
2
properties (which is important for the shape of cells). In order to understand how proteins function in a membranes it is necessary to determine the ways in which proteins interact with the lipid bilayer, more specifically how the proteins influence the local structure and composition of the bilayer, and on the other hand, how changes in the lipid-bilayer physical properties modulate the functional state of the proteins.
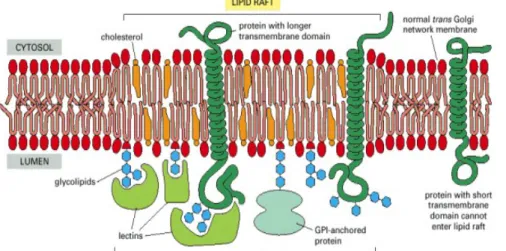
Figure 1.2: Lipid raft or microdomain that is enriched in cholesterol and sphingolipids.
(Alberts et al., The Cell, 2004)
1.2 Classification of Membrane Lipids
In general, lipid can be defined as a biological material soluble in organic solvents, such as ether or chloroform. Lipids are amphipathic (amphiphilic) molecules - they have two different natures, one is polar (hydrophilic) which is stable in aqueous solution, and the other is non polar (hydrophobic) aliphatic or aromatic hydrocarbon, which is more stable in an non-aqueous environment.
The hydrocarbon chains in the non polar part can contain different numbers of carbon atoms, and the bonds between the carbons atoms can be single (saturated) or double (unsaturated). A hydrocarbon chain can be turned into a fatty acid by attaching a carboxylic acid (–COOH) group at the end. The fatty acids are the fundamental building blocks of all lipids in living matter. Plants and animals use a variety of fatty acids with chain lengths ranging from two to thirty-six. The most common chain lengths fall between fourteen and twenty-two. Fatty acids are rarely found free in the cell; instead they are chemically linked to a hydrophobic group like glycerol. Glycerol
3
acts as the backbone of the lipid molecule. Although biological membranes contain a diverse variety of lipids, we can divide them into three general types as phospholipids, glycolipids and sterols. Based on the shape of each membrane lipid and the coexistence of different lipids phases within the membrane [13], these lipids can be specifically categorized as
• Glycerophopsholipids (GPLs),
• Sphingolipids
• Cholesterol.
1.2.1 Glycerophopsholipids (GPLs)
Glycero-phospholipids (GPLs) are derivatives from sn-glycero-3-phosphoric acid with usually two fatty acids esterified in the sn-1 and -2 positions of the glycerol moiety.
GPLs are the major lipid type in the eukaryotic cells and they constitute the fundamental matrix of natural membranes. GPLs differ from each other with respect to their polar head groups. The main polar head groups are phosphatidylcholine (PC), phosphatidylethanolamine (PE), phosphatidylserine (PS), phosphatidylinositol (PI) and phosphotidylglycerol (PG).
While PC and PE are neutral (zwitter-ionic), PS, PG and PI lipids can be electrically charged. This difference has an important consequence for the capacity of the lipids, when incorporated into a lipid membrane, to bind protein and drugs [14]. Fatty acid at sn-1 has a saturated chain with 16 or 18 carbon atoms. At sn-2, the fatty acid is generally longer (at least 18 carbon atoms) and is always unsaturated with one or more cis double bonds. Each double bond introduces a bend in the fatty acid chain.
1.2.2 Sphingolipids
Nature also uses another strategy to construct lipids with head and tail groups. Instead of using glycerol to bind the fatty acids, sphingosine, which is a long chain (up to 24 carbon atoms) amine, is bound to the fatty acid. The simplest version of sphingolipid is ceramide, a PC head group attached to ceramide leading to sphingomyelin. The saturated chains of sphingolipids allow them to pack tightly with GPLs through van der Walls interactions. In addition, sphingolipids may self-associate through hydrogen
4
bonds between the hydroxyl (OH) groups of the sphingosine base and the α-OH group present in the fatty acid of many sphingolipids, forming a gel-like phase at the physiological temperature. Overall, sphingolipids have a much higher melting temperature (Tm) than that of GPLs.
1.2.3 Cholesterol
Cholesterol is an important constituent of most mammalian cell membranes and its concentration in various cellular membranes is tightly regulated. Cholesterol is quite different from the GPLs and sphingolipids. In stead of a fatty acid chain as its hydrophobic part, cholesterol has a steroid ring structure with a small hydrocarbon chain at the end and a simple hydroxyl group as its polar head group. So cholesterol has a bulky and stiff tail and a small head as shown in Fig. 1.3.
Eukaryotic plasma membranes contain relatively large amounts of cholesterol ranging between 20-50 % of the total lipids. In contrast, the organelle membranes contain very little: mitochondrial membranes less than 5 %, Golgi membranes about 8 % and ER membranes around 10%. In contrast, sterols are universally absent in the membranes of all prokaryotes [14]. Being an amphiphilic molecule, cholesterol easily incorporates into lipid bilayers. Considering the different type of ordering of the lipid molecules, cholesterol on the one side, due to its hydrophobically smooth and stiff steroid ring structure, has a preference for having conformationally ordered lipid chains next to it because such an arrangement helps for the tightest interactions. From this perspective, cholesterol prefers the solid-order lipid phase. On the other side, the solid-ordered phase is a crystalline phase with dense packing order among the lipid molecules. The cholesterol molecule, with its own peculiar size and shape does not fit well into this packing order, whereas there is plenty of free space into the liquid-disordered phase.
From this perspective, cholesterol prefers the liquid-disordered phase. Hence, the cholesterol molecule becomes frustrated when presented with two different lipid phases. In 1987 the Danish biophysicist John Hjort Ipsen proposed as cholesterol releases the frustration by introducing a new phase called liquid-ordered phase [15].
This liquid-ordered phase is a genuine liquid with a positional disorder and high lateral mobility of the membrane molecules. The lipid’s chains have a substantial degree of
5
conformational order. Cholesterol makes the membrane thicker and stiffer but retains the fluidity required for membrane function.
Glycerophospholipids Sphingolipids Cholesterol
Membrane lipids
Figure 1.3: Structure-based classification of membrane lipids.
1.3 Lateral Membrane Phases and Phase Transitions
When lipids are mix with water, the hydrophobic effect acts to ensure that the acyl chains of lipid molecules are screened and protected from water. This leads to a whole family of supramolecular aggregates that are formed spontaneously by self assembling the lipids head to head. The simplest and most ideal lipid aggregate is the lipid monolayer where a film of lipids formed on the interface between water and air. The lipid bilayer is considered as two monolayers assembled back to back. The open ends of the bilayers close themselves and form closed structures called vesicles or liposomes. Several lipid bilayers often organize among themselves to form multi-
6
lamellar structures. A uni-lamellar liposome constitutes the simplest possible model of a cell membrane.
The lipid aggregates are all characterized by being of planar or lamellar symmetry.
This requires that the lipid molecules have a shape that is approximately cylindrical in order to fit in. If the shape is more conical, other non lamellar aggregates symmetries like cubic, hexagonal, inverted hexagonal, micelles and inverted micelles may arise.
Non polar lipids like triglyceride oil do not form aggregates in water whereas all polar lipids except cholesterol form aggregates in water.
The effective shape of a lipid molecule is determined by the compatibility between the size of the head group and the size of the hydrophobic tail. Full compatibility results in a cylindrical shape. The effective shape of a lipid molecule as a measure of its ability to fit into a particular lipid aggregate is described by a packing parameter P = (v / a l), where v, a, and l denotes volume, area of the head group and length of the lipid acyl chain, respectively [14]. Deviation of P from unity suggests that non-lamellar aggregate having different curvatures.
Pure phospholipid bilayers can exist in two states, a solid or gel state, and above their melting temperature (Tm), a fluid or liquid state. At low temperatures, the acyl chains of the lipid bilayers are in an ordered chain conformation typical of a gel phase (Pβ′).
The solid phase is not thought to be of physiological relevance [9]. Above the melting temperature (Tm) the conformational order is lost and the lipids form a liquid- crystalline phase (Lα). The presence of cholesterol in a system can change the phase behaviour drastically. The gel phase is denoted by so, the indices “s” standing for solid in two dimensions and “o” for orientationally ordered chains, the liquid-crystalline phase ld by the indices “l” for two-dimensional liquid and “d” for disordered chains and, finally, the new liquid-ordered phase (in the presence of cholesterol) is denoted by lo. An important property of the lo phase is the enormous increase in mechanical strength over the ld phase [16], which must be partly due to the increased importance of the van der Waals interaction for the ordered chains in the lipid molecule. This phenomenon, in combination with the increased bilayer thickness, reduces the membrane permeability greatly [17]. It is supposed that the lo phase is a “biologically relevant” phase [15].
7
Each and every lipid molecule has a specific transition temperature Tm. For example DMPC has a Tm value around 24ºC. When more than one type of lipid molecules are present in a bilayer, thus leads to a complex phase behavior. There will not be a single transition temperature and the transition will take place over a range of temperature where the system separates into more than one phase.
Lipid phase transition
Multi-lamellar vesicle (MLV) Uni-lamellar vesicle Figure 1.4: Structures and organization of lipid bilayers.
1.4 Lateral Pressure Profile
The lateral pressure profile is a fundamental physical property of lipid bilayers. Fig.
1.5 shows different forces acting to stabilize the bilayer and at equilibrium all these forces sum up to zero. The lateral pressure profile is built up from three contributions, namely 1. a positive pressure created by the repulsion of the head groups, 2. a negative pressure that acts in the interface of the hydrophobic and hydrophilic part (interfacial tension) of the lipid molecules by the hydrophobic effect, and 3. a positive pressure generated from the entropic repulsion between the fatty acid chains (chain pressure).
Since the bilayer thickness is so small as about 5 nm, the large interfacial tension has to be distributed over a short range. This implies that the counteracting pressure from
temperature (Tm) Pressure
Cholesterol +
Liquid-disordered ( ld ) Gel phase
) Liquid-ordered ( lo )
8
the fatty acid chains, i.e., the chain pressure, should be high, typically around several hundreds of atmospheres. These high pressure densities have an influence on the molecular conformation of the proteins embedded in the membrane and provide a possible non-specific coupling between the lipid membrane and the function of the proteins [14].
Interfacial tension (π < 0)
Head group repulsion (π > 0 )
0
π (z)
Chain repulsion (entropic) (π > 0) Interfacialtension (π < 0)
Head group repulsion (π > 0)
z
Figure 1.5: Lateral pressure profile and stress profile of lipid bilayer [18]
1.5 Lipid Protein Interactions
Proteins are involved in every step of biological activity. There are different ways in which proteins can interact with membranes namely, a) by spanning the whole membrane called membrane proteins or trans-membrane proteins, b) by electrostatic binding, c) by nonspecific binding through weak physical forces, d) by anchoring to the membrane via a lipid extended conformation, e) by anchoring by lipid attached to the protein, and f) by the amphilic protein partially penetrating the bilayer [14].
9
Figure 1.6: Possible interactions of proteins with lipid membrane [18]
There are three constrains that an integral membrane protein has to conform when embedded in a bilayer. Those are 1) Hydrophobic matching – the hydrophobic membrane spanning domain of the protein has to adapt or fix to the hydrophobic thickness of the lipid bilayer [18]. 2) Lateral pressure tolerance – implies that the later pressure exerted by the lipids on the trans-membrane segment of the protein varies through the belayed. 3) Curvature stress releasing – built in curvature stress in the membrane caused by certain non-lamellar forming lipids that have a tendency to form a curved structure which exert a strain on the protein. This strain may be locally released by a conformational change in the protein structure.
The effects of lipids on the function of proteins can be at the microscopic or macroscopic level. The microscopic level includes the hydrogen bonding between lipids and protein, charge-charge interactions and van der Waals interactions. The macroscopic level includes membrane viscosity, membrane pressure, and curvature stress. The distribution of proteins in a bilayer membrane will change as per the molecular structure and composition of the lipids and hence promote lipid mediated protein-protein interactions. Biologically important interactions will be microscopic rather than macroscopic because intrinsic or trans-membrane proteins are designed or adopted such that they are not affected by macroscopic interactions that could occur physiologically [19].
The lipid bilayer is also affected by the encounter of proteins. These include changes in the membrane thickness, changes in the conformational order of the lipid acyl chains, possibly lipid sorting to accommodate different peptides and proteins based on
10
the composition of the lipid and protein population, protein mediated lipid-lipid interactions, and a change in the lateral organisation and distribution of lipids i.e., lipid domain formation which creates the lipid bilayer heterogeneity [20].
Figure 1.7: Hydrophobic matching, where dp denotes the hydrophobic thickness of the trans-membrane domain of the protein and dL denotes the hydrophobic thickness of the lipid bilayer [18].
Lipids around the protein conform to the hydrophobic matching condition either by stretching their acyl chains by increasing the conformation order or by recruiting the best matched lipid species at the interface. Hydrophobic matching may induce lipid mediated protein-protein interactions.
1.6 Lipid-Peptide and Lipid-Protein Interactions in Artificial Cells
Peptide or protein reconstituted in an artificial cell made up of model membrane lipids is an ideal environment to study the individual lipid–peptide and lipid–protein interactions. A reasonable model system for studying biophysical properties of lipid lateral organisation are lipid vesicles composed of three-component lipid mixtures, such as DOPC:DPPC:Chol and POPC:SM:Chol, which exhibit a rich phase diagram, including liquid-ordered/liquid-disordered phase coexistence regions [21], which are thought to be of utmost physiological relevance. Comparing the phase behaviour of ternary system with single or two component lipid mixtures will give us the detailed information about the interactions of an individual lipid with peptide or protein of our concern.11
Temperature and hydrostatic pressure are well-known parameters, often used for studying biomolecular systems. Mostly, temperature has been used to study the thermodynamic, structural, and dynamic properties of membranes. A change in temperature of a system leads to changes of the thermal energy and density at the same time, whereas pressure-dependent studies at constant temperature introduce only changes in density and the intermolecular separations of the system, thus providing additional information about the energetics and phase behavior of the system without disturbing thermally activated processes [22-28]. Hydrostatic pressure has not only been used as a physical parameter for studying the stability and energetics of biomolecular systems, but also because high pressure is an important feature of certain natural membrane environments, and because the high pressure phase behavior of biomolecules is of biotechnological interest [24, 28, 29].
In particular the study of membrane-bound proteins using high pressure has the potential to provide novel information regarding molecular interactions that cause a protein to insert into membranes or bind to the membrane surface, and their associations with other proteins on the membrane surface. Compared to other biomolecules, lipid bilayers have been shown to respond most sensitively to hydrostatic pressure [24, 29]. Considerable knowledge exists about pressure effects on simple, one-component lipid bilayer systems, however, very little is known about complex lipid mixtures and lipid bilayer-peptide and -protein interactions under pressure[24, 28, 30-35]. Generally, pressure affects chemical equilibria and reaction rates. For example, the activation volume, ∆V≠, of a reaction is given by the pressure dependence of the rate of reaction, k. Therefore, ∆V≠= -RT(∂ ln k/∂p)T. High hydrostatic pressure has also been exploited in diverse areas of biotechnology, including the ability to modify the catalytic specificity of enzymes [24]. Reasons for high hydrostatic pressure-induced changes in the rate of enzyme-catalyzed reactions may be classified into three main groups: (i) changes in the structure of the enzyme, (ii) changes in the reaction mechanism or changes in the overall rate by affecting a particular rate-determining step, and (iii) the effect of pressure on the function of membrane proteins, which might also be due to an increase in lipid packing density or a change in phase state, which might lead to a change in the conformation and dynamics of the embedded protein [36].
12
1.7 Model Peptide – Gramicidin D
The linear polypeptide antibiotic gramicidin D is capable of transporting ions through biological membranes by forming ionophores [37, 38]. Naturally occurring gramicidin D contains approximately 80-85% of gramicidin A, 6-7% of gramicidin B, and 5-14%
of gramicidin C. Gramicidin A is a linear polypeptide with the sequence formyl-L-Val- Gly-L-Ala-D-Leu-L-Ala-D-Val-L-Val-D-Val-(L-Trp-D-Leu)3-L-Trp-ethanolamide [37- 39]. Either phenylalanine or tyrosine is replacing tryptophan at position 11 in case of gramicidin B and gramicidin C, respectively. The primary sequence of gramicidin consists of 15 amino acid residues of alternative L and D chirality, and all side-chains are non polar. As a consequence, the peptide is able to adopt conformations of β- helices, which would be unacceptable for an all L-amino acid peptide. The helices can be right or left handed and they can differ in the number of amino acid residues per turn and hence in length and diameter [37, 38]. A common form is the head-to-head dimer of two right-handed single-stranded β-helices. The conformation with 6.3 residues per turn (β6.3-helix) is one of the possible active ion channel structures; it has a hydrophobic length of ~24 Å (channel diameter 4 Å) (Fig. 1.8b). A further form is the left-handed antiparallel double-stranded β5.6-helix, being approximately 31 Å long (Fig. 1.8b), which has been observed in particular organic solvents and long-chain or gel phase lipid bilayer systems [30, 37, 38].
a)
13
b)
Figure 1.8a) Chemical structure and location of the fluorescence probe Laurdan in lipid bilayers made up of POPC:SM:Chol and DOPC:DPPC:Chol ternary systems.
b) Schematic representation showing the polypeptide backbone of a helical dimer (left) and double-helical (right) form of gramicidin.
14
1.8 Multi-Drug Resistance
Microorganisms have developed different mechanisms to prevent the toxic effects of many antibiotics and other drugs [40, 41]. One of the general mechanisms of resistance is the inhibition of drug entry into the cell. Some transporters are dedicated to extrude only specific drug or a class of compounds such as the tetracycline efflux proteins [42, 43]. In contrast to these selective transporters, so called multi-drug resistance transporters can efflux a wide variety of structurally unrelated compounds [44-47].
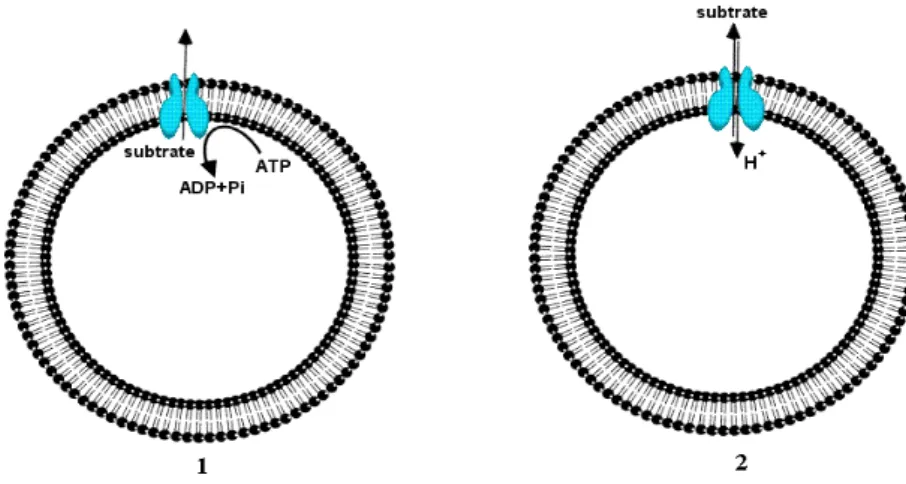
On the basis of bioenergetic and structural criteria, multidrug transporters can be divided into two major classes [48]. Those are 1) secondary multidrug transporters that utilize the transmembrane electrochemical gradient of protons or sodium ions to drive the extrusion of drugs from the cell, and 2) ATP-binding cassette (ABC)-type multidrug transporters that use the free energy of ATP hydrolysis to pump drugs out of the cell (Fig. 1.9).
Figure 1.9: Two major classes of multidrug transporters; 1) ABC type and 2) secondary multidrug transporters.
1.8.1 LABs and Multidrug Resistance
Lactic acid bacteria (LABs) belong to a group of gram-positive anaerobic bacteria that excrete lactic acid as their main fermentation product into the culture medium. LABs play crucial roles in the manufacturing of fermented milk products, vegetables and meat, as well as in wine and beer. LABs can be beer spoilage bacteria. They produce
15
turbidity, acidity and unfavorable taste in beers. In LABs hop resistance is of importance for them to grow in beer. Hop compounds, e.g. hops iso-α-acids in beer, have an anti bacterial activity against gram-positive bacteria. Hops act as ionophores which dissipate the pH gradient across the cytoplasmic membrane and reduce the proton motive force (pmf). Therefore the pmf depended nutrient uptake is inhibited, resulting in cell death [49].
In the LAB Lactococcus lactis, two multidrug-resistance transporters were mainly found to confer resistance to cationic lipophilic cytotoxic compounds [43]. The two best investigated are LmrP as a representative of the secondary MDR transporters [50], and LmrA as a representative of the ABC transporter family [51], which can also be found in Lactobacillus plantarum and in the strain TMW 1.460.
In another LAB Lactobacillus brevis, a homolog of LmrA was found that confers resistance to hop [52]. This LmrA homolog is encoded by the gene called horA. LmrA and HorA contribute to the intrinsic drug resistance of the organisms in which they are expressed.
1.9 Model Protein – LmrA
LmrA causes antibiotic resistance by expelling amphiphilic compounds from the inner leaflet of the cytoplasmic membrane [53, 54]. Unlike other bacterial multidrug- resistance proteins, LmrA is the first ABC-transporter found in bacteria to confer multidrug resistance [55]. It is a 590 amino acid protein with an N-terminal hydrophobic domain, consisting of six transmembrane helices, followed by C-terminal hydrophilic domain, containing the ATP-nucleotide binding site. The membrane topology of LmrA is shown in Fig. 1.10. Although it’s topology in the lipid membrane had been predicted from its primary structure, a well defined tertiary structure is not known. LmrA has the broadest substrate specificity reported for MDRs. The human multidrug-resistance P-glycoprotein, encoded by the MDR1 gene, is also an ABC transporter.
The most commonly accepted topology model suggests these MDR proteins are constituted of two homologous halves composed of an ATP-binding domain and a membrane-embedded domain [56]. LmrA has about 50% similarity with each half of a
16
plasma membrane glycoprotein (P-glycoprotein or P-gp) and functions as a homologous dimmer [53]. Hence functional crosstalk between two LmrA monomers in the lipid matrix is essential for its activity [57]. LmrA exhibits specificity for phospholipid head groups and may be involved in the lipid sorting in L. lactis [51].
Bacterial LmrA and human P-glycoprotein are functionally interchangeable and this type of MDR nature is conserved from bacteria to man [53].
The mechanism of extrusion of cytotoxic compounds by LmrA has been studied in whole cells, isolated membrane vesicles and proteoliposomes. These studies revealed that the lipophilic substrates intercalate rapidly in the outer leaflet of the membrane.
Subsequently, the substrate flips over slowly to the inner leaflet from where it is picked up by LmrA and extruded in an ATP-dependent process to the external medium [54].
Figure 1.10: Proposed membrane topology of LmrA [48].
17
1.10 Aim of this Research
Cell membranes constitute one of the fundamental structural and functional elements of living organisms. There is considerable evidence that lateral inhomogeneities in lipid composition in the both inner and outer layer exist in biological membranes.
Lipids and proteins are often organized into microdomains, lipid rafts. These rafts are composed of mainly cholesterol and saturated lipids, which form a lo phase. These lipid rafts may play an important role in many important biological processes. Almost fifty percent of the proteins in our cells are attached to lipid membranes, some of them are transmembrane proteins, bound to the membrane head groups or interacting to the membrane for some time during their function. Membrane proteins and lipidated peptides or proteins would either reside in or be excluded from these rafts, depending on their physical-chemical properties. Hence, it is important to study their properties, such as the lateral organisation and structure of lipid rafts and their influence on the conformation and activity of membrane proteins. The lateral organisation controls the mechanical properties (which is important for the shape of cells) of the membrane. In order to understand how proteins function in membranes it is necessary to determine the ways in which proteins interact with the lipid bilayer, specifically how the proteins influence the local structure and composition of the bilayer, and on the other hand, how changes in the lipid-bilayer physical properties modulate the functional state of the proteins.
The primary goals of this work are to study the lateral membrane organization and lipid-peptide and lipid-protein interactions using different lipid mixtures. In the first part of this thesis, the lateral membrane organization of a typical lipid raft mixture, such as POPC/sphingomyelin/cholesterol, and its phase segregation originating from compositional fluctuations as a function of concentration, temperature (from ~2 up to 70 °C) and pressure (from 1 up to 2000 bar) are studied by Laurdan fluorescence spectroscopy. Lipid-peptide interactions are studied using Gramicidin D as a model peptide along with this lipid mixture.
In the second part of this thesis, lipid-protein interactions are studied using LmrA as a model protein. Laurdan fluorescence spectroscopy was used to follow the lateral organisation of the membrane made of different model membrane lipids such as
18
- single component lipid systems containing DMPC, DOPC
- two-component system containing DMPC with 10 mol% cholesterol - ternary lipid raft systems containing DOPC/DPPC/Chol mixtures - natural membrane lipids extracted from Lactobacillus plantarum.
Except the DOPC bilayer and the natural membrane system all other lipid systems were also examined by atomic force microscopy (AFM).
In the third part of the thesis, changes in the secondary structure of non-reconstituted LmrA was analysed as a function of temperature from 30 to 70 °C by using circular dichroism (CD) spectroscopy.
The fourth part of this thesis deals with a consensus description of the lateral inhomogeneity of DOPC/DPPC/Chol mixtures, studied by various biophysical methods in addition to Laurdan fluorescence spectroscopy, such as 2-photon excitation fluorescence microscopy using giant unilamellar vesicles (GUV) and atomic force microscopy (AFM). The GUV studies allow direct microscopic visualization of domains and their topology in the micrometer range. AFM allows checking the lateral inhomogeneity and domain topology in nanometer range. Furthermore fluorescence anisotropy measurements were performed for both raft mixtures using the TMA-DPH fluorescent probe.
The final part of the thesis deals with the transport activity and ATPase activity of LmrA reconstituted in pure DMPC and DOPC/DPPC/Chol systems under different pressures.
19
2. Materials and Methods
2.1 Materials
POPC 1-palmitoyl-2-oleoyl-sn-glycero-3-phosphocholine Avanti Polar Lipids DOPC 1,2-dioleoyl-sn-glycero-3-phosphocholine Avanti Polar Lipids DPPC 1,2-dipalmitoyl-sn-glycero-3-phosphocholine Avanti Polar Lipids SM sphingomyelin, brain porcine Avanti Polar Lipids
Chol cholesterol Sigma-Aldrich
GD gramicidin D Sigma-Aldrich
Rhodamine DHPE Lissamine™ rhodamine B 1,2- Molecular Probes dihexadecanoyl-sn-glycero-3-
phosphoethanolamine, triethylammonium salt
C5-ganglioside GM1 BODIPY® FL C5-ganglioside GM1 Molecular Probes Laurdan 1-dodecanone, 1-(6-(dimethylamino) Molecular Probes
-2-naphthalenyl)
TMA-DPH 1-(4-trimethylammoniumphenyl)-6-phenyl Molecular Probes -1,3,5-hexatriene p-toluenesulfonate
Hoechst Hoechst 33342, trihydrochloride, trihydrate Molecular Probes 10 mg/mL solution in water
DDM Dodecyl maltoside GERBU Biochemicals GmbH
Biobeads DM-2 adsorbent Bio-Rad
HEPES HEPES buffer Sigma
All chemicals were used without further purification.
All other materials were reagent grade and obtained from commercial sources.
LmrA protein was expressed and purified by Holger Teichert (Prof. Dr. Rudi F. Vogel group) from the Technische Universität München, Germany.
20
2.2 Fluorescence Spectroscopy
Luminescence is the emission of light from any substance and occurs from electronically excited states. Depending on the nature of the excited state, it is divided into fluorescence and phosphorescence. Fluorescence is the emission of light from an excited singlet state and the electron in the excited orbital is paired (of opposite spin) to the second electron in the ground-state orbital. The emission rates of fluorescence are typically 108 s-1, hence the typical fluorescence lifetime is nearly 10 ns. The life time (τ) of a fluorophore is the average time between its excitation and its return to the ground state. Phosphorescence is emission of light from triplet excited states, in which the electron in the excited orbital has the same spin orientation as the ground-state electron. The emission rates are slow, 103 – 100 s-1, so that phosphorescence lifetimes are typically milliseconds to seconds. Fluorescence spectroscopy is a powerful technique for studying molecular interactions. The technique has become quite popular because of its exquisitely sensitivity to the immediate environment of the probe and high signal to noise ratio [58].
2.2.1 Basic Theory of Fluorescence
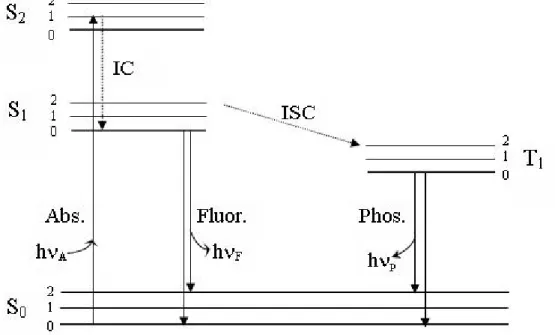
The processes which occur between the absorption and emission are usually illustrated by the Jablonski diagram. In Fig. 2.1, the singlet ground, first, and second electronic states are depicted by So, S1 and S2, respectively. At each of these electronic energy levels, the fluorophores can exist in a number of vibrational energy levels, denoted by 0, 1, 2, etc. The transitions between states are depicted as vertical lines. Transitions occur in about 10-15 s, a time too short for significant displacement of nuclei. This is known as Franck- Condon principle. Following light absorption, several processes usually occur. A fluorophore is usually excited to some higher vibrational level of either S1, or S2. With a few rare exceptions, molecules in condensed phases rapidly relax to the lowest vibrational level of S1. This process is called internal conversion (IC) and generally occurs in 10- 12 s or less. Since fluorescence lifetimes are typically near 10- 8 s, IC is generally complete prior to emission. Hence, fluorescence emission generally results from a thermally equilibrated excited state, that is, the lowest-energy vibrational state of S1, return to the ground state typically occurs to a higher excited vibrational ground-state level, which then quickly (10-12 s) reaches thermal
21
equilibrium. An interesting consequence of emission to higher vibrational ground states is that the emission spectrum is typically a mirror image of the absorption spectrum of the S0 Æ S1 transition. Molecules in the S1 state can also undergo a spin conversion to the first triplet state, T1. Emission from T1 is termed phosphorescence.
Conversion of S1 to T1is called intersystem crossing (ISC). The transition from T1 to the singlet ground state is forbidden.
Figure 2.1: Jablonski diagram.
2.3 Fluorescence Anisotropy
Anisotropy measurements provide information on the size and shape of proteins or the rigidity of various molecular environments. Anisotropy measurements have been used to measure protein-protein associations and the fluidity of membranes and immunoassays of numerous substances.
Anisotropy measurements are based on the principle of photoselective excitation of fluorophores by polarized light. Fluorophores preferentially absorb photons whose electric field vectors are aligned parallel to the transition moment of the fluorophore.
The transition moment has a defined orientation with respect to the molecular axes. In an isotropic solution, the fluorophores are oriented randomly. Upon excitation with polarized light, one selectively excites those fluorophore molecules whose absorption
22
transition dipole is parallel to the electric vector of the excitation. This selective excitation results in a partially oriented population of fluorophores (photoselection) and in partially polarized fluorescence emission.
The fluorescence anisotropy (r) and polarization (P) are defined by
r = I
||- I
⊥I
||+ 2I
⊥p = I
||- I
⊥I
||+ I
⊥where I|| and I⊥ are the fluorescence intensities of the vertically (||) and horizontally (⊥) polarized emission. Several phenomena can decrease the measured anisotropy to values lower than the maximum theoretical values. The most common cause is rotational diffusion. Such diffusion occurs during the lifetime of the excited state and displaces the emission dipole of the fluorophore. Measurement of this parameter provides information about the relative angular displacement of the fluorophore between the times of absorption and emission. In fluid solution, most fluorophores rotate extensively in 50-100 ps. Hence, the molecules can rotate many times during the fluorescence lifetime (1-10 ns) and the orientation of the polarized emission is randomized. For this reason, fluorophores in aqueous non-viscous solution typically display anisotropies near zero. Transfer of excitation between fluorophores also results in decreased anisotropies. The effects of rotational diffusion can be decreased if the fluorophore is bound to a macromolecule. As a result, measurements of fluorescence anisotropy will be sensitive to any factor which affects the rate of rotational diffusion.
The rotational rates of fluorophores in cell membranes also occur on the nanosecond timescale, and the anisotropy values are thus sensitive to the membrane composition.
For these reasons, measurements of fluorescence polarization are widely used to study interactions of biological macromolecules.
23
2.3.1 Experimental Part - Sample Preparation for Anisotropy Measurements
Lipid and cholesterol stock solutions were prepared in chloroform. TMA-DPH was dissolved in ethanol at a concentration of 1 mmol/L. Vesicles containing the desired molar ratio of POPC, SM and Chol and DOPC, DPPC and Chol were prepared together with the TMA-DPH fluorophore. After co-dissolving the lipids, cholesterol and fluorophore, the solvents chloroform and ethanol were removed by a flow of nitrogen gas. Then the samples were dried under high vacuum pumping for several hours to completely remove the remaining solvent. The remaining dry film was then resuspended in buffer, vortexed and sonicated for 15 min in a bath-type sonicator (Bandelin SONOREX RK100SH). Large unilamellar vesicles were produced by five freeze-thaw cycles (freezing in liquid nitrogen and slow-thawing in a warm water bath).
The final concentration of lipid vesicles in the sample used for the fluorescence measurements was 0.3 mmol/L (0.2 mg/mL) and that of the fluorescent probe was
~0.6 µmol/L. The final vesicle solution contained a 1:500 fluorophore to lipid ratio on a molecular basis.
Measurements of the temperature dependence of the steady-state fluorescence anisotropy rss were carried out in a K2 multifrequency phase and modulation fluorometer with photon counting mode equipment (ISS Inc., Champaign, Ill), aligned to the “L”-format light path and equipped with polarizers. The excitation and emission wavelength were 338 nm and 446 nm respectively.
2.4 Laurdan Fluorescence Spectroscopy
The emission spectrum of the environmentally sensitive fluorescence probe Laurdan (6-dodecanoyl-2-dimethyl-aminonapthalene) was used to decipher the phase behavior of the lipid bilayer system. Laurdan is a naphthalene-based, membrane probe that displays spectral sensitivity to the polarity of the environment. It possesses both an electron donor and acceptor, so that fluorescent excitation induces a large excited state electrical dipole moment, which tends to locally align surrounding polar molecules (e.g., water) by dissipating a small fraction of the excited state energy and shifting the emission spectrum towards the red [59, 60] in aqueous environment. When inserted into a membrane, Laurdan aligns its lauroyl tail with the lipid moiety and locates its
24
naphthalene ring near the phospholipid glycerol backbone (Fig. 1.8a). It is virtually non-fluorescent in aqueous environments with a fluorescence lifetime of less than 100 ps, while in organic solvents and in membranes, it displays a strong fluorescence signal with an average lifetime of about 4-8 ns, depending on the solvent. Laurdan distributes equally into fluid and gel phase lipid membranes and does not have a specific affinity towards any phospholipid head group [61]. The spectral changes of the emission spectrum of Laurdan is generally quantified by the so-called generalized polarization function, which is defined as GP = (IB-IR)/(IB+IR), where IB and IR are the fluorescence intensities at 440 nm (characteristic for a gel phase state environment) and 490 nm (characteristic for a fluid, liquid-crystalline lipid state), respectively.
Hence, GP values range from -1 to +1. In phase coexistence regions, the GP values exhibit values typical for fluid (liquid-disordered) and gel-type (liquid-ordered) domains. Hence the measured GP values of our systems reflect the overall phase behavior and fluidity of the membranes as a function of lipid concentration, temperature and pressure.
2.4.1 Experimental Part – Sample Preparation for Lipid-Peptide Interactions
Lipid and cholesterol stock solutions were prepared in chloroform. Laurdan was dissolved in chloroform at a concentration of 1 mmol/L. Vesicles containing the desired molar ratio of POPC, SM and Chol were prepared together with the Laurdan fluorophore. After co-dissolving the lipids, cholesterol, fluorophore and GD (5 mol%
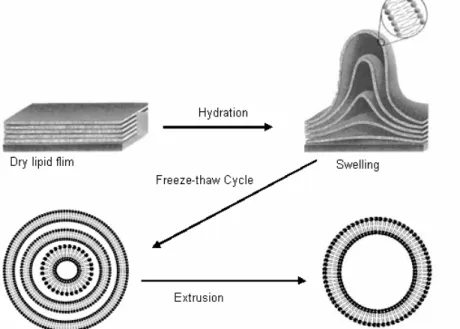
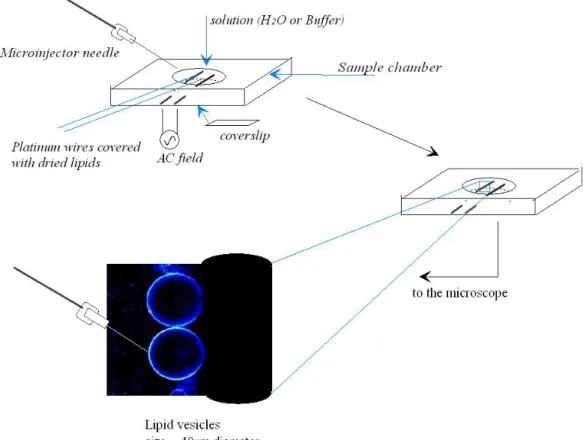
with respect to lipid for the peptide containing sample), the solvent chloroform was removed by a flow of nitrogen gas. Then the samples were dried under high vacuum pumping for several hours to completely remove the remaining solvent. The remaining dry film was then resuspended in water, vortexed and sonicated for 15 min in a bath- type sonicator (Bandelin SONOREX RK100SH). Large unilamellar vesicles were produced by five freeze-thaw cycles (freezing in liquid nitrogen and slow-thawing at warm water bath) followed by 13 passages through two stacked nucleopore polycarbonate membranes of 100 nm pore size in a mini-extruder. The samples were kept at high temperature (>Tm) during the extrusion procedure. Fig 2.2 illustrates the liposome preparation. The final concentration of lipid vesicles in the samples used for the fluorescence measurements was 0.3 mmol/L and that of the fluorescent probe was
25
~0.5 µmol/L. The final vesicle solution contained a 1:550 fluorophore to lipid mixture on a molecular basis.
Figure 2.2: Liposome preparation.
2.4.2 Experimental Part – Sample Preparation for Lipid-Protein Interactions
Proteoliposome of LmrA with DMPC, DOPC, DMPC+10 mol% cholesterol, natural lipid extract and the raft mixture DOPC:DPPC:Chol-(1:2:1) along with Laurdan were prepared by the successive detergent removal method [62]. Liposomes of the desired single- or multi-component lipid mixture was prepared by sonication-freeze thaw cycles. The required amount (1.5 mM) of detergent dodecyl maltoside (DDM) to destabilize different liposomes was determined by light scattering measurements.
Liposomes were destabilized by the slow addition of 1.5 mM detergent DDM and kept stirring at room temperature for 15 min. For reconstitution, the purified LmrA was mixed with DDM-destabilized liposomes in a 1:20 wt ratio and incubated for 30 min at room temperature under gentle stirring. The detergent was removed by two successive extractions with SM2 biobeads. These polystyrene beads are thoroughly washed with methanol and water for 3 times before use. A wet weight of 80 mg biobeads/mL of liposomes was used to extract the detergent each time. First extraction was performed at room temperature for 2 hrs and the second extraction at 4 ºC for 16
26
hr. Finally, proteoliposomes were collected by centrifugation (280000 g, 30 min, 20 ºC) and resuspended in 20 mM HEPES buffer, pH 7.2 at a final lipid concentration of 1 mg/mL and the protein to lipid ratio is 1:20 wt/wt. For the AFM studies and the measurement of the ATPase activity of LmrA reconstituted in pure DMPC and DOPC/DPPC/Chol systems, the proteoliposome, were prepared without the Laurdan fluorophore. Figure 2.3 illustrates the proteoliposome preparation protocol.
Figure 2.3: Proteoliposome preparation.
2.4.3 Fluorescence Spectrometer Setup
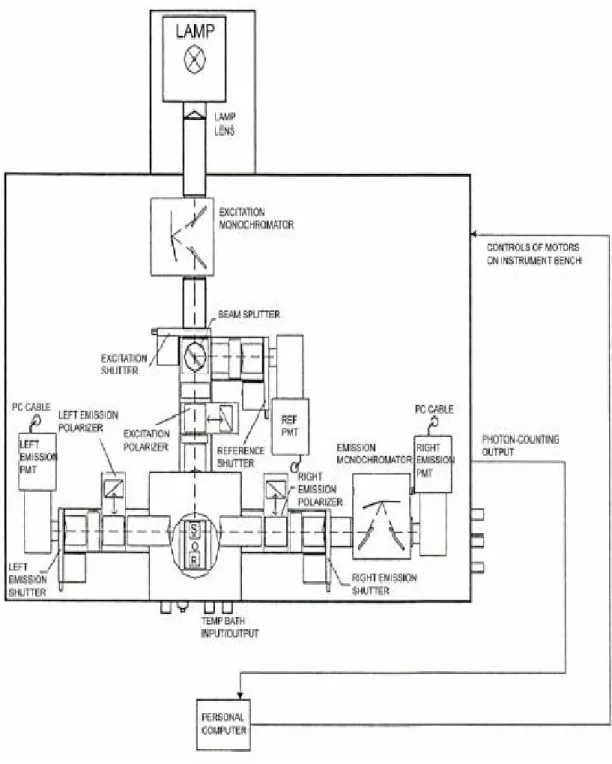
The fluorescence spectroscopic measurements were performed using a K2 multifrequency phase and modulation fluorometer with photon counting mode equipment (ISS Inc., Champaign, Ill). The detailed operational principle of the multifrequency fluorometer has been described in detail elsewhere [63, 64]. A schematic illustration of the K2 fluorescence spectrometer is shown in Fig. 2.4. The instrument has a xenon arc lamp as the source of excitation light. Such lamps are generally useful because of their high intensity in wavelengths range between 250 and 1100 nm. Xenon arc lamps emit a continuum of light as a result of the recombination of electrons with ionized Xe atoms. These ions are generated by collisions of Xe atoms with the electrons which flow across the arc.
The emitted light is focused with the help of lenses on the entrance slit of the excitation monochromator. A monochromator accepts incoming light and disperses it
27
into the various colors of the spectrum. This dispersion can be accomplished using prisms or diffraction gratings. In the K2 spectrometer the spectral dispersion in the monochromator takes place in the concave, holographic gratings with 1200 grooves per millimeter. The spectral region is in the range of λ = 200-800 nm with allowance of ∆λ = 0.25 nm. Both monochromators are equipped with a set of interchangeable slits. The slit handles are marked with the width of the slits: 2, 1, 0.5 mm. Since the linear dispersion of the monochromator is 8 nm/mm, slits have a bandwidth of 16, 8, and 4 nm. The monochromatic light is stirred afterwards over a mirror which is fastened to the corner of a two-way polarizer, directly on a beam splitter. A beam splitter is provided in the excitation light path and reflects part of the excitation light to a reference cell, in this case Rhodamine-B, a stable reference fluorophore. Excitation spectra are distorted primarily by the wavelength dependence of the intensity of the exciting light. This intensity can be converted to a signal proportional to the number of incident photons by the use of a “quantum counter”. This concentrated solution absorbs virtually all incidents light from 200-600 nm. The quantum yield and emission maximum (~630 nm) are essentially independent of excitation wavelength from 220- 600 nm. Rhodamine-B remains the most generally reliable and convenient “quantum counter”.
Polarizer’s are present in the both excitation and emission light paths. Generally polarizers are removable so that they can be inserted only for the measurement of fluorescence anisotropy or when it is necessary to select for particular polarized components of the emission and/or excitation. In the sample space there are two possibilities, the temperature cell might be placed or the high-pressure autoclave. In the right emission channel light emitted by the sample is spectrally divided by the emission monochromator in the optical path. Just like the excitation monochromator, this also contains concave holographic gratings with 1200 grooves per millimeter as a dispersive element. The emission monochromator grating is maximized for fluorescence light detection in the region λ = 350-800 nm. Additionally slits for optical filter are indicated in both detection ways directly behind the polarizer. Optical filters are used to compensate for the less than ideal behavior of monochromators.
28
Figure 2.4: Schematic illustration of the K2 fluorescence spectrometer.
The detection of the emission can be made by the two photomultipliers, on the left and on the right side of the sample area. The emitted fluorescence radiation is bundled first by a lens. The bundled emission radiation arrived then nonpolarized to the detector.
Almost all fluorometers use photomultiplier tubes as detectors. A PMT is best
29
regarded as accurate source, the current being proportional to the light intensity.
Although a PMT responds to individual photons, these individual pulses are generally detected as an average signal.
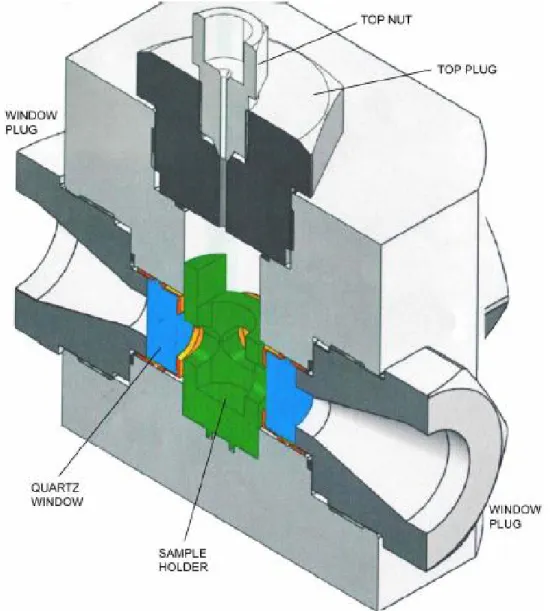
2.4.4 High Pressure Cell
Figure 2.5: Cross section image of the high pressure fluorescence cell.
To accomplish high pressure measurements, sample was pressurized by ethanol in a high pressure cell system made by the ISS company. The high pressure cell construction is presented in Fig. 2.5. It has been specifically designed for high pressure
30
fluorescence studies up to pressures of about 3000 bar. The cell can work up to 4 kbar, if sapphire windows are used. Three 19 mm diameter and 8.5 mm thickness quartz windows have been placed allowing the use of the fluorescence format either with laser or with xenon lamp sources. The cell is made of a stainless steel alloy which has excellent thermal conductivity. The cell also includes a built-in circulation path for temperature control through an external liquid circulation bath. The cell pressure was generated through a manual pump system limited to 4 kbar (HP Technology Frankfurt, Germany). The accuracy of the manual pump system is indicated as 10 bar.
2.5 Circular Dichroism Spectroscopy
Unpolarized light has electric and magnetic field vectors that point in random directions perpendicular to its axis of travel. In case of linearly polarized (also called plane polarized) light, the electric and magnetic field vectors all point in the same direction. There is another kind of polarization of light, called circular polarization. In this case, the light vector propagates as a helix, as shown in Figure 2.6, from both side view and an end view. The helix can be right-handed or left-handed, so we can have right-circularly polarized light and left-circularly polarized light.
CD spectroscopy is used to measure the interaction of polarized light with optically active (i.e., asymmetric) molecules. Asymmetry can result from chiral molecules such as the peptide backbone of proteins, a non-chiral molecule covalently attached to a chiral molecule (aromatic amino acid side chains), or a non-chiral molecule in an asymmetric environment (e.g., a chromophore bound to a protein). Proteins are CD active (all amino acids except glycine contain a chiral carbon), and the resulting CD signals are sensitive to the protein’s secondary and tertiary structure. The secondary structures of proteins interact preferentially with one circular polarization, allowing one to follow the changes in protein structure using circular dichroism spectroscopy
Side view End view Figure 2.6: Circularly polarized light, side view and end view.
31
By definition, CD is a measure of the differential absorbance between the left circularly polarized (lcp-l) and right circularly polarized (rcp-r) light. According to the Beer-Lambert law, we can define the absorbance for lcp as
A = log
10(I
o/ I) = ε
lcl
Where Io and I are, respectively, the intensities of lcp light incident on the sample and after traveling a distance l through a medium containing the molar concentration C of the chiral solute, and εl is the molar extinction coefficient of the solute for lcp light.
Corresponding definitions can be formulated for rcp light, leading to the definition of CD as
∆A = A
l- A
r =ε
lcl - ε
rcl = ∆ ε cl
where ∆
ε
is the molar CD, defined as∆ ε = ε
l- ε
rTherefore it would be logical to use ∆
ε
as CD data. However, for most historical and instrumental reasons, the CD data are often expressed not as ∆ε
but in terms of the molar ellipticity, i.e., θ(λ), which has units of deg cm2dmol–1. When plane polarized light passes through a solution containing an optically active substance, the left and right circularly polarized components of the plane polarized light are absorbed by different amounts. When these components are recombined, they appear as elliptically polarized light. The ellipticity is the angle θ, the tangent of which is the ratio of the minor to the major axis of the ellipse.CD spectra of proteins and peptides are usually measured in two spectral regions. In the far-UV region (approximately 180-250 nm), the measured bands represent the electronic transitions of the amide groups of the protein backbone. The sign, magnitude, and position of these bands are strongly dependent on the φ and ψ angles of the peptide bond. From this region of the spectrum it is possible to obtain
32
information about the secondary structure of the protein. The analysis of the bands in near UV region (approximately 250-350 nm) is influenced by the side chains of aromatic amino acids and by disulfide bonds. The CD-spectra depend on the local environment of the aromatic amino acids and on their orientation with respect to the backbone, thus providing a fingerprint of the tertiary structure of the protein molecule.
2.5.1 Far UV CD Spectra and Protein Secondary Structure
The most stable and abundant elements of regular, periodic secondary structures are α- helices and parallel and antiparallel β-sheets [65]. All proteins can be grouped into five classes according to their secondary structures: 1) All α protein, which show a strong double minimum at 222 and 208-210 nm and a strong maximum at 191-193 nm. 2) All β proteins usually have a single negative minimum between 210 and 225 nm and a single positive maximum between 190 and 200 nm. In contrast a highly distorted β-sheet or β-sheets made up of short irregular β-strands show a strong negative band near 200 nm similar to unordered forms [66]. 3) α+β proteins have α- helices and β-sheets often in separate domains. 4) α/β proteins have intermixed segments that often alternate along with polypeptide chain. For α+β and α/β proteins, the intensities of α-helices usually predominate those of β-sheets. Sometimes a single broad minimum CD band may appear between 210 and 220 nm because of overlapping of various α-helices and β-sheets. For α + β proteins, the 208- to 210-nm band usually has a larger intensity than the 222 nm band, and the reverse is true for the α/β proteins [67]. 5) Unordered or denatured proteins that have little ordered structures show a strong negative band near 200 nm and some week bands between 220 and 230 nm which can have either positive or negative signs.
The estimation of the secondary structure of a protein from its CD spectrum remains an empirical task despite many proposed methods of analysis, simple as well as sophisticated. This is because of the lack of a unique solution for the deconvolution of a CD spectrum. Most of these approaches assume that the secondary structure of the measured protein can be obtained by fitting the experimental spectrum with reference spectra believed to represent pure components of the secondary structures. However, the analyses of CD data based on the use of reference spectra of model polypeptides, when applied to proteins may result in disadvantages, because of the difference in the
33
![Figure 1.5: Lateral pressure profile and stress profile of lipid bilayer [18]](https://thumb-eu.123doks.com/thumbv2/1library_info/3636153.1502462/16.892.138.763.297.651/figure-lateral-pressure-profile-stress-profile-lipid-bilayer.webp)
![Figure 1.6: Possible interactions of proteins with lipid membrane [18]](https://thumb-eu.123doks.com/thumbv2/1library_info/3636153.1502462/17.892.142.692.105.303/figure-possible-interactions-proteins-lipid-membrane.webp)
![Figure 1.7: Hydrophobic matching, where d p denotes the hydrophobic thickness of the trans-membrane domain of the protein and d L denotes the hydrophobic thickness of the lipid bilayer [18]](https://thumb-eu.123doks.com/thumbv2/1library_info/3636153.1502462/18.892.138.791.231.438/figure-hydrophobic-matching-hydrophobic-thickness-membrane-hydrophobic-thickness.webp)