This is a pre-copyedited, author-produced version of an article accepted for publication, following peer review.
Grosse, J.; Brussaard, C.P.D. & Boschker, H.T.S. (2019). Nutrient limitation driven dynamics of amino acids and fatty acids in coastal phytoplankton. Limnology and Oceanography, 64, 302-316
Published version: https://dx.doi.org/10.1002/lno.11040
NIOZ Repository: http://www.vliz.be/nl/imis?module=ref&refid=303624
[Article begins on next page]
The NIOZ Repository gives free access to the digital collection of the work of the Royal Netherlands Institute for Sea Research. This archive is managed according to the principles of the Open Access Movement, and the Open Archive Initiative. Each publication should be cited to its original source - please use the reference as presented.
When using parts of, or whole publications in your own work, permission from the author(s) or copyright holder(s) is always needed.
Nutrient limitation driven dynamics of amino acids and fatty acids in
1
coastal phytoplankton
2
Julia Grosse1*§, Corina P.D. Brussaard2and Henricus T. S. Boschker1$
3 4
1 Royal Netherlands Institute for Sea Research and Utrecht University, PO Box 140, 4400 AC 5
Yerseke, The Netherlands 6
2 Royal Netherlands Institute for Sea Research and Utrecht University, PO Box 59, 1790 AB Den 7
Burg, Texel, The Netherlands 8
§ present address: Department of Biological Oceanography, GEOMAR Helmholtz Centre of Ocean 9
Research Kiel, Kiel, Germany 10
$ present address: Department of Biotechnology, Delft University of Technology, Delft, The 11
Netherlands 12
13
*Corresponding author: jgrosse@geomar.de 14
Keywords: nutrient limitation, fatty acids, amino acids, food quality, phytoplankton 15
16
Running head: Compound synthesis under N and P limitation 17
Abstract 18
Coastal seas like the North Sea have been subject to major changes in nutrient inputs over the 19
last decades, resulting in shifts of limiting nutrients for phytoplankton communities. Here we 20
investigated the seasonal and spatial distribution and synthesis patterns of individual amino acids 21
and distinct fatty acid groups and show how these were affected by different nutrient limitations in 22
natural coastal phytoplankton communities. Nitrogen limited communities exhibited substantially 23
slower synthesis of essential amino acids compared to synthesis of non-essential amino acids. In 24
short-term nutrient addition experiments this trend was reversed immediately after N addition to 25
levels found under not limiting conditions. On the contrary, phosphorus limited communities 26
showed no such shift in amino acids. Both N and P limitation induced a shift from structural to 27
storage fatty acids with a concurrent decrease in the synthesis of poly-unsaturated fatty acids.
28
Reversed effects in fatty acid synthesis after N or P addition were only apparent after 72 h, when 29
they could be found in both fatty acid biosynthesis and concentrations. The different strategies of 30
qualitative and quantitative regulation of different biomolecule synthesis under nutrient scarcity 31
may have far-reaching consequences for the phytoplankton’s nutritional value. Higher trophic 32
levels may have to cope with the loss of essential amino acids and poly-unsaturated fatty acids in 33
nutrient limited phytoplankton, which could induce changes in the structure of food webs.
34 35
Introduction
36
Phytoplankton are main contributors to global primary production (Field et al., 1998), are the 37
foundation of many marine food webs and the source of essential compounds for higher trophic 38
levels (Arts and Kohler, 2009). Long-term perturbations of nutrient deliveries from land, however, 39
led to eutrophication in many coastal seas, impacting phytoplankton community structure and 40
productivity in unfavorable ways (e.g. Smith et al., 1999; Philippart et al., 2000). In order to 41
counteract repercussions of high nutrient loads the neighboring countries of coastal seas started to 42
reduce nutrient loads in river systems. For example, members of the OSPAR Convention 43
(Oslo/Paris Convention for the Protection of the Marine Environment of the North-East Atlantic) 44
agreed to reduce inputs of riverine nitrogen (N) and phosphorus (P) to the North Sea by at least 45
50% compared to the year 1985 (OSPAR, 1988). Overall, nutrient reduction efforts were more 46
effective for P removal compared to N removal (OSPAR, 2010; Troost et al., 2014) and resulted in 47
drastic changes in nutrient availabilities, both of concentrations and relative ratios of dissolved 48
inorganic N and P (DIN:DIP). Growing evidence suggests that P limitation is becoming more and 49
more dominant in river influenced coastal areas such as the North Sea, the Gulf of Mexico or the 50
South China Sea (Sylvan et al., 2007; Xu et al., 2008; Burson et al., 2016), thereby challenging the 51
classical view, which considers N to be limiting in marine systems (Blomqvist et al., 2004;
52
Howarth and Marino, 2006).
53
Changes in nutrient availability translate into changes in C:N:P ratios of phytoplankton biomass 54
(Vrede et al., 2004; Diez et al., 2013), which can also be used as a tool to evaluate the nutritional 55
quality of phytoplankton for higher trophic levels (Sterner and Elser, 2002). Looking closer, 56
changes in C:N:P ratios illustrate shifts in the biomolecule composition. C:N:P requirements of 57
major cellular biomolecules differ (Klausmeier et al., 2004); carbohydrates (CH) only contain C 58
while amino acid (AA) synthesis requires N and RNA/DNA synthesis requires both N and P. Fatty 59
acids (FA), like carbohydrates, only contain C but they are found in complex membrane lipids that 60
often require P and/or N (Van Mooy et al., 2009).
61
Phytoplankton can adapt growth strategies to nutrient scarcity and increase or decrease 62
synthesis of different biomolecule groups. For example, synthesis of carbon rich storage 63
compounds, such as glucose or storage lipids, increases during nutrient limitation and leads to 64
increased C:N and C:P ratios, which concurrently decreases food quality (Plath and Boersma, 65
2001; Borsheim et al., 2005). N:P ratios are affected as well (Geider and LaRoche, 2002; Quigg et 66
al., 2003), however, the specific underlying dynamics in the synthesis of ribosomal RNA, 67
pigments and proteins are difficult to investigate in phytoplankton cells and have so far mainly 68
been demonstrated in computational model runs (Falkowski, 2000; Klausmeier et al., 2004;
69
Arrigo, 2005).
70
However, technological advances, especially in liquid chromatography-isotopic ratio mass 71
spectrometry, make it now possible to obtain specific isotope information of a wide range of 72
compounds and conduct synthesis rate measurements. Grosse et al. (2017) investigated the 73
seasonal and spatial dynamics of concentrations and biosynthesis rates of total amino acids, 74
storage fatty acids and carbohydrates as well as structural fatty acids and carbohydrates in North 75
Sea phytoplankton communities. Results showed that nutrient limitation and season had large 76
effects on the quantity of all biochemical classes, affecting both concentration and biosynthesis 77
rates, e.g., AA concentration varied fourfold in concentration and up to eightfold in biosynthesis 78
rates. The addition of the growth-limiting nutrient revealed an overall response in which storage 79
compound synthesis decreased and AA synthesis was stimulated concurrently. Yet, the magnitude 80
of response differed between limiting nutrients. While AA synthesis increased up to fivefold 81
within 24 h upon the relief of N limitation, AA synthesis in P limited communities responded 82
delayed and at a lower magnitude. And although separation of total FA and carbohydrates into 83
storage and structural groups occurred in this study (based on polarity and glucose vs. all others 84
for FA and CH, respectively) a specific evaluation is missing.
85
A compound specific evaluation would allow for a much more detailed assessment of food 86
quality since several AA and FA are considered essential to higher trophic levels (Raubenheimer 87
et al., 2009) and the availability of a single compound can affect zooplankton growth and 88
reproduction (Müller-Navarra, 1995; Burns et al., 2011). Earlier studies show the effects of 89
nutrient supply, light and temperature on FA dynamics in a wide range of phytoplankton groups 90
(Renaud et al., 2002; Xin et al., 2010; Piepho et al., 2012). In general the limitation by nutrients 91
causes an increase in triglycerides (non-polar/storage FA), and a concurrent decrease in membrane 92
lipids (polar/ structural FA) especially under P-limitation (Fidalgo et al., 1998; Lynn et al., 2000).
93
Additionally, the degree of FA saturation is also affected by nutrient shortage, causing a shift from 94
poly-unsaturated FA (PUFA, which include essential FA) towards saturated FA (SFA; Siron et al., 95
1989; Reitan et al., 1994; Breteler et al., 2005).
96
Little is known about dynamics of individual AA in nutrient stressed phytoplankton, but it is 97
generally believed that the composition is relatively constant, an assumption mainly based on the 98
geochemical composition in particulate organic carbon in the water column or from detrital matter 99
in surface sediments (Dauwe and Middelburg, 1998; Dauwe et al., 1999). This would suggest that 100
essential AA (EAA), which include amongst others phenylalanine (Phe), leucine (Leu), valine 101
(Val), and arginine (Arg, [see Fig. 1 for full list]) (Claybrook, 1983; Lin et al., 2015) are supplied 102
at a constant ratio to non-essential AA (NEAA). EAA are, however, generally synthesized from 103
non-essential pre-cursor AA and their synthesis require additional steps and enzyme reactions 104
(Fig. 1). Therefore, nutrient limitation can induce shifts in organelle composition (Arrigo, 2005), 105
and the up- or down-regulation of specific biomolecule pathways and their enzymes (Morey et al., 106
2011; Yang et al., 2011), which consequently could lead to the synthesis of different sets of 107
proteins, with a possibly different composition of individual AA, and affect the nutritional quality 108
of phytoplankton.
109
Here we characterize nutrient driven dynamics in concentrations and biosynthesis rates of 110
individual AA and several FA groups (based on their degree of saturation and nutritional value to 111
higher trophic levels) obtained from the experiments by Grosse et al. (2017). We hypothesize that 112
N and P availability or limitation affects the quality of AA and FA composition in phytoplankton.
113
Hence the short-term response to the relief of N and P limitation has different effects on individual 114
biomolecule synthesis rates. To address this hypothesis we evaluated the dynamics of individual 115
compounds in phytoplankton field populations during pre-bloom, spring bloom and post-bloom 116
conditions. Furthermore, we identified shifts in individual compound dynamics after the relief of 117
nutrient limitation in nutrient addition experiments (24 – 72 h) in order to determine nutrient- 118
specific and phytoplankton community-specific shifts in compound quality.
119 120
Material and Methods
121
Sampling transect. A total of five cruises spread over three consecutive years were conducted 122
onboard the Dutch research vessel RV Pelagia, sampling a transect from the Dutch coast towards 123
the center of the North Sea. Four stations (Fig. 2) with different nutrient settings were investigated.
124
The coastal zone station (CZ) is only 7 km offshore and influenced by high nutrient riverine run- 125
off and its shallowness (8 m) assures a completely mixed water column. The Oyster Ground (OG) 126
station is located around 100 km offshore and can be affected by either mixed coastal or stratified 127
waters, depending on the exact location of the Frisian Front, which is situated in the broad zone 128
around 54°N (Peeters and Peperzak, 1990). The Dogger Bank station (DB, 250 km off-shore) 129
shows low nutrient availability throughout the year and due to its shallowness does not display 130
stratification. The central North Sea (CNS, 450 km off-shore) shows the highest influence of 131
Atlantic Ocean water, which is low in nutrients and induces thermal stratification during summer.
132
The cruises took place 25 − 31 May 2011, 15 − 30 August 2011, 8 − 12 May 2012, 15 − 25 March 133
2013, and 24 April - 4 May 2013. The timing of the cruises coincided with pre-bloom conditions 134
(March 2013), the peak (April 2013) and the decline (Mid May 2012) of the spring-bloom as well 135
as post-bloom conditions (End May 2011) and the late summer period (August 2011).
136
Water for measurements and experiments was collected using a sampling rosette with 24 Niskin 137
bottles (12 L), equipped with a Sea-Bird SBE911+ CTD sampler (Sea-Bird Electronics Inc., USA) 138
to obtain water column distribution of salinity, temperature and photosynthetically available 139
radiation.
140
Nutrient addition experiments. The experimental design was according to Grosse et al. (2017).
141
In short, on-board nutrient addition experiments were performed to test for nutrient limitation.
142
Concurrently, treatments were enriched with 13C-DIC to trace photosynthetically fixed carbon into 143
individual biomolecules. Sub-surface water (7 m) was collected shortly before sunrise and directly 144
transferred into 10 L carboys. The following treatments were set up in duplicates: Control, +N 145
(addition of 80 μM NaNO3), +P (5 μM K2HPO4) and +NPSi (80 μM NaNO3, 5 μM K2HPO4 and 146
80 μM Si(OH)4). All carboys were enriched with 13C-sodium bicarbonate (99% 13C) to a final 147
labeling concentration of 1.5 to 2 % of ambient DIC concentration (approximately 200 μM).
148
Carboys were incubated for 24 h in flow-through incubators on deck, which were continuously 149
flushed with seawater to assure in-situ temperature and light condition. Aliquot samples were 150
filtered over pre-combusted GF/F filters (Whatman, 4 h at 450°C) for POC, AA and FA analysis. , 151
The filtered volume ranged from 0.3 - 2.0 L, depending on the phytoplankton density and POC 152
filters were pre-weight to enable partial filter analysis later. All filters were stored frozen at −80°C 153
until analysis.
154
During selected cruises, nutrient additions lasting 72 h were also carried out at the CZ and DB 155
to investigate if short-term changes in biomolecule synthesis differ from long-term changes and if 156
changes in biomolecule synthesis translate into shifts in relative biomolecule concentrations.
157
Therefore, a second set of nutrient treatments was set-up (control, +N, +P, +NPSi, in duplicates) 158
concurrently with the above mentioned incubations, the 13C-DIC was added after 48 h and the 159
incubations were terminated after 72 h as described above.
160
Analytical procedures. Biomolecule extraction protocols, analytical procedures and calculation 161
of 13C uptake rates have been published in Grosse et al. (2015, 2017) and references therein. In 162
short, AA samples were acid hydrolyzed and after an ion-exchange clean-up step analyzed by LC- 163
IRMS using a Primsep A column, which separated a total of 17 individual AA (McCullagh et al., 164
2006). Due to the analytical procedures glutamate and glutamine (Glx) co-elute and formed one 165
peak, as do aspartate and asparagine (Asx). All AA with the exception of tryptophan can be 166
measured with the method used, but because of very low concentrations of cysteine and 167
methionine both were excluded from the data analysis.
168
FA samples were extracted following the protocol of Bligh and Dyer (1959) and subsequently 169
separated into storage lipids, glycolipids and phospholipids by silicate column chromatography.
170
All three fractions were dried down and the glycolipid- and phospholipid fraction were combined 171
and are further referred to as structural lipids. After derivatization to fatty acid methyl esters 172
(FAMEs), FAME from both storage and structural lipids were separated by GC/C-IRMS using the 173
polar BPX-70 column. Fatty acids were notated A:BωC, where A is the number of carbon 174
molecules in the fatty acid, B the number of double bonds and C the position of the first double 175
bond relative to the aliphatic end. In order to evaluate nutrient effects on the saturation of FA 176
composition, FA of the structural and storage pools were further divided by their degree of 177
saturation into saturated FA (SFA), mono-unsaturated FA (MUFA) and poly-unsaturated FA 178
(PUFA). In order to reflect the contribution of different phytoplankton groups, PUFAs were 179
furthermore separated into PUFA containing 16 C-atoms (C16-PUFA; diatom specific) and PUFA 180
containing 18 C-atoms (C18-PUFA; flagellate specific; Dijkman and Kromkamp, 2006). The 181
PUFA 20:5ω3 and 22:6ω3 were evaluated individually because their ratio is indicative of the 182
dominating phytoplankton group. 20:5ω3/22:6ω3 ratios 1 signal the dominance of flagellates, 183
while a value <1 is suggestive of a greater contribution of diatoms (Budge and Parrish, 1998).
184
Biosynthesis rates of each individual compound were calculated from 13C incorporation rates 185
according to Grosse et al. (2015), and were added up in order to obtain values for each 186
biomolecule group (essential and non-essential AA and storage and structural FA. Throughout this 187
text, biomolecule concentrations and biosynthesis rates were reported relative to the total AA and 188
total FA, respectively. Unless noted differently, all data is shown as average (± standard 189
deviation), n = 2.
190
Statistical analysis. To explore differences in individual AA and FA composition under 191
different nutrient limitations, principle component analysis (PCA) was performed with the relative 192
contribution (%) of (i) individual AA and 12 FA group concentrations to total AA and FA 193
concentrations (nmol C (μmol POC)-1) and (ii) individual AA and 12 FA group synthesis rates to 194
total AA and FA synthesis rates (nmol C (μmol POC)-1 d-1). The 12 FA groups comprise of 6 195
structural FA groups (SFA, MUFA, C16 PUFA, C18 PUFA, 20:5ω3, 22:6ω3) and 6 storage FA 196
groups (SFA, MUFA, C16 PUFA, C18 PUFA, 20:5ω3, 22:6ω3). The package 197
CRAN:factoMineR in the open source software R was used for the PCA analysis using a 198
correlation matrix (Lê et al., 2008, R Core Team, 2013).
199 200
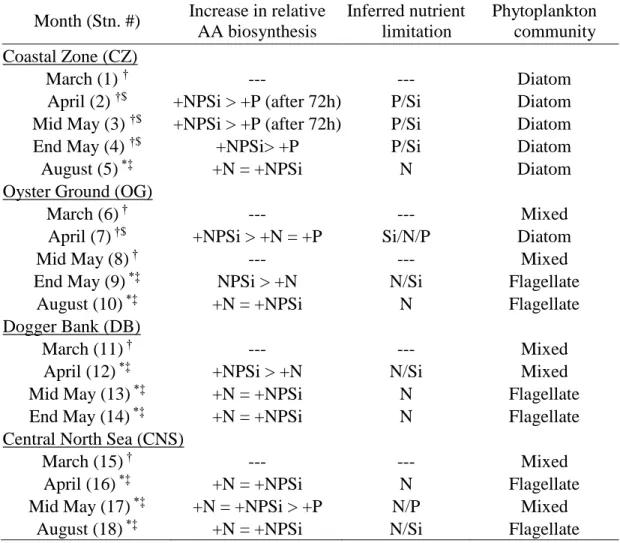
Results 201
General context of seasonal succession 202
Seasonal evolution of nutrients, resulting nutrient limitations and phytoplankton community 203
composition have been discussed elsewhere (Burson et al., 2016; Grosse et al., 2017). In summary 204
(Tab. 1), the development of inorganic nutrients showed a general decrease in concentrations over 205
seasonal and special scales. The resulting DIN:DIP ratios suggested that near shore stations (CZ 206
and OG) were P limited during bloom-cruises and shifted towards N limitation thereafter, while 207
stations farther offshore were limited by N-limited during all sampling periods (Burson et al., 208
2016; Grosse et al., 2017). However, Grosse et al. (2017) used the response in total AA 209
biosynthesis in nutrient addition assays (after 24h) to identify the prevailing nutrient limitation 210
(summarized in Tab. 2), which concur with nutrient limitations derived from DIN:DIP ratios (see 211
above).
212
They also used the structural FA composition to determine the dominating phytoplankton 213
community to be either dominated by diatoms or flagellates (summarized in Tab. 2). A few 214
stations could not be assigned clearly as either diatom or flagellate dominated and are therefore 215
referred to as “Mixed”. The phytoplankton community composition showed the shift from diatom 216
dominated communities to flagellate dominated communities that developed earlier in the year 217
with increasing distance to the coast (Grosse et al., 2017).
218 219
Individual amino acid contributions 220
Field conditions 221
In un-amended incubations (n=18), nutrient and community dependent differences in AA 222
biosynthesis and composition were investigated using PCA (Fig. 3a, b). The PCA of AA 223
biosynthesis showed that the first two principal components explained 54% (39% + 15%) of 224
variance in the dataset, while in PCA of AA concentration PC1 and PC2 explained 53% (32% + 225
21%) of the variance. For both biosynthesis and concentration a separation between not limited 226
mixed communities and N limited flagellate dominated communities occurred along the PC1 axis.
227
P (co-) limited stations did not cluster together but mixed with the other two groups. Concurrently, 228
there was a separation between essential AA (EAA) and non-essential AA (NEAA) in the 229
biosynthesis data along PC1 (Fig. 3a). EAA and Pro associated with non-limited communities, 230
while N-limited communities associated with all other NEAA. No such separation was observed 231
within the concentration data (Fig. 3b). There N limited communities were associated especially 232
with NEAA Asx, Glx and EAA Thr, while all other communities associate with EAAs as well as 233
NEAA Ala and Ser. A separation along the PC2 axis occurred as well and was associated with 234
Pro, Lys and Tyr. In order to demonstrate the variance between stations we plotted individual AA 235
concentration and biosynthesis of stations 4 and 18, representing a P limited diatom community 236
and a N limited flagellate community, respectively (Fig. 3c, d), clearly illustrating discussed 237
differences in AA contributions.
238
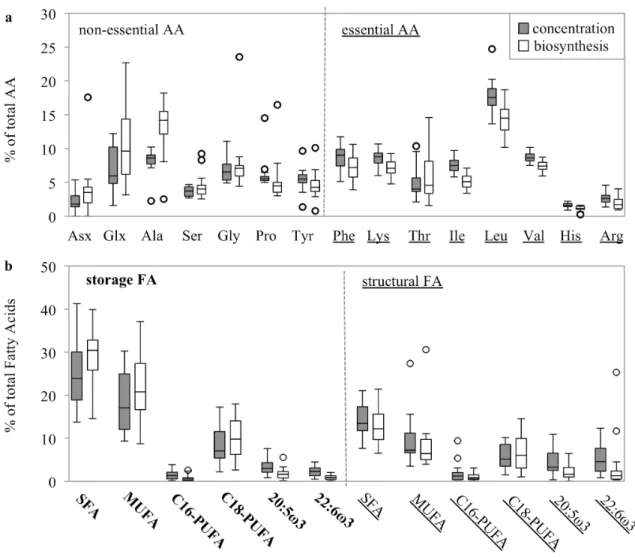
Across the whole dataset, there was substantial variation in both relative concentration and 239
biosynthesis when normalized to total AA (Fig. S1a). Variations were greater in biosynthesis than 240
in concentration, especially for NEAA such as Asx, Glx, Ala and Gly, while EAA Val, His and 241
Arg showed much smaller ranges in concentration and biosynthesis. Non-essential AA showed 242
higher relative biosynthesis compared to their concentration, while essential AA showed the 243
opposite trend, leading to a relative “over-synthesis” of non-essential AA and a relative “under- 244
synthesis” of essential AA in short-term (24 h) incubations.
245
Response to short-term nutrient addition 246
The effect of short-term nutrient addition (24 h) on AA biosynthesis was also studied using 247
PCA analysis (Fig. 4). Since AA biosynthesis seems to be nutrient specific we ran separate PCAs 248
for (i) N-limited communities at 9 stations and (ii) not and P limited communities at the other 9 249
stations (as identified in Tab.2). The PCA of N limited communities explained 59% (PC1: 44%, 250
PC2: 15%) of the variance in the data and a clear separation between treatments occurred (Fig. 4a).
251
Separation along the PC1 axis occurred between the NEAA Asx, Glx, Ala, and Gly, and all EAA 252
and Pro. The treatments where N limitation was relieved (+N and +NPSi) associated with all EAA 253
and Pro, opposite to control and +P treatments, which continued to associated with NEAA thereby 254
demonstrating clear and swift shifts in synthesis rates. The +P treatments of four stations (9, 12, 255
14, 17) formed an exception and also developed an association with EAA, comparable to the +N 256
and +NPSi, hereafter referred to as “Group X”. Although these stations were primarily N limited 257
they showed co-limitation by P or Si and the addition of P also triggered a shift towards EAA at 258
these stations. In the PCA of not and P limited stations (Fig. 4b) PC1 and PC 2 explained 36% and 259
21% of the variance, but differences in AA synthesis between different nutrient addition 260
treatments were not found.
261
Fatty acid groups 262
Field conditions 263
PCA was performed with FA group biosynthesis and concentration data (Fig. 5, n=18) and 264
revealed a separation between flagellate and diatom dominated communities with mixed 265
communities in between. The first two axes explained 55% (PC1: 31%, PC2: 24%) and 62% (PC1:
266
34%, PC2: 28%) of the variance in the biosynthesis and concentration data, respectively. As 267
expected, communities were associated with group specific FA (see Material & Methods).
268
Flagellate communities were associated with structural and storage C18-PUFA as well as 269
structural 22:6ω3, while diatoms were associated with storage MUFA, storage and structural C16- 270
PUFA and storage 20:5ω3. No clear effect of nutrient limitation could be observed. However, the 271
Si limited diatoms at station 7 clearly separated from other stations in the biosynthesis and showed 272
higher concentrations of structural MUFA.
273
Similar to individual amino acids, the contribution of the FA groups to total FA varied over 274
seasonal and spatial scales (Fig. S1b). Storage SFA and MUFA showed highest contributions as 275
well as highest variability in both concentration and biosynthesis. Compared to the relative 276
concentration, storage SFA and MUFA showed higher relative biosynthesis leading to a relative 277
“over-synthesis” of these compound groups, while structural FA groups showed the opposite trend 278
(“under-synthesis”).
279
Response to nutrient addition 280
PCA was also performed on FA biosynthesis in nutrient addition treatments but revealed no 281
nutrient related short-term shifts (24 h; data not shown), suggesting shifts in FA biosynthesis 282
occurred slower than shifts in AA. Therefore, we performed a PCA using the relative differences 283
in FA biosynthesis between control and nutrient addition treatments. Nutrient specific responses 284
were seen in both N and P limited station (9 stations and 4 stations, respectively, Fig.6). For N 285
limited stations the first two PC axes explained 64% (PC1: 48% + PC2: 16%) of the variation. The 286
+N and +NPSi treatments responded with an increase in structural FA groups, while decreased 287
N:P ratios in the +P treatment (induced through PO4 addition) caused synthesis of storage FA 288
groups to intensify. The N limited diatom community (Stn. 5) showed a shift towards storage C16 289
PUFA and storage 20:5ω3 (Fig.6a).
290
For P limited stations the first two PC axes explained 66% (PC1: 39% + PC2: 27%) of the 291
variation. P limited stations showed the same response to the relief of nutrient limitation; at the 292
majority of stations the +P and +NPSi treatments showed a relative increase in all structural FA 293
groups, while +N treatments (with increased N:P ratios during the incubation) increased synthesis 294
of storage SFA and storage C16 and C18 PUFA (Fig. 6b).
295
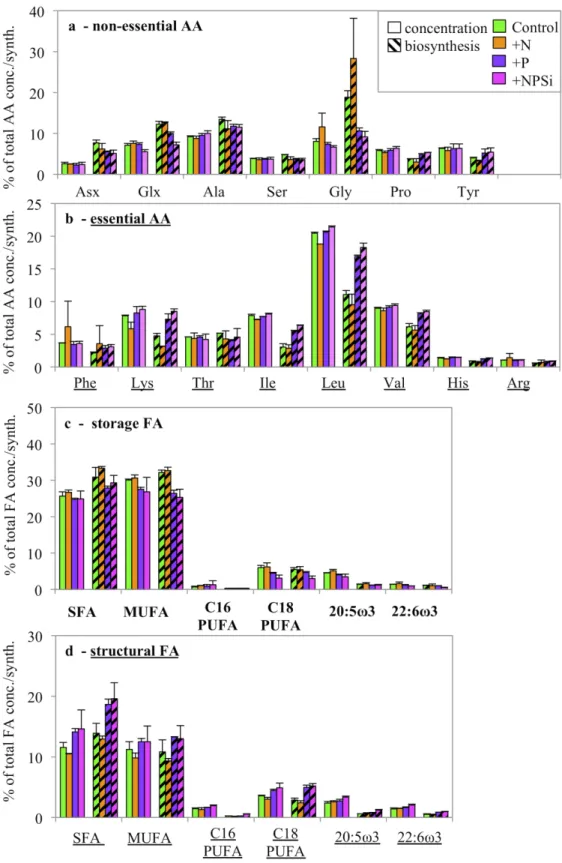
Longer-term effects of nutrient addition 296
Five longer-term incubations (72 h) were carried out to detect qualitative changes in AA 297
synthesis and concentrations. Due to the low number of stations data evaluation using PCA was 298
not possible and we decided to depict individual AA concentration and biosynthesis of the most 299
severe N limited station (Stn. 13) because there the response to nutrient addition was expected to 300
be greatest (Fig. 7a,b). Overall, nutrient additions showed similar effects in biosynthesis patterns 301
as seen after 24 h for Stn.13. There was a persistent decrease of NEAA and increased EAA 302
biosynthesis in the +N and +NPSi treatments, identical with the pattern found after 24 h.
303
Responses at the P limited station (Stn.2) also occurred but only a few NEAAs decreased (e.g.
304
Glx, Gly) and a few EAAs increased (e.g. Ile, Leu) in the +P and +NPSi treatments (Fig. S2a, b).
305
A similar effect was not seen in Stn. 1 and 3 (data not shown). Furthermore, resulting relative 306
changes in AA concentrations were difficult to identify at any station.
307
After 72 h shifts could be identified both in biosynthesis and concentration of relative FA 308
distribution (Fig. 7c, d, S2c, d). The relief of N limitation (+N and +NPSi, Stn. 13) and P 309
limitation (+P and +NPSi, Stn 2) caused a relative increase in the synthesis of structural MUFA 310
and all three structural PUFA groups with a concurrent decrease in all storage FA groups. This 311
shift in biosynthesis was also translated into the relative distribution of FA concentration, with 312
increasing structural FA groups and decreasing storage FA groups. Consequently, quantitative and 313
qualitative changes of FA concentrations need several days to become detectable.
314 315
Discussion 316
Response of phytoplankton to nutrient limitation 317
Coastal seas experience large perturbations in nutrient inputs, which may have important effects 318
on the cellular composition of phytoplankton and its nutritional quality for higher trophic levels.
319
Here we show that both, individual AA and groups of FA, exhibit specific responses to different 320
nutrient limitations in biosynthesis as well as composition. Biosynthesis patterns of individual AA 321
responded differently to N than to P limitation, and changes in relative AA contributions were 322
visible within 24 h. Biosynthesis patterns in FA groups showed similar responses to N and P 323
limitation and effects on relative FA group contribution were only clearly seen after 72 h.
324
Amino acid dynamics 325
Although re-supplying the limiting nutrient led to an increase in total AA synthesis (Grosse et 326
al., 2017), only the N limited phytoplankton communities showed shifts in the distribution of 327
individual AA after 24 h. Results from both un-amended and nutrient addition incubations showed 328
that under N limitation the pools of NEAA increased, especially Asx, Glx and Ala, while synthesis 329
of EAA and Pro decreased. The strong nutrient dependent separation of Glx and Asx from other 330
AA in PCAs of concentration, biosynthesis and nutrient additions (Fig. 3, 4) highlights their 331
function as pre-cursor in more complex pathways for essential AA (Fig. 1). The NEAA Pro stands 332
opposite to Glx even though it only requires a one-step reaction to synthesize Pro directly Glx.
333
However, Pro serves a special function in osmoregulation and in order to reduce N requirements 334
several phytoplankton groups are capable of substituting Pro with other osmolytes under N 335
limiting conditions (Bromke et al., 2013; Xiao et al., 2013). This causes Pro to be primarily 336
synthesized under N replete conditions and therefore to cluster with essential AA. The conversion 337
of NEAA to EAA relies on numerous additional enzymes, proteins themselves, and it may be 338
beneficial to reduce the production of these enzymes under N limitation. The up-regulation of AA 339
biosynthesis after P addition took much longer (several days) to be detected, compared to N 340
limited stations (Grosse et al., 2017). It was suggested that rRNA and ribosome synthesis had to 341
precede the up-regulation of AA (protein) synthesis, as they are main P containing compounds in 342
phytoplankton and their content is reduced under P scarcity (Elser et al., 2000; Van Mooy and 343
Devol, 2008; Hessen et al., 2010). Furthermore, only a few selected AA changed their relative 344
contribution to biosynthesis and no clear shift was visible that affects all AA (Fig. S2a, b), causing 345
a more uniform increase in the synthesis of individual AA. This would especially affect 346
translation, regulating the synthesis of protein chains, instead of being driven by the availability of 347
individual AA. Moreover, regulation at the gene-level is nutrient dependent as well. The lack and 348
the re-supply of N and P strongly affect gene expression patterns in a similar timely manner 349
(Morey et al., 2011; Yang et al., 2011). Genes related to ribosomes, carbohydrate metabolism, FA 350
metabolism as well as carbon fixation are both down- and up-regulated at different magnitudes 351
indicating changes in metabolic pathways and therefore highly affect protein composition hence 352
AA composition within cells (Morey et al., 2011; Yang et al., 2011; Bender et al., 2014). Silicon 353
starvation and replenishment in diatoms have similar effects on a large number of genes that 354
encode for many yet unknown proteins (Mock et al., 2008; Shrestha et al., 2012).
355
Interestingly, several N/P co-limited stations also showed the shifts towards EAA after P 356
addition (Group X, Fig. 4a). The response is similar to solely N limited stations and probably 357
depicts the response of different groups of phytoplankton within complex communities. Co- 358
incidentally, Burson et al. (2016) investigated phytoplankton group specific responses to nutrient 359
addition on one of these stations (Stn. 12). They found that dinoflagellates were not nutrient 360
limited, while nano-flagellates were limited by N, pico-eukaryotes were P limited, and Phaeocystis 361
sp., diatoms and pico-cyanobacteria showed N/P co-limitation. Co-limited phytoplankton may be 362
able to utilize remaining N concentrations after P addition (Harpole et al., 2011) causing AA 363
biosynthesis patterns to become similar to those after N addition.
364
Fatty acid dynamics 365
FA distribution is affected by multiple factors. Firstly, phytoplankton group specific FA shape 366
the FA composition of a community. On top of this, low nutrient availability regulates the degree 367
of FA saturation and the magnitude of storage FA synthesis. These responses seem to be the same 368
under N and P limited conditions. This shift from polar structural lipids (including phospholipids 369
and glycolipids) towards neutral storage lipids, has been described earlier by other authors (Weers 370
et al., 1997; Lynn et al., 2000; Mock and Kroon, 2002), however, only for changes in FA or lipid 371
concentrations. Shift from PUFA to MUFA could also be attributed to changes in synthesis 372
pathways, when desaturases and elongases cannot be synthesized in required amounts anymore 373
under nutrient limiting conditions (Flynn et al., 1992). In our study all structural FA groups 374
showed increased biosynthesis after 72 h but at different degrees after nutrient limitation was 375
alleviated: PUFA groups increased synthesis up to sixfold, while increase of SFA and MUFA were 376
about twofold or less (Fig. 7c,d). The delayed response in the FA fractions may be contributed to 377
the fact that depending on present nutrient regimes FA can flow between storage and structural 378
pools without requiring de-novo synthesis. Already synthesized storage FA may have been used to 379
increase amounts of structural FA within 24 h, but since they were not labeled by 13C tracers this 380
synthesis would have been undetected. This is supported by finding from Bender et al., (2014), 381
who showed that genes involved in FA metabolism are also immediately regulated after changes in 382
nutrient status.
383
To complete the list of parameters that affect biomolecule composition environmental 384
parameters such as light availability and temperature must be mentioned briefly (Mortensen et al., 385
1988). With regards to FA, water temperatures impact membrane fluidity, causing phytoplankton 386
to adapt by decreasing the degree of saturation in colder waters, e.g. decrease PUFA contributions 387
(Tedesco and Duerr, 1989). This may have played a role in March when Mixed communities 388
showed higher relative concentrations of structural MUFA and SFA.
389
Several groups of phytoplankton, including diatoms, have an additional way to cope with P- 390
scarcity. They are able to substitute P containing membrane lipids for N or sulfur containing lipids 391
thereby saving enough P to keep growth rates constant for several more cell divisions without 392
affecting FA composition (Van Mooy et al., 2009; Martin et al., 2011; Maat et al., 2016).This 393
mechanism may have played a role at the Coastal Zone station (Stn. 2-4), however, under the high 394
DIN:DIP ratios encountered (up to 333) in April this mechanisms may not have been effective to 395
overcome long-term P deficiencies and consequently also resulted in increased storage FA 396
concentrations and loss of PUFA during the peak of the spring bloom. This resulted in a lower 397
food quality of coastal phytoplankton groups as early as April during the peak of the spring bloom 398
(see below).
399
Biomolecule distribution in natural phytoplankton communities could be used to identify 400
prevailing nutrient limitations. Biosynthesis of individual AA in control incubations can be used to 401
distinguish between N limited and not/P limited stations as they cluster with NEAA and EAA 402
respectively (Fig. 3a). However, after nutrient addition long-term changes in AA concentrations 403
are only informative when considering total AA (Grosse et al., 2017), not individual AA (this 404
study). The main reason may be that AA concentrations were much higher than FA concentrations 405
(Grosse et al., 2017), hence changes in relative AA biosynthesis may take longer to translate into 406
relative AA concentrations. With average phytoplankton biomass turnover times of ~7 days 407
(Grosse et al., 2017) even the 72 h incubation period may have been too short to detect significant 408
shifts in AA composition. Therefore, future studies should incubate even longer to investigate this 409
issue further.
410 411
Contrary, nutrient-limitation was difficult to determine when only considering FA group 412
biosynthesis and concentration in control incubations (Fig. 5). This was due to the very diverse FA 413
composition between phytoplankton groups. Therefore, we suggest only considering the results of 414
the nutrient addition to identify nutrient specific effects, as species composition remained constant 415
during the 24-72 h incubations. In contrast to AA, changes in FA concentrations can be used to 416
determine the limiting nutrient in long-term nutrient addition assays. (this study).
417
Consequences for food quality 418
Biomolecule composition of phytoplankton has a direct effect on nutritional value for 419
consumers. Previous research has shown that EAA and PUFA are important determinants for 420
zooplankton growth (Müller-Navarra, 1995; Weers et al., 1997; Fink et al., 2011). In our study, 421
both pools were affected by nutrient limitations in diatom as well as photoautotrophic flagellate 422
communities, indicating that phytoplankton food quality varied substantially on both temporal and 423
spatial scales in the North Sea due to shifts in nutrient availability. It should be mentioned that 424
light intensity also modulates food quality, when increased light intensities result in higher relative 425
carbohydrate contribution, thus increasing C:N and C:P ratios and thereby decrease food quality 426
(van Oijen et al., 2007; Walter et al., 2015). However, light levels during incubations were chosen 427
in such a way that we exclude light stress to be a modulator of compound biosynthesis and 428
concentrations in our incubations.
429
Both diatoms and several autotrophic dinoflagellates are considered to have good food qualities 430
for grazers (Ianora et al., 1999; Turner et al., 2001; Turner et al., 2002). We found diatoms 431
dominating in early spring as well as throughout most of the year at the coastal zone (Grosse et al., 432
2017), typically dominating spring bloom events in temperate zones (Smetacek, 1999;
433
McQuatters-Gollop et al., 2007). These communities were either not nutrient limited or 434
experienced P-limitation, which caused a decrease in AA quantity (Grosse et al., 2017) but did not 435
affect AA quality (this study, Fig. 4b). On the other hand, flagellates (including both 436
dinoflagellates and Phaeocystis sp., Burson et al., 2016; Grosse et al., 2017), which were dominant 437
at the three stations farther offshore showed strong N limitation in late spring and summer. The 438
decrease in AA quantity under N limitation (Grosse et al., 2017) was accompanied by a qualitative 439
shift towards NEAA (this study, Fig. 4a). Both low quality and quantity of AA negatively affect 440
consumer’s growth (Guisande et al., 2000) and a lack of certain EAA was found to restrict the 441
reproduction of Daphnia and lead to changes in their life cycles (Fink et al., 2011; Koch et al., 442
2011). Nutrient limitation affected FA synthesis in several ways. Relative FA synthesis was 443
shifted (i) away from structural FA towards storage FA and (ii) away from PUFA towards SFA, 444
especially under P limitation (Fig. 6b). Among the PUFA groups, the highly unsaturated FA 445
20:5ω3 and 22:6ω3 are crucial for zooplankton survival and the maintenance of high growth and 446
reproductive rates (Müller-Navarra, 1995; Burns et al., 2011). Consequently, trophic transfer 447
efficiency and food web structure will be affected too (Brett and Müller-Navarra, 1997).
448
Therefore, these tow FA are considered to be good indicators for food quality (Park et al., 2002).
449
In conclusion, food quality in terms of AA and FA are both negatively and concurrently affected 450
by nutrient limitation that will cause a decline in quantity and quality of individual essential 451
compounds.
452
Overall, the phytoplankton response to nutrient addition is rather general resulting with an 453
overall increase in AA synthesis before the increase of other structural compounds (Grosse et al., 454
2017). However, the restricted pathways differ, i.e. N limitation inhibits protein synthesis and P 455
limitation inhibits synthesis of RNA (Loladze and Elser, 2011; Alipanah et al., 2015). The release 456
of nutrient limitation may occur in proximity to river plumes, upwelling regions, or through input 457
of deep water upon mixing (breakdown of vertical stratification in the water column). Even though 458
these inputs may be brief, we show that the phytoplankton community responds within 24 – 72h.
459
Subsequent effects on zooplankton may also be observed on relative short time scales, especially 460
in micro-zooplankton population dynamics with short generation times (17 – 30 days, Halsband- 461
Lenk et al., 2002; Bonnet et al., 2005). Anthropogenically induced changes in nutrient inputs from 462
land push coastal seas more and more from N limited into P limited systems (Thingstad et al., 463
1998; Philippart et al. 2000; Burson et al., 2016). Because zooplankton appears to be more 464
sensitive to P than to N limitation (Breteler et al., 2005), we recommend that future research also 465
considers other intracellular P-pools such as phospholipids, RNA and DNA.
466 467
References
468
Alipanah, L., Rohloff, J., Winge, P., Bones, A.M., and Brembu, T. (2015). Whole-cell response to 469
nitrogen deprivation in the diatom Phaeodactylum tricornutum. Journal of Experimental 470
Botany. doi: 10.1093/jxb/erv340.
471
Arrigo, K.R. (2005). Marine microorganisms and global nutrient cycles. Nature 437, 349-355. doi:
472
10.1038/nature04159.
473
Arts, M., and Kohler, C. (2009). Ch. 9, in In Lipids in aquatic ecosystems 1st edn, ed. e.A.M.e. al.:
474
Springer), 237–256.
475
Behrenfeld, M.J., Halsey, K.H., and Milligan, A.J. (2008). Evolved physiological responses of 476
phytoplankton to their integrated growth environment. Philosophical Transactions of the Royal 477
Society B-Biological Sciences 363(1504), 2687-2703. doi: 10.1098/rstb.2008.0019.
478
Bender, S.J., Durkin, C.A., Berthiaume, C.T., Morales, R.L., and Armbrust, E.V. (2014).
479
Transcriptional responses of three model diatoms to nitrate limitation of growth. Frontiers in 480
Marine Science. doi: 10.3389/fmars.2014.00003.
481
Bligh, E.G., and Dyer, W.J. (1959). A rapid method of total lipid extraction and purification.
482
Canadian Journal of Biochemistry and Physiology 37(8), 911-917.
483
Blomqvist, S., Gunnars, A., and Elmgren, R. (2004). Why the limiting nutrient differs between 484
temperate coastal seas and freshwater lakes: A matter of salt. Limnology and Oceanography 485
49(6), 2236-2241.
486
Bonnet, D., Richardson, A., Harris, R., Hirst, A., Beaugrand, G., Edwards, M., et al. (2005). An 487
overview of Calanus helgolandicus ecology in European waters. Progress in Oceanography 488
65(1), 1-53. doi: 10.1016/j.pocean.2005.02.002.
489
Borsheim, K.Y., Vadstein, O., Myklestad, S.M., Reinertsen, H., Kirkvold, S., and Olsen, Y.
490
(2005). Photosynthetic algal production, accumulation and release of phytoplankton storage 491
carbohydrates and bacterial production in a gradient in daily nutrient supply. Journal of 492
Plankton Research 27(8), 743-755. doi: 10.1093/plankt/fbi047.
493
Breteler, W.C.M.K., Schogt, N., and Rampen, S. (2005). Effect of diatom nutrient limitation on 494
copepod development: role of essential lipids. Marine Ecology Progress Series 291, 125-133.
495
Brett, M.T., and Müller-Navarra, D.C. (1997). The role of highly unsaturated fatty acids in aquatic 496
food web processes. Freshwater Biology 38(3), 483-499. doi: 10.1046/j.1365- 497
2427.1997.00220.x.
498
Bromke, M.A., Giavalisco, P., Willmitzer, L., and Hesse, H. (2013). Metabolic analysis of 499
adaptation to short-term changes in culture conditions of the marine diatom Thalassiosira 500
pseudonana. PLoS ONE 8(6), e67340. doi: 10.1371/journal.pone.0067340.
501
Budge, S.M., and Parrish, C.C. (1998). Lipid biogeochemistry of plankton, settling matter and 502
sediments in Trinity Bay, Newfoundland. II. Fatty acids. Organic Geochemistry 29(5-7), 1547- 503
1559.
504
Burns, C.W., Brett, M.T., and Schallenberg, M. (2011). A comparison of the trophic transfer of 505
fatty acids in freshwater plankton by cladocerans and calanoid copepods. Freshwater Biology 506
56(5), 889-903. doi: 10.1111/j.1365-2427.2010.02534.x.
507
Burson, A., Stomp, M., Akil, L., Brussaard, C.P.D., and Huisman, J. (2016). Unbalanced reduction 508
of nutrient loads has created an offshore gradient from phosphorus to nitrogen limitation in the 509
North Sea. Limnology and Oceanography 61(3), 869 - 888. doi: 10.1002/lno.10257.
510
Claybrook, D.L. (1983). Nitrogen Metabolism, in Internal anatomy and physiological regulation.
511
The biology of Crustacea, ed. L.H. Mantel. (New York: Academic Press, Inc), 163-213.
512
Dauwe, B., and Middelburg, J.J. (1998). Amino acids and hexosamines as indicators of organic 513
matter degradation state in North Sea sediments. Limnology and Oceanography 43(5), 782- 514
798. doi: 10.4319/lo.1998.43.5.0782.
515
Dauwe, B., Middelburg, J.J., Herman, P.M.J., and Heip, C.H.R. (1999). Linking diagenetic 516
alteration of amino acids and bulk organic matter reactivity. Limnology and Oceanography 517
44(7), 1809-1814. doi: 10.4319/lo.1999.44.7.1809.
518
Diez, B., Van Nieuwerburgh, L., and Snoeijs, P. (2013). Water nutrient stoichiometry modifies the 519
nutritional quality of phytoplankton and somatic growth of crustacean mesozooplankton.
520
Marine Ecology Progress Series 489, 93-105. doi: 10.3354/meps10438.
521
Dijkman, N.A., Boschker, H.T.S., Middelburg, J.J., and Kromkamp, J.C. (2009). Group-specific 522
primary production based on stable-isotope labeling of phospholipid-derived fatty acids.
523
Limnology and Oceanography-Methods 7, 612-625. doi: 10.4319/lom.2009.7.612.
524
Dijkman, N.A., and Kromkamp, J.C. (2006). Phospholipid-derived fatty acids as chemotaxonomic 525
markers for phytoplankton: application for inferring phytoplankton composition. Marine 526
Ecology-Progress Series 324, 113-125. doi: 10.3354/meps324113.
527
Elser, J.J., Sterner, R.W., Gorokhova, E., Fagan, W.F., Markow, T.A., Cotner, J.B., et al. (2000).
528
Biological stoichiometry from genes to ecosystems. Ecology Letters 3(6), 540-550. doi:
529
10.1111/j.1461-0248.2000.00185.x.
530
Falkowski, P.G. (2000). Rationalizing elemental ratios in unicellular algae. Journal of Phycology 531
36(1), 3-6.
532
Fidalgo, J.P., Cid, A., Torres, E., Sukenik, A., and Herrero, C. (1998). Effects of nitrogen source 533
and growth phase on proximate biochemical composition, lipid classes and fatty acid profile of 534
the marine microalga Isochrysis galbana. Aquaculture 166(1-2), 105-116.
535
Field, C.B., Behrenfeld, M.J., Randerson, J.T., and Falkowski, P. (1998). Primary production of 536
the biosphere: Integrating terrestrial and oceanic components. Science 281(5374), 237-240.
537
doi: 10.1126/science.281.5374.237.
538
Fink, P., Pflitsch, C., and Marin, K. (2011). Dietary essential amino acids affect the reproduction 539
of the keystone herbivore Daphnia pulex. Plos One 6 (12). doi: 10.1371/journal.pone.0028498.
540
Flynn, K.J., Garrido, J.L., Zapata, M., Opik, H., and Hipkin, C.R. (1992). Changes in fatty acids, 541
amino acids and carbon/nitrogen biomass during nitrogen starvation of ammonium-grown and 542
nitrate-grown Isochrysis galbana. Journal of Applied Phycology 4(2), 95-104. doi:
543
10.1007/bf02442457.
544
Geider, R.J., and LaRoche, J. (2002). Redfield revisited: Variability of C:N:P in marine 545
microalgae and its biochemical basis. European Journal of Phycology 37(01), 1-17. doi:
546
doi:10.1017/S0967026201003456.
547
Grosse, J., van Breugel, P., and Boschker, H.T.S. (2015). Tracing carbon fixation in 548
phytoplankton-compound specific and total 13C incorporation rates. Limnology and 549
Oceanography-Methods 13(6), 288-302. doi: 10.1002/lom3.10025.
550
Grosse, J., van Breugel, P., Brussaard, C.P.D., and Boschker, H.T.S. (2017). A biosynthesis view 551
on nutrient stress in coastal phytoplankton. Limnology and Oceanography 62(2), 490-506. doi:
552
10.1002/lno.10439.
553
Guisande, C., Riveiro, I., and Maneiro, I. (2000). Comparisons among the amino acid composition 554
of females, eggs and food to determine the relative importance of food quantity and food 555
quality to copepod reproduction. Marine Ecology Progress Series 202, 135-142. doi:
556
10.3354/meps202135.
557
Halsband-Lenk, C., Hirche, H.J., and Carlotti, F. (2002). Temperature impact on reproduction and 558
development of congener copepod populations. Journal of Experimental Marine Biology and 559
Ecology 271(2), 121-153. doi: 10.1016/s0022-0981(02)00025-4.
560
Harpole, W.S., Ngai, J.T., Cleland, E.E., Seabloom, E.W., Borer, E.T., Bracken, M.E.S., et al.
561
(2011). Nutrient co-limitation of primary producer communities. Ecology Letters 14(9), 852- 562
862. doi: 10.1111/j.1461-0248.2011.01651.x.
563
Hessen, D.O., Jeyasingh, P.D., Neiman, M., and Weider, L.J. (2010). Genome streamlining and 564
the elemental costs of growth. Trends in Ecology & Evolution 25(2), 75-80. doi:
565
10.1016/j.tree.2009.08.004.
566
Howarth, R.W., and Marino, R. (2006). Nitrogen as the limiting nutrient for eutrophication in 567
coastal marine ecosystems: Evolving views over three decades. Limnology and Oceanography 568
51(1), 364-376. doi: 10.4319/lo.2006.51.1_part_2.0364.
569
Ianora, A., Miralto, A., Buttino, I., Romano, G., and Poulet, S.A. (1999). First evidence of some 570
dinoflagellates reducing male copepod fertilization capacity. Limnology and Oceanography 571
44(1), 147-153. doi: 10.4319/lo.1999.44.1.0147.
572
Klausmeier, C.A., Litchman, E., Daufresne, T., and Levin, S.A. (2004). Optimal nitrogen-to- 573
phosphorus stoichiometry of phytoplankton. Nature 429(6988), 171-174. doi:
574
10.1038/nature02454.
575
Koch, U., Martin-Creuzburg, D., Grossart, H.-P., and Straile, D. (2011). Single dietary amino 576
acids control resting egg production and affect population growth of a key freshwater 577
herbivore. Oecologia 167(4), 981-989. doi: 10.1007/s00442-011-2047-4.
578
Lê, S., Josse, J., and Husson, F. (2008). FactoMineR: An R Package for Multivariate Analysis.
579
Journal of Statistical Software 25, 1-18. doi: 10.18637/jss.v025.i01 580
Lin, H.Z., Tan, X.H., Zhou, C.P., Niu, J., Xia, D.M., Huang, Z., et al. (2015). Effect of dietary 581
arginine levels on the growth performance, feed utilization, non-specific immune response and 582
disease resistance of juvenile golden pompano Trachinotus ovatus. Aquaculture 437, 382-389.
583
Loladze, I., and Elser, J.J. (2011). The origins of the Redfield nitrogen-to-phosphorus ratio are in a 584
homoeostatic protein-to-rRNA ratio. Ecology Letters 14(3), 244-250. doi: 10.1111/j.1461- 585
0248.2010.01577.x.
586
Ly, J., Philippart, C.J.M., and Kromkamp, J.C. (2014). Phosphorus limitation during a 587
phytoplankton spring bloom in the western Dutch Wadden Sea. Journal of Sea Research 88, 588
109-120. doi: 10.1016/j.seares.2013.12.010.
589
Lynn, S.G., Kilham, S.S., Kreeger, D.A., and Interlandi, S.J. (2000). Effect of nutrient availability 590
on the biochemical and elemental stoichiometry in the freshwater diatom Stephanodiscus 591
minutulus (Bacillariophyceae). Journal of Phycology 36(3), 510-522. doi: 10.1046/j.1529- 592
8817.2000.98251.x.
593
Maat, D.S., Bale, N.J., Hopmans, E.C., Sinninghe Damsté, J.S., Schouten, S., and Brussaard, 594
C.P.D. (2016). Increasing P limitation and viral infection impact lipid remodeling of the 595
picophytoplankter Micromonas pusilla. Biogeosciences 13(5), 1667-1676. doi: 10.5194/bg-13- 596
1667-2016.
597
Martin, P., Van Mooy, B.A.S., Heithoff, A., and Dyhrman, S.T. (2011). Phosphorus supply drives 598
rapid turnover of membrane phospholipids in the diatom Thalassiosira pseudonana. Isme 599
Journal 5(6), 1057-1060. doi: 10.1038/ismej.2010.192.
600
McCullagh, J.S.O., Juchelka, D., and Hedges, R.E.M. (2006). Analysis of amino acid 13C 601
abundance from human and faunal bone collagen using liquid chromatography/isotope ratio 602
mass spectrometry. Rapid Communications in Mass Spectrometry 20(18), 2761-2768. doi:
603
10.1002/rcm.2651.
604
McQuatters-Gollop, A., Raitsos, D.E., Edwards, M., and Attrill, M.J. (2007). Spatial patterns of 605
diatom and dinoflagellate seasonal cycles in the NE Atlantic Ocean. Marine Ecology Progress 606
Series 339, 301-306.
607
Mock, T., and Kroon, B.M.A. (2002). Photosynthetic energy conversion under extreme conditions 608
- I: important role of lipids as structural modulators and energy sink under N-limited growth in 609
Antarctic sea ice diatoms. Phytochemistry 61(1), 41-51. doi: 10.1016/S0031-9422(02)00216-9.
610
Mock, T., Samanta, M.P., Iverson, V., Berthiaume, C., Robison, M., Holtermann, K., et al. (2008).
611
Whole-genome expression profiling of the marine diatom Thalassiosira pseudonana identifies 612
genes involved in silicon bioprocesses. Proceedings of the National Academy of Sciences 613
105(5), 1579-1584. doi: 10.1073/pnas.0707946105.
614
Morey, J.S., Monroe, E.A., Kinney, A.L., Beal, M., Johnson, J.G., Hitchcock, G.L., et al. (2011).
615
Transcriptomic response of the red tide dinoflagellate, Karenia brevis, to nitrogen and 616
phosphorus depletion and addition. BMC Genomics 12, 346-346. doi: 10.1186/1471-2164-12- 617
346.
618
Mortensen, S.H., Børsheim, K.Y., Rainuzzo, J., and Knutsen, G. (1988). Fatty acid and elemental 619
composition of the marine diatom Chaetoceros gracilis Schütt. Effects of silicate deprivation, 620
temperature and light intensity. Journal of Experimental Marine Biology and Ecology 122(2), 621
173-185. doi: http://dx.doi.org/10.1016/0022-0981(88)90183-9.
622
Müller-Navarra, D.C. (1995). Evidence that a highly unsatturated fatty acid limits Daphnia growth 623
in nature. Archiv Fur Hydrobiologie 132(3), 297-307.
624
OSPAR (1988). PARCOM recommendation 88/2: On the reduction in nutrients to the Paris 625
convention area. Publication number 88/2, Paris Commission.
626
OSPAR (2010). Quality Status Report 2010. OSPAR Commission. London. 176 pp.
627
Park, S., Brett, M.T., Müller-Navarra, D.C., and Goldman, C.R. (2002). Essential fatty acid 628
content and the phosphorus to carbon ratio in cultured algae as indicators of food quality for 629
Daphnia. Freshwater Biology 47(8), 1377-1390. doi: 10.1046/j.1365-2427.2002.00870.x.
630
Peeters, J.C.H., and Peperzak, L. (1990). Nutrient limitation in the North Sea - A bioassay 631
approach. Netherlands Journal of Sea Research 26(1), 61-73. doi: 10.1016/0077- 632
7579(90)90056-m.
633
Philippart, C.J.M., Cadee, G.C., van Raaphorst, W., and Riegman, R. (2000). Long-term 634
phytoplankton-nutrient interactions in a shallow coastal sea: Algal community structure, 635
nutrient budgets, and denitrification potential. Limnology and Oceanography 45(1), 131-144.
636
doi: 10.4319/lo.2000.45.1.0131.
637
Piepho, M., Arts, M.T., and Wacker, A. (2012). Species-specific variations in fatty acid 638
concentrations of four phytoplankton species: Does phosphorus supply influence the effect of 639
light intensity or temperature? Journal of Phycology 48(1), 64-73. doi: 10.1111/j.1529- 640
8817.2011.01103.x.
641
Plath, K., and Boersma, M. (2001). Mineral limitation of zooplankton: Stoichiometric constraints 642
and optimal foraging. Ecology 82(5), 1260-1269. doi: 10.1890/0012- 643
9658(2001)082[1260:mlozsc]2.0.co;2.
644
Quigg, A., Finkel, Z.V., Irwin, A.J., Rosenthal, Y., Ho, T.Y., Reinfelder, J.R., et al. (2003). The 645
evolutionary inheritance of elemental stoichiometry in marine phytoplankton. Nature 646
425(6955), 291-294. doi: 10.1038/nature01953.
647
R Core Team (2013). R: A language and environment for statistical computing. R Foundation for 648
Statistical Computing, Vienna, Austria. URL http://www.R-project.org/
649
Raubenheimer, D., Simpson, S.J., and Mayntz, D. (2009). Nutrition, ecology and nutritional 650
ecology: toward an integrated framework. Functional Ecology 23(1), 4-16.
651
Reitan, K.I., Rainuzzo, J.R., and Olsen, Y. (1994). Effect of nutrient limitation on fatty acid and 652
lipid content in marine microalgae. Journal of Phycology 30(6), 972-979. doi: 10.1111/j.0022- 653
3646.1994.00972.x.
654
Renaud, S.M., Thinh, L.V., Lambrinidis, G., and Parry, D.L. (2002). Effect of temperature on 655
growth, chemical composition and fatty acid composition of tropical Australian microalgae 656
grown in batch cultures. Aquaculture 211(1-4), 195-214.
657
Shrestha, R.P., Tesson, B., Norden-Krichmar, T., Federowicz, S., Hildebrand, M., and Allen, A.E.
658
(2012). Whole transcriptome analysis of the silicon response of the diatom Thalassiosira 659
pseudonana. BMC Genomics 13(1), 1-16. doi: 10.1186/1471-2164-13-499.
660
Siron, R., Giusti, G., and Berland, B. (1989). Changes in the fatty acid composition of 661
Phaeodactylum tricornutum and Dunaliella tertiolecta during growth and under phosphorus 662
deficiency. Marine Ecology Progress Series 55(1), 95-100. doi: 10.3354/meps055095.
663
Smetacek, V. (1999). Diatoms and the Ocean Carbon Cycle. Protist 150(1), 25-32. doi:
664
https://doi.org/10.1016/S1434-4610(99)70006-4.
665
Smith, V.H., Tilman, G.D., and Nekola, J.C. (1999). Eutrophication: impacts of excess nutrient 666
inputs on freshwater, marine, and terrestrial ecosystems. Environmental Pollution 100(1-3), 667
179-196.
668
Sterner, R.W., and Elser, J.J. (2002). Ecological Stoichiometry: The Biology of Elements from 669
Molecules to the Biosphere. Princeton, NJ: Princeton University Press.
670
Sylvan, J.B., Quigg, A., Tozzi, S., and Ammerman, J.W. (2007). Eutrophication-induced 671
phosphorus limitation in the Mississippi River plume: Evidence from fast repetition rate 672
fluorometry. Limnology & Oceanography 52(6), 2679-2685.
673
Tedesco, M.A., and Duerr, E.O. (1989). Light, temperature and nitrogen starvation effects on the 674
total lipid and fatty acid content and composition of Spirulina platensis UTEX 1928. Journal 675
of Applied Phycology 1(3), 201-209. doi: 10.1007/bf00003646.
676
Thingstad, T.F., Zweifel, U.L., and Rassoulzadegan, F. (1998). P limitation of heterotrophic 677
bacteria and phytoplankton in the northwest Mediterranean. Limnology and Oceanography 678
43(1), 88-94. doi: 10.4319/lo.1998.43.1.0088.
679
Troost, T.A., de Kluijver, A., and Los, F.J. (2014). Evaluation of eutrophication variables and 680
thresholds in the Dutch North Sea in a historical context — A model analysis. Journal of 681
Marine Systems 134, 45-56. doi: http://dx.doi.org/10.1016/j.jmarsys.2014.01.015.
682
Turner, J.T., Ianora, A., Esposito, F., Carotenuto, Y., and Miralto, A. (2002). Zooplankton feeding 683
ecology: does a diet of Phaeocystis support good copepod grazing, survival, egg production 684
and egg hatching success? Journal of Plankton Research 24(11), 1185-1195. doi:
685
10.1093/plankt/24.11.1185.
686
Turner, J.T., Ianora, A., Miralto, A., Laabir, M., and Esposito, F. (2001). Decoupling of copepod 687
grazing rates, fecundity and egg-hatching success on mixed and alternating diatom and 688
dinoflagellate diets. Marine Ecology Progress Series 220, 187-199. doi: 10.3354/meps220187.
689
Van Mooy, B.A.S., and Devol, A.H. (2008). Assessing nutrient limitation of Prochlorococcus in 690
the North Pacific subtropical gyre by using an RNA capture method. Limnology &
691
Oceanography 53(1), 78-88. doi: 10.4319/lo.2008.53.1.0078.
692
Van Mooy, B.A.S., Fredricks, H.F., Pedler, B.E., Dyhrman, S.T., Karl, D.M., Koblizek, M., et al.
693
(2009). Phytoplankton in the ocean use non-phosphorus lipids in response to phosphorus 694
scarcity. Nature 458(7234), 69-72. doi: 10.1038/nature07659.
695
van Oijen, T., van Leeuwe, M.A., Gieskes W.W.C., and de Baar, & H.J.W. (2007). Effects of iron 696
limitation on photosynthesis and carbohydrate metabolism in the Antarctic diatom 697
Chaetoceros brevis (Bacillariophyceae). European Journal of Phycology 39(2), 161-171, doi:
698
10.1080/0967026042000202127 699
Vrede, T., Dobberfuhl, D.R., Kooijman, S., and Elser, J.J. (2004). Fundamental connections 700
among organism C : N : P stoichiometry, macromolecular composition, and growth. Ecology 701
85(5), 1217-1229. doi: 10.1890/02-0249.
702
Walter, B., Peters, J., van Beusekom, J.E.E., St. John, M.A. (2015). Interactive effects of 703
temperature and light during deep convection: a case study on growth and condition of the 704
diatom Thalassiosira weissflogii. ICES Journal of Marine Science 72(6), 2061-2071. doi:
705
10.1093/icesjms/fsu218 706
Weers, P.M.M., Siewertsen, K., and Gulati, R.D. (1997). Is the fatty acid composition of Daphnia 707
galeata determined by the fatty acid composition of the ingested diet? Freshwater Biology 708
38(3), 731-738. doi: 10.1046/j.1365-2427.1997.00238.x.
709
Xiao, Y., Zhang, J., Cui, J., Feng, Y., and Cui, Q. (2013). Metabolic profiles of Nannochloropsis 710
oceanica IMET1 under nitrogen-deficiency stress. Bioresource Technology 130(0), 731-738.
711
doi: http://dx.doi.org/10.1016/j.biortech.2012.11.116.
712
Xin, L., Hong-ying, H., Ke, G., and Ying-xue, S. (2010). Effects of different nitrogen and 713
phosphorus concentrations on the growth, nutrient uptake, and lipid accumulation of a 714
freshwater microalga Scenedesmus sp. Bioresource Technology 101(14), 5494-5500. doi:
715
http://dx.doi.org/10.1016/j.biortech.2010.02.016.
716
Xu, J., Yin, K., He, L., Yuan, X., Ho, A.Y.T., and Harrison, P.J. (2008). Phosphorus limitation in 717
the northern South China Sea during late summer: Influence of the Pearl River. Deep-Sea 718
Research I 55, 1330-1342. doi: doi:10.1016/j.dsr.2008.05.007.
719
Yang, I., Beszteri, S., Tillmann, U., Cembella, A., and John, U. (2011). Growth-and nutrient- 720
dependent gene expression in the toxigenic marine dinoflagellate Alexandrium minutum.
721
Harmful Algae 12, 55-69.
722 723
Acknowledgments 724
The authors thank the captain and crew of the R/V Pelagia for their help and support during the 725
cruises, and Amanda Burson, Ruben van Drie and Elodie Burrillon for their skilled assistance with 726
experimental work onboard. Special thanks to the Nutrient Lab at NIOZ-Texel for providing 727
nutrient data, the Analytical Lab at NIOZ-Yerseke for the analysis of pigment samples and the 728
reviewers for their constructive comments. This research is part of the CHARLET project and was 729
supported by the Netherlands Organization for Scientific Research (NWO) to HTSB (grant ZKO 730
839.10.511).
731