J. Clin. Chem. Clin. Biochem.
Vol. 22, 1984, pp.97-104
Biological, Analytical and Experimental Components of Variance in a Long-Term Study of Plasma Constituents in Rat
By J. Lindena,
Abteilung klinische Biochemie D. Büttner
Abteilung Versuchstierkunde and /. Trautschold
Abteilung Klinische Biochemie Medizinische Hochschule Hannover
\
(Received June 27/September 23, 1983)
Summary: Statistical analysis of variance was applied to data from determinations of 14 plasma constituents in 25 rats in order to evaluate the analytical* experimental and biological (inter-and intraindividual) component of variance. Blood was taken seven times in intervals of 8—10 days, the last one by catheter technique and the other by heart puncture. The analytical portion of variance was determined by the concurrent analysis of a pool plasma Standard. The experimental component of variance was evaluated by the comparison of the Variation of the catheter values with that of the pooled data froin heart puncture. The coefficient of Variation for the latter may be grouped into three categories: less than 10% for protein, Na+, K+, Ca2+; 10—20% for urea, phosphate and the enzymes äs alanine aminotransferase, choline esterase, alkaline phosphatase and leucine arylamidase and 20^-65% for the other enzymes lactate dehydrogenase, malate dehydrogenase, as- partate aminotransferase and creatine kinase. The results from the samples taken by catheter technique gen- erälly revealed the lower values for the mean äs well äs for the variance. It became evident that the procedure of heart puncture is afflicted with the most aggravating interference factors, thus accounting for most of the experimental component of variance. The observed differences between the single blood drawings, the non- Gaussian distribution for several constituents, and the interactions between the components of variance do not always fit for the Statistical concept of additivity of the single components. Therefore the result for the partition öf the variance in single components may be more or less approximative in the strict sense of Statisti- cal values, but it provides a practical guide for clinical chemical research with small laboratory animals.
Biologische, analytische und experimentelle Varianzkomponenten von Plasmamerkmalen in einer Langzeitstu- die bei der Ratte
Zusammenfassung: Ergebnisse der Bestimmung von 14 Blutmerkmalen bei 25 Ratten wurden varianzanaly- tisch untersucht, um die analytischen, experimentellen und biologischen (inter- und intraindividuellen) Vari- anzkomponenten zu differenzieren. Blut wurde sieben Mal im 8—10-Tage-Intervall entnommen; die letzte Entnahme mit der Kathetertechnik, die anderen als Herzpunktion. Der analytische Anteil wurde über die gleichzeitige Analyse eines Poolplasma-Standards bestimmt. Die experimentelle Varianzkomponente wurde über einen Vergleich der Varianzwerte der Katheterentnahme mit der der Herzpunktionen ermittelt. Der Variationskoeffizient letzterer Werte läßt sich in drei Gruppen einteilen: Weniger als 10% für Protein, Na+, K+, Ca2+; 10—20% für Harnstoff, Phosphat und Enzyme wie Alaninaminotransferase, Cholinesterase, alka-
98 Lindena, Büttner and Trautschold: Components of variance of rat plasma constituents
lische Phosphatase, Leucinarylamidase und 20-65% für die übrigen Enzyme Lactatdehydrogenase, Malat- dehydrogenase, Aspartataminotransferase und Kreatinkinase. Die Ergebnisse der Katheterproben weisen im allgemeinen kleinere Mittelwerte und Streuungen auf. Es ist offensichtlich, daß die Entnahmetechnik der Herzpunktion am gravierendsten von Störfaktoren beeinflußt wird und darüber am meisten zur experimentel- len Varianzkomponente beiträgt. Die Mittelwertsunterschiede zwischen den einzelnen Blutentnahmen, eine nicht Gauss'sche Verteilungsform für zahlreiche Kenngrößen und Interaktionswerte zwischen den Varianzan- teilen genügen nicht immer dem Additivitätsmodell. Das Ergebnis der Aufteilung der Gesamtvarianz in Ein- zelkomponenten ist daher im strengen statistischen Sinne nur approximativ. Daraus aber leiten sich prak- tische Hinweise für die Klinische Chemie bei der Forschung mit kleinen Laboratoriumstieren ab.
Introduction
Clinical chemical analyses are carried out in many animal experiments for medical research. For the evaluation of the analytical results fundamentals which have been elaborated in human medicine are still frequently missing in the clinical chemistry of animal research, such äs reliability criteria, reference values, and conditions of collection and preparation of specimen (1). These and other important influen- ces on the height and variance of the values of many common blood constituents were characterized for humans first by the groups of Williams, Harris, Cot- love and Young (2—5) and by the groups of Stat- land, Winkel and Bokelund (6-10). They distin- guished between analytical and experimental contri- butions to the variance, and differentiated these con- tributions from those due to biological Variation within each individual (intra-individual variance), and to differences among individuals (inter-individü- al variance), using Standard statistical analysis of var- iance, providing the additivity of the single compo- nents. In a long term study in rats with repeated blood drawing we tried to isolate and quantify these coniponents of variance for 14 blood constituents.
Material and Methods Animals and blood drawing
30 male LEW/Ztm rats aged 104 to 130 days and weighing 338 to 360 g at the beginning of the experiment were kept singly in poly- carbonate cages ("Makroion", type 111) on sterile wooden gra- nules and were allowed to adapt for 2 weeks to their air-condi- tioned and light-controlled environment in the animal room (22 ± 1°C; 55% relative humidity; light period from 19.00 to 07.00;
feeding ad libitum with Altromin 1324; tap water from Makroion bottles). The animals wefe free from all the pathogens specified in the GV-SOLAS list (11). Anaesthesia was induced by intraperito- neal ihjection of mixed xylazine (Rompun® diluted with 0.15 mol/1 NaCl to 1.6 g/l), and ketamine (Ketavet®, diluted to 10 g/l) with 0.016 and 0.1 g/kg body weight, respectively. Blood samples were drawn 6 times by heart puncture with intervals of 8-10 days. The 7th blood sample was collected by a carotid artery ca- thether. The common carotid artery runs cranially along the later- al aspect of the trachea without giving off any branches. Itis co-
vered by the sternothyroid muscle, and is made accessible at the triangle formed by the sternomastoid and sternohyoid muscles, which are bluntly dissected. The vessel becomes easily visible by the whitish N. vagus which is always connected with the artery.
The extremely elastic vessel is put over both arms of a small pair of forceps, is cranially ligated, and a moderately bevelled polyeth- ylene catheter (Portex, Great Britain; i.d. 0.58 mm, o.d. 0.98 mm)) is inserted for about 0.5 cm in length.
Each sample consists of 3 ml of heparinized blood (40 U/ml).
Blood was centrifuged immediately on a Eppendorf centrifuge 3200 (Netheler and Hinz, Hamburg) for 2 min at 12000 x g at room temperature. Plasma was portioned and frozen at —80 °C.
Of the initial 30 rats, 5 animals, developed a heärt tamponade and were excluded from the study.
The blood sampling and analysis ordef were randomized anew for each blood drawing. The team of experimenters for the blood sampling and analytical procedure consisted of three persons, each performing the same task for the entire series of experi^
ments. They were experienced in working with laboratory animals and in clinical-biochemical analyses.
Plasma chemical analyses
The following parameters were determined in.plasma: lactate de- hydrogenase (EC 1.1.1.27); malate dehydrogeriase (EC 1.1.1.37); aspartate aminotransferase (EC 2.6.1.1); alanine ami- notransferase (EC 2.6.1.2); creatine kinase (EC 2.7.3.2); choline esterase, with buturylthiocholine äs Substrate (EC 3.1.1.8); alka- line phosphatase (EC 3.1.3.1); leucine arylamidase (EC 3.4.11.1), protein, urea, inorganic phosphate (Pj), sodiüm (Na4"), potassium (K"**), calcium (Ca2+). Enzyme assays were carried out using UV or colorimetric tests on a microliter scale at 25 °C with optimized commercial tests (Boehringer, Mannheim and Merck, Darmstadt) according to the "Recomrnendations of the German Society for Clinical Chemistry" (12). For creatine kinase determi- nation the revised Standard method with the addition of EDTA was used (13). Protein, urea and inorganic phosphate were deter- mined with Standard methods using cornmercial kits (Boehringer, Mannheim and Merck, Därmstadt)" on a one channej diseontinu- ous analyser (BraunSystematik; Braun, Melsungen). Sodiüm, pot- assium and calcium were estimated by flame photometry.
All measurements were performed äs individual duplicate ana- lyses in the course of four consecutive days. The analytical var- iance was determined from plasma pool samples of rat, which were distributed at random in the series in the same number äs the specimens.
Statistical analysis
The mean value (x), Standard deviation (SD), coefficient of Varia- tion in percent (CV), skewness (S) and kurtosis (fc) were calculat- ed from individual duplicate analyses of each'blood constituent in blood samples l to 7 and in plasma samples.
Skewness (S) is defined äs S = -/, kurtosis (K) äs K= -£ - 3,s s where s is the variance, n\3 .and m4 the moment of order 3 or 4, respectively (14).
Components of variance were estimated via an analysis of var- iance in a three factorial design (animals x blood sample x du- plicate analysis) with interactions and single cells (14). They are expressed äs the percentage of the sum of single components of variance.
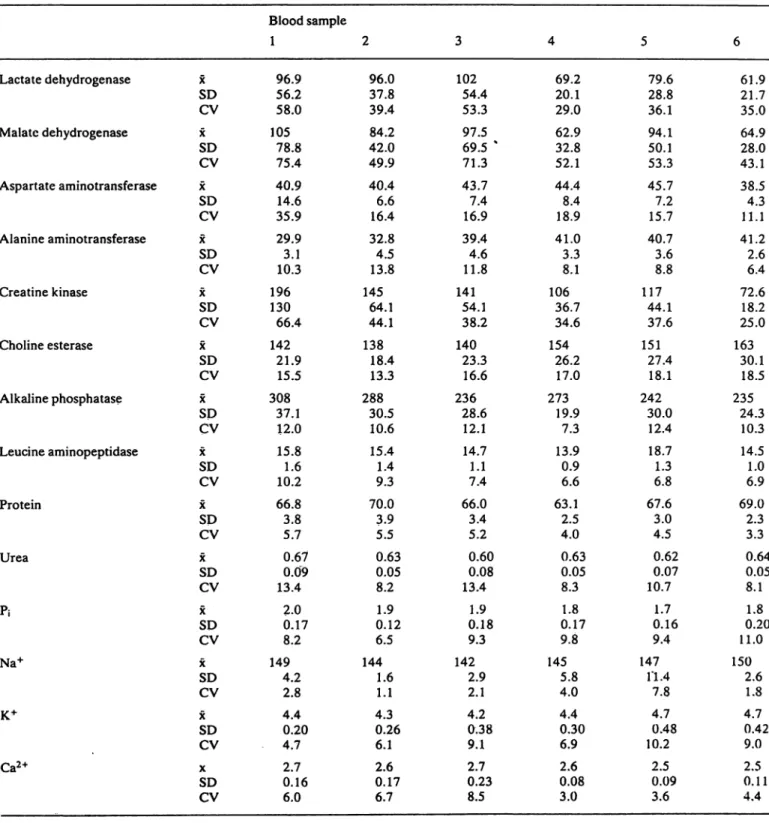
Difctinct differences exist for the plasma constituents between the particular blood samples l to 6, taken by heart puncture (tab. 1). Expressed äs coefficient of Variation (CV) the variance for each blood sample l to 6 is generally smaller than 10% for protein, Na+, K+, and Ca2+; about 10% to 20% for urea,
Tab. 1. Mean values (x), Standard deviation (SD) and coefficient of Variation in per cent (CV) of plasma constituents in rat during repeated blood drawings from 25 rats each (n = 25 individual duplicate analyses for each test and blood drawing time). Blood was taken by heart puncture.
Lactate dehydrogenase
Malaie dehydrogenase
Aspartate aminotransferase
Alanine aminotransferase
Creatine kinase
Choline esterase
Alkaline phosphatase
Leucine aminopeptidase
Protein
Urea
Pi
Na+
K*
Ca2+
xSD CV x SDCV xSD CV xSD CV xSD CV xSD CV xSD CV xSD CV xSD CV xSD CV xSD CV xSD CV xSD CV xSD CV
Blood sample 1
96.956.2 58.0 10578.8 75.4 40.9 35.914.6 29.93.1 10.3 196130
66.4 14221.9 15.5 30837.1 12.0 15.81.6 10.2 66.83.8
5.7 0.090.67 13.4
2.00.17 8.2 1494.2 2.8 4.40.20 4.7 2.70.16 6.0
2 96.037.8 39.4 42.084.2 49.9 40.46.6 16.4 32.84.5 13.8 14564.1 44.1 13818.4 13.3 28830.5 10.6 15.41.4
9.3 70.03.9 5.5 0.630.05 8.2 0.121.9 6.5 1441.6 1.1 4.30.26 6.1 0.172.6 6.7
3 10254.4
53.3 97.569.5 %
71.3 43.77.4 16.9 39.44.6 11.8 14154.1 38.2 14023.3 16.6 23628.6 12.1 14.71.1 7.4 66.03.4 5.2 0.60 13.40.08
0.181.9 9.3 1422.9 2.1 4.20.38 9.1 2.70.23 8.5
4 69.220.1 29.0 62.932.8 52.1 44.48.4 18.9 41.03.3 8.1 10636.7 34.6 15426.2 17.0 27319.9 7.3 13.90.9 6.6 63.12.5 4.0 0.630.05 8.3 0.171.8 9.8 1455.8 4.0 4.40.30 6.9 2.60.08 3.0
5 79.628.8 36.1 94.1 50.153.3 45.77.2 15.7 40.73.6 8.8 11744.1
37.6 15127.4 18.1 24230.0 12.4 18.71.3 6.8 67.63.0 4.5 0.620.07 10.7
0.161.7 9.4 147.4 7.8 4.70.48 10.2
2.50.09 3.6
6 61.921.7 35.0 64.9 28.043.1 38.54.3 11.1 41.22.6 6.4 72.618.2 25.0 16330.1 18.5 23524.3 10.3 14.51.0 6.9 69.02.3 3.3 0.050.64 8.1 0.201.8 11.0 1502.6 1.8 4.70.42 9.0 0.112.5 4.4
100 Lindena, Büttner and Trautschold: Components of variance of rat plasma constituents inorganic phosphate, alanine aminotransferase, al-
kaline phosphatase, leucine arylamidase and choline esterase; and up to 75% for lactate dehydrogenase, malate dehydrogenase, aspartate aminotransferase and creatine kinase. Alanine aminotransferase and choline esterase show a tendency to increase with the course of the experiment, while lactate dehydroge- nase, alkaline phosphatase and creatine kinase tend to decrease. Nearly the same classification in three groups concerning the magnitude of Variation of the respective plasma constituents holds true for the CV, calculated from all results from blood samples l to 6 (tab. 2). The markedly lower mean and variance of
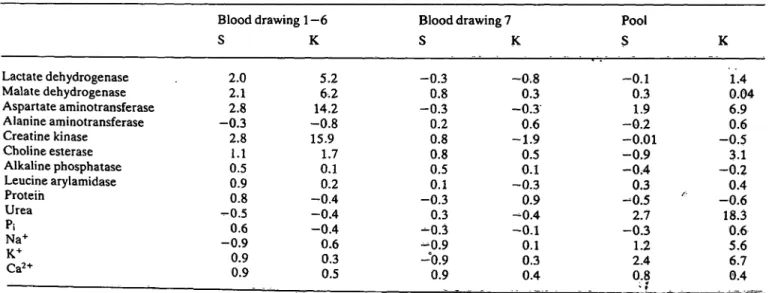
the 7th catheter blood sample is espectally striking for the celhilar enzymes lactate dehydrogenase, mal- ate dehydrogenase, aspartate aminotransferase and creatine kinase. Pool samples show a coefficient of Variation between 3 to 8% for enzyme catalytic ac- tivities and for pther plasma constituents. The values of the above mentioned gröup of cellular enzymes also reveal distinct deviations from the normal (Gaussian) distribution (tab. 3), äs evident from the high positive values for skewness i. e. a shift of the distribution curve to the right side, an observatiori which also holds true for the values of each single blood sample 1—6 (not shown in the tables). In the
Tab. 2. Mean values and Standard deviation (x ± SD) and coefficient of Variation in per cent (CV) of blood samples l to 6, of blood sample 7 and of plasma pool samples.
n = 150 for blood samples 1-6, taken by heart puncture; n = 25 for blood sample 7, taken by catheter technique; n = 165 for pool samples. Individual duplicate analyses for each test.
Enzyme catalytic activity concentrations in U/l; protein in g/l; all other values in mmol/l.
Blood samples 1—6
± SD CV Lactate dehydrogenase
Malate dehydrogenase Aspartate aminotransferase Alanine aminotransferase Creatine kinase
Choline esterase Alkaline phosphatase Leucine arylamidase Protein
UreaPi Na+
K+Ca2+
83.882.0 42.037.6 125149 26615.5
67.20.65 1471.9
4.52.1
±41.0
±53.1
± 8.9
± 5.7
±69.3
±25.7
±41.5
± 2.0
± 4.1
± 0.07
± 0.20
± 6.8
± 0.40
± 0.20
49.064.7 21.315.1 55.617.3 15.612.9 10.76.1 10.54.6 9.19.7
Blood sample 7 x ± S D
45.131.4 33.037.2 18772.5 24012.9
70.60.62 1431.7
4.02.5
± 8.1
± 7.3
± 2.8
± 4.0
±21±31.1
±28.4
± 1.3
± 7.0
± 0.06
± 0.14
± 8.5
± 0.35
± 0.13 CV 23.018.0 10.78.5 29.016.6 11.810.4 9.99.0 8.36.0 8.95.1
Pool x±SD 203141
4937 208146 212 .1.4
±±
±±
±
±± 16.6 ± 68.10.77
<· ,_2 1484 2 .2' .3.3
+
±±
±±
± 7.85.0 3.41.1 10.17.6 13.31.1 0.053.2 0.205.3 0.320.15
cv
3.93.6 6.93.0 5.24.9 6.36.2 4.66.8 8.33.6 7.56.6
Tab. 3. Skewness (S) and kurtosis (K) of blood samples l to 6, of blood sample 7 and of plasma pool samples.
n = 150 for blood samples 1-6, taken by heart puncture; n = 25 for blood sample 7, taken by catheter technique; n
pool samples. 165 for
Blood drawing 1—6 S K Lactate dehydrogenase
Malate dehydrogenase Aspartate aminotransferase Alanine aminotransferase Creatine kinase
Choline esterase Alkaline phosphatase Leucine arylamidase Protein
Urea P·.Na+
K+
Ca2+
2.02.1 -0.32.8
2.81.1 0.50.9 -0.50.8 -0.90.6
0.90.9
5.26.2 -0.814.2 15.91.7
0.10.2 -0.4-0.4 -0.40.6
0.50.3
Blood drawing 7 S K -0.30.8
-0.30.2 0.80.8 0.50.1 -0.30.3 -0.3-0.9 -0.90.9
-0.80.3 -0.30.6 -1.90.5 -0.30.1 -0.40.9 -0.10.1 0.30.4
Pool S -0.10.3 -0.21.9 -0.01 -0.9-0.4 -0.50.3 -0.32.7
2.41.2 0.8
K 0,04.4 6.90.6 -0.53.1 -0.20.4 -0.618.3 0.65.6 6.70.4
7th blood sample (taken by catheter), however, the distribution of plasma constituents was normal; with the exception of aspartate aminotransferase and urea, it resembled the distribution in the pool sam- ples.
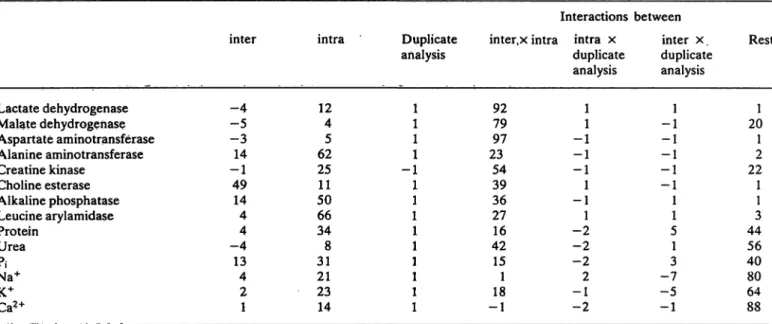
In weighing the several single components of var- iance in relation to the total variance, it is evident that the analytical component (i.e. the column: du- plicate analysis in tab. 4) contributes with negligible amount to the total variance, i.e. only 1%. For the enzymes lactate dehydrogenase, malate dehydroge- nase, aspartate aminotransferase and creatine ki- nase, which revealed high values for skewness and kurtosis, fairly high values for interactions between inter- and intra-individual components of variance can be observed. Protein, urea, inorganic phosphate and the minerals show high contributions for that part of variance, which cannot be attributed to the analytical- and the inter- and intraindividual portion (i. e. the column: rest). With the exception of choline esterase, the intra-individual component of variance is remarkably higher than the inter-individual amount.
1. Coefficient of Variation (CV) above 20% for the enzymes lactate dehydrogenase, malate dehydroge- nase, aspartate aminotransferase and creatine kinase (in the sequel called "critical enzymes").
2. CV from 10 to 20% for urea, phosphate and the enzymes alanine aminotransferase, choline esterase, alkaline phosphatase and leucine arylamidase.
3. CV less than 10% for protein, Na+, K+, and Ca2+. Ad l
Especially in striated and heart muscle these en- zymes are found with many fold higher catalytic ac- tivity compared to plasma (from l x l O3 to 2 x l O5
fold). Depending on the kind of blood drawing tech- nique, however, catalytic activity concentrations in plasma are artificially altered (15). Cannulation of an artery or vein is the most reliable method for blood sampling in experimental enzymology because only blunt minimal dissection of tissue is required.
With heart puncture, however, there is a great risk of aspirating minute amounts of disrupted muscle cells
Tab. 4. Components of variance in percent of the total variance (see table 2) for samples l to 6 taken by heart puncture.
inter = interindividual component, intra = intraindividual component, duplicate analysis = analytical component.
For further explanation see text under statistical methods.
Interactions between
Lactate dehydrogenase Malate dehydrogenase Aspartate aminotransferase Alanine aminotransferase Creatine kinase
Choline esterase Alkaline phosphatase Leucine arylamidase Protein
UreaPi Na+K+
Ca?+
inter
-4-5 -314 -149 144 -44 134 21
intra
124 625 2511 5066 348 3121 2314
Duplicate analysis
11 11 -11 11 11 11 11
inter.x intra
9279 2397
5439 3627 4216 151 -118
intra x duplicate analysis
11 -1-1 -11 -11 -2-2 -22 -1-2
inter x.
duplicate analysis -11
——
— ·—
51 -73 -5-1
Rest
201 21 221 31 4456 4080 6488
Deviation from 100% are cäused by rounded values; negative values by non-normal distributions.
Discussion
With respect to their magnitude of Variation, three major groups of plasma constituents can be distin- guished both from the values of blood samples 1—6 (tab. 2) and from the values of each of the individual blood samples (tab. 1):
through the inserted needle. Considering the catalyt- ic activity "gradients" between tissue and plasma, this would inevitably lead to falsely increased cata- lytic activity concentrations in plasma.
Our experimental design (6 blood drawings by heart puncture followed by the 7th blood drawing by cath-
102 Lindena, Büttner and Trautschold: Components of variance of rat plasma constituents
eter) was to isolate and estimate this experimentally induced component of variance, which could not be avoided for long-term monitoring of plasma constit- uents in small laboratory animals, due to the lack of a practicable long-term catheter technique. This component of variance therefore is induced by the experimenter and, in contrast to the analytical, intra- and interindividual components, it is not a randomly distributed quantity. As a consequence of the experi- mental procedure of heart puncture the catalytic ac- tivities of cellular enzymes in plasma, however, are falsely elevated. Falsely decreased catalytic activities can only be caused by a systematic analytical error which we can exclude äs a result of our internal quäl- ity control. Therefore the experimental procedure of heart puncture does not increase the variance by a decrease of the slope of the Gaussian curve, but by a shift of the distribution curve to the right side. This means that all experimental influences can only in- crease the catalytic activity concentrations in plasma, äs evident from positive skewness for these enzymes for blood samples 1—6, whereas the catheter blood sample, which is almost free from the experimentally induced variance, is normally distributed. It is evi- dent that blood sampling by heart puncture contrib- uted considerably more to the height of variance of the plasma constituents than did the biological and analytical components of variance. This may also ex- plain the high interactions between the inter- and in- tra-individual portions of variance.
In weighing the results of our precision estimates from plasma pool samples, it has to be stated, that the observed CV for lactate dehydrogenase, aspar- tate aminotransferase, alanine aminotransferase and creatine kinase of 3.9, 6.9, 3.0 and 5.2%, are much more lower than the recently developed 95% toler- ance limits for these enzymes with CV of 17.6, 22.0, 16.3 and 26.6 (16).
Looking through the recent literature concerning reference values for plasma constituents, including enzymes, in rat and other small laboratory animals, one has the feeling that almost nobody cares about the problems connected with uncontrolled sampling conditions and influences such äs preparation of the blood sample or choice of anaesthetic agents. At this point we have to discuss critically recent published data, which were obtained with comparable analyti- cal methods. An often used method of blood draw- ing is punction of the retroorbital plexus. Friedel et al. (15), however, demonstrated that beside contam- ination with interstitial fluid and damaged tissue, ob- struction of venous back flow caused the nonfiltrable plasma elements (e.g. proteins) to become more concentrated owing to the increased hydrostatic
pressure, a phenomenon which also holds true for tourniquet application in humans (8). In fact, espe- cially the catalytic activities of the "critical enzymes"
determined in plasma from retroorbital plexus are much to high (17—19). Blood from the tail vein (20) also seems unsuitable, because the Anormal" values are much higher than the values of catheter blood äs reference. The same holds true fof decapitation or cutting the A. carotis (21). Another severe error, which — alone or in combination with unsuitable sampling method (17, 21) - leads to errorieous re- sülts, in the use of serum instead of plasma. The cata- lytic activity concentrations of lactate dehydroge- nase, malate dehydrogenase and aspartate amino- transferase increase in serum with time during blood clotting. Enzymes are primarily released from pla- telets (22, 23). Recent published reference values for plasma constituents in other small laboratory animals (24, 25) should be ireevaluated in view of these consideration. Attention also should be paid to haemolysis, which is visible at haemoglobin concen- trations higher than 0.3 g/l and causes an approxi- mative rise for the following catalytic activity coneen- tration in rat plasma: lactate dehydrogenase 55 U/l, malate dehydrogenase 19 U/l, aspartate aminotrans- ferase 1.3 U/l, creatine kinase 1.3 U/l (26).
In most cases anaesthesia is unavoidable in order to draw sufficient amounts of blood. Ether or pento- barbital often caused tremendous motion of the animals. Physical exertion, however, leeds to nearly twenty fold acceleration of flow of muscular lymph which reaches the intraväscular compartment via the thoracic duct. Especially for the "critical enzymes"
their content in lymph far exceeds that of plasma (27, 28). This uncontrolled increase of lymphatic in- flow, in our opinion, is a main source of high varian- ces of these plasma catalytic activity concentrations.
After application of a combination of xylazine and ketamine, however, the animals quietly fall asleep.
One has to consider, however, that the handling procedure during application of the anaesthetic agent cause acute haemodynamic and metabolic stress responses in rats (29). For enzymes and pro- tein, however, only slight changes are demonstrated in the course of severe restraining procedures, at least in pigs and sheep (30, 31).
Ad 2
The enzymes alanine aminotransferase, choline este- rase, alkaline phosphatase and leucine arylamidase show a marked lower catalytic activity in heart and skeletal muscle (l x 10 to 3 x 10² fold higher com- pared to plasma) than the "criticäl enzymes".
Inadequate techniques for blood sampling which are accompanied by destruction of cells therefore con- tribute to a considerably reduced experimental com- ponent of variance. Differences between heart punc- ture and catheter samples become smaller. The in- crease of choline esterase - a so called plasma en- zyme which is synthesized in Hver — during the time course of the experiment may by explained by a compensatory increased synthetis, a phenomenon which is known for albumin and which is induced by protein loss due to blood drawing. The decrease of alkaline phosphatase over the time course may be explained by the age dependent bone growth which is accomplished mostly within 150 days of life span.
The decrease of leucine arylamidase is an empirical phenomenon during the life span of the rat (32).
This explains the higher contribution of the intrain- dividual component for the latter three enzymes. For the enzymes we investigated, however, diurnal changes of activity can be excluded (20).
Ad 3
The best homeostatic regulation in human and anim- al and also smallest inter-individual differences were found for parameters like K+, Ca2+, and protein which are important for the stability of composition and volume of the extracellular and intravascular fluid and are partly under precise hormonal control.
The high contribution of the intraindividual compo- nent can also be explained by age dependent altera- tions in plasma during the animal life span used in our investigation (17).
An estimation of the components of variance re- quires that the single components are additive, hom- ogenous and independent of the value of the mean.
In our data these main requirements are not com- pletely fulfilled in every case. The calculated values for the single components of variance in relation to the total variance for a distinct plasma constituent therefore are given äs approximate values.
The results are, however, helpful in selecting those plasma constituents, which can be meaningfully monitored in research with small laboratory animals.
Depending on the nature of the constituent, the most suitable technique for blood drawing and prepara- tion has to be chosen. One also has to take into ac- count the fact that parameters may alter in long term experiments, due to aging or the experimental de- sign. All thefce influences may virtually mask, neu- tralize or imitate certain effects in the analysis of constituents. For studies on enzyme catalytic activi- ties in plasma it is advisible to take blood only by the catheter technique and to avoid any blood coagula- tion.
Supported by the Deutsche Forschungsgemeinschaft, Sonderfor- schungsbereich 146, Versuchstierforschung.
References
1. Breuer, J. & Stamm, D. (1975) this J. 13, 517-522.
2. Williams, G. Z., Young, D. S., Stein, M. R. & Cotlove, E.
(1970) Clin. Chem. 76, 1016-1021.
3. Harris, E. K., Kanofsky, P., Shakarji, G. & Cotlove, E.
(1970) Clin. Chem. 76, 1022-1027.
4. Cotlove, E., Harris, E. K. & Williams, G. Z. (1970) Clin.
Chem. 16, 1928-1032.
5. Young, D., Harris, E. K. & Cotlove, E. (1971) Clin. Chem.
77, 403-410.
6. Statland, B. E., Winkel, P. & Bokelynd, H. (1973) Clin.
Chem. 79, 1374-1379.
7. Statland, B. E., Winkel, P. & Bokelund, H. (1973) Clin.
Chem. 79, 1380-1383.
8. Statland, B. E., Bokelund, H. & Winkel, P. (1974) Gin.
Chem. 20, 1513-1519,
9. Winkel, P., Statland, B. E. & Bokelund, H. (1974) Clin.
Chem. 20, 1520-1527.
10. Bokelund, H., Winkel, P. & Statland, B. E. (1974) Clin.
Chem. 20, 1507-1512.
11. GV-SOLAS (1983). Liste von Erregern zur Spezifizierung bei SPF^Versuchstieren., Veröffentlichungen der Gesell- schaft für Versuchstierkunde Nr. 2, Zürich.
12. Recommendations of the German Society for Clinical Chem- istry (1972, 1977) this J. 70, 281-291; 75, 249-254.
13. Chemnitz, G., Schmidt, E., Koller, P. U. & Bush, E. W.
(1979) Dtsch. Med. Wochenschr. 104, 257-260.
14. Weber, E. (1972) Grundriß der Biologischen Statistik, An- wendungen der mathematischen Statistik in Naturwissen- schaft und Technik. 7. Auflage, Fischer, Stuttgart.
15. Friedel, R., Trautschold, L, Gärtner, K., Helle-Feldmann, M.
& Gaudssuhn, D. (1975) this J. 73, 499-505.
16. Lohff, M. R., Disilvio, T. V., ROSS, J. W., Lawson, N. S. &
Gilmore, B. F. (1982) Am. J. Clin. Pathol. 78 (Supplement) 634-643.
17. Frölke, W., Guenard, J., Knapen, F., Weisse, J., Köllmer, H.
& Stötzer, H. (1974) Arzneimittel-Forschung (Drug Re- search) 24, 1262-1266.
18. Breuer, J. & Stucky, W. (1975) this J. 73, 355-360.
19. Keller, P. (1979) Kleintier Praxis 24, 51-68.
20. Dabew, D., Mahlberg, F. A. & Struck, H. (1976) this J. 14, 561-567.
21. Weigert, P. (1975) Z. Versuchstierk. 77, 204-207.
22. Friedel, R. & Mattenheimer, H. (1970) Clin. Chim. Acta 30, 37-46.
23. Friedel, R. & Mattenheimer, H. (1971) this J. 9, 103-106.
24. Fischer, B. (1980) Z. Versuchstierk. 22, 234-248, 25. Metzenauer, P. & Lutz, J. (1981) Z. Versuchstierk. 23, 94-
101.
104 Lindena, Büttner and Trautschold: Components of variance of rat plasma constituents 26. Lindena, J., Sommerfeld, U., Höpfel, C, Wolkersdorfer, R. 30. Bickhardt, K. & Wirtz, A. (1978) Dtsch. Tierärztl. Wochen-
& Trautschold, I. (1983) Enzyme 29, 229-238. sehr. 85, 457-462.
27. Lindena, J., Küpper, W., Friedel, R. & Trautschold, I. (1979) 31. Gohary, G. S. & Bickhardt, K. (1979) Dtsch, Tierärztl. Wp- Enzyme 24, 120-131. chenschr. 86, 225-228.
28. Lindena, J., Küpper, W. & Trautschold, I. (1982) this J. 20, 32. Lindena, J., Friedel, R., Rapp, K., Sommerfeld, U., Traut- 95-102. schold, I. & Deerberg, F. (1980) Mech. Ageing Develop 14, 29. Gärtner, K., Büttner, D., Döhler, K., Friedel, R., Lindena, J. 379-407.
& Trautschold, I. (1980) Lab. Anim. 14, .267-274. ' f
Joachim Lindena, DVM Abteilung Klinische Biochemie Medizinische Hochschule Hannover Konstanty-Gutschow-Straße 8 D-3000 Hannover 61