Eur J Clin Chem Clin Biochem 1997; 35(4):257-260 © 1997 by Walter de Gruyter · Berlin · New York
Biological Variation in Protein C, Protein S and Antithrombin Concentrations in Plasma of Healthy Subjects
Gianvico Melzi d'Erill, Adriano Anesi2, Vittoria Rizzo3
and Rosita Trotti
21
Laboratorio di Analisi, Ospedale di Circolo, Universit di Pavia, II Facolt di Medicina e Chirurgia, Varese, Italy
2
Laboratorio di Analisi Biochimico-Cliniche, Istituto Neurologico "C. Mondino", Universit di Pavia, Pavia, Italy
3
Istituto Neurologico "C. Mondino", Universit di Pavia, Pavia, Italy
Summary: The analytical, intra- and inter-individual components of biological variation were estimated for protein C, protein S and antithrombin over a period of 6 weeks in a cohort of 17 apparently healthy subjects. Expressed as percentage activity (protein C and antithrombin) and as percentage concentration in normal human plasma (protein S), the mean values for men and women show no significant differences (p > 0.05) for any of the analytes studied.
Calculated analytical goals (CV, %) for precision required for optimal patient care are: protein C, 2.9; protein S, 2.9 and antithrombin 2.7. A single numerical index, called "index of fiduciality", was also calculated to demonstrate that the analytical performance of our method was satisfactory. The generally applicable differences (% activity or
% concentration) required for two results to be significantly different (p ^ 0.05) were calculated as: protein C, 17;
protein S, 16 and antithrombin, 16. The usefulness of critical differences as guidelines for the interpretation of changes in serial results was investigated using an "index of heterogeneity" of intra-individual variation.
The marked degree of individuality demonstrated for all the quantities indicates that, if conventional population- based ranges are used uncritically, major changes in analyte concentration may not be correctly identified for some patients, because observed values continue to lie within the reference range. The utility of conventional population- based reference intervals was determined by calculating a single numerical index, called "index of individuality".
For protein C, protein S and antithrombin we found that five of a patient's specimens are required to achieve a 95% chance that the mean is within ± 5% of the true value.
Introduction six specimens from each subject over a period of Data on the biological variation of analyte concentra-
tions have many valuable uses in clinical chemistry (1),
including setting desirable performance standards for
Materials and Methodsimprecision (2), determining the true significance of
changes in serial results from a single patient (3) and
SubJ
ectsassessing the usefulness of conventional population- Seventeen apparently healthy hospital staff members (nine females based reference ranees (4) and eight men' ages 21 to 52 vears)' informed ab°ut the objective
° ^ '' of the study, were recruited. They were non-smokers, and had taken Although many data are available on the biological vari- no me?'f*οη '"the ^f Uf ^° ίΤ*5' ^ maintained *eir
β J & usual lifestyles throughout. None of the women was pregnant or ation of analytes in serum or plasma (5—7), the true using oral contraceptives,
biological variation of the three naturally occurring anti-
coagulant proteins, protein C, protein S and antithrom- Specimen collection and handling
bin (8-9), has not been investigated in depth. A previ- preparation of the subjects before blood coiiection was carefully ous Study on the biological variation of antithrombin has controlled, and blood collection was performed in standardized been reported (3), but in that article the discussion was conditions to minimize sources of preanalytical variation. After an ,. . , , . - J - - J 1 ·· j · · ι i-r- overnight fast, a blood specimen was taken with minimal venous limited to the mtra-mdividual variation and critical dif- Occlusion5 between 8 ^ 10 a. m. to avoid the influence of circa- ference. dian variation on the plasma concentrations of the studied quanti-
ties. Six consecutive blood samples were taken weekly from each Since the values of these quantities are widely used in subject. All samples were drawn by the same phlebotomist from clinical decision making, we believe that their biological subjects in a supine position. The first 4 ml were discarded, and . . ι υ ι · j venous blood was then sampled into evacuated tubes containing variation should be examined. 129 mmol/1 ^souum citrate (Venoject VT-050SCBS, Terumo- ,,r Al ,, j ι · ι · ι · ι · · · Europe, Leuven, Belgium). Plasma was obtained by centrifugation We therefore assessed their biological variation m a (2000gj ^ 4 oc for 10 min) ^ stored at _80 oc ^ ^^
cohort of 17 apparently healthy subjects, collecting At the end of 6 weeks, all frozen samples were transferred into a
258
Melzi d'Eril et al.: Biological variability of protein C, protein S and antithrombinwater bath at 37 °C for 15 minutes and then handled at room tem- perature.
Analytical techniques
The analytical protocol was designed to minimize analytical vari- ance both within and between batches of analyses. Each set of specimens from an individual was assayed in duplicate, in no spe- cific sequence, within the same analytical batch. Single lots of rea- gents, standards and quality-control materials were used throughout, and analyses were performed by a single operator. Comparability between runs was ensured by rigorous quality control. The activi- ties of protein C and antithrombin were measured on a Hitachi 911 analyzer using a synthetic chromogenic substrate (antithrombin and Stachrom protein C, Boehringer Mannheim, Mannheim, Germany), while quantitative determination of protein S concentration was performed using a microlatex particle-mediated immunoassay (Liatest protein S, Boehringer Mannheim, Mannheim, Germany).
Statistical analysis of data
The detailed approach advocated by Fräser & Harris (1) was fol- lowed. After exclusion of outliers, nested analysis of variance (AN- OVA) was applied. The total variance was divided into the compo- nents attributable to analytical, intra- and inter-individual variation.
Since, in assay procedures, quality control materials may not be- have in the same way as specimens from patients (10), we calcu- lated analytical variance from the results of duplicate analyses of each specimen. We used only the first of each duplicate result to calculate the average intra-individual variance and the inter-indivi- dual variance. Student's unpaired t-test was used to assess whether the means for men and women were different.
Results and Discussion Analytical results
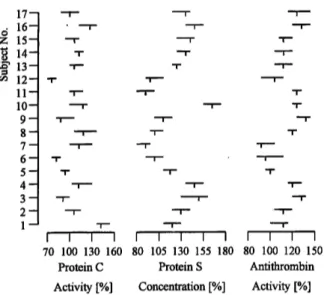
The mean values for men and women showed no signifi- cant difference (p < 0.05) for each of the analytes studied (fig. 1). The data generated were therefore treated as a single set of data.
Table 1 shows the mean values and estimated analytical (CVA), intra- (CVG) and inter-individual (CVI) varia- tion as coefficients of variation of protein C, and antithrombin percentage activity and protein S percen- tage concentration in normal human plasma.
1716~ 15- 14- 13-12- 11-10- 9-8- 7-6- 5-4- 3-2-
1- I I I I
70 100 130 160 Protein C
I I I I I I I I I 80 105 130 155 180 80 100 120 150
Protein S Antithrombin Activity [%] Concentration [%] Activity [%]
Fig. 1 Means and ranges for protein C, protein S and antithrom- bin in sera from 17 healthy subjects. 1 — 8: male; 9—17: female.
The data in the table 1 were used to:
— derive analytical goals for each quantity analysed,
— determine the changes required in serial results, termed critical difference (3), before significance can be claimed,
— assess the usefulness of conventional population- based reference values,
— estimate the number of specimens required to pro- duce a more precise estimate of the homeostatic set point of an individual.
Analytical goals
Stipulated standards of performance are necessary for the objective analysis of the data generated during the analytical investigation. It is widely accepted that ana- lytical goals, the standards of analytical performance re- quired to provide optimal patient care, are best derived from data on biological variation (11). Goals for im- precision were derived as 1/2CVI (2). The goals for im- precision for all quantities were met in this study, as shown in table 2.
A single numerical index, called "index of fiduciality", was also suggested to demonstrate whether a method met the analytical goals or not (12). It is calculated as the total analytical error achieved (CVA) divided by the analytical goal. If this index is < 1, then the analytical goal is met. The calculated indices of fiduciality, de-
Tab. 1 Mean values, and estimated average analytical (CVA), in- tra-individual (CVI) and inter-individual (CVG) variation in heal- thy subjects for protein C, protein S and antithrombin.
Analyte Mean3 CVA CVI CVG
Protein C Protein S Antithrombin
106.8 117.6 119.1
2.1 2.01.8
5.85.8 5.5
55.2 25.263.4
a Mean values are expressed as percentage activity for protein C and antithrombin and percentage concentration in normal human plasma for protein S.
Tab. 2 Estimated indices of individuality, heterogeneity, fiducial- ity, analytical goals for precision, critical differences between serial results and required numbers of specimen collections to produce a more precise estimate of the homeostatic set point in healthy sub- jects for protein C, protein S and antithrombin.
Protein C Protein S Index of individuality
Index of heterogenity Index of fiduciality Analytical goal, CV (%) Critial difference (%) No. of specimens required
0.10.65 0.72 2.9 175.8
0.10.64 0.682.9 165.7
Anti- thrombin
0.20.64 0.662.7 165.1
Melzi d'Eril et al.: Biological variability of protein C, protein S and antithrombin 259
tailed in table 2, provide evidence that the analytical performance of our method was satisfactory.
Critical difference
The results of biochemical tests are often used in moni- toring patients. It is therefore important to know the magnitude of the changes in serial results from an indi- vidual that amount to statistically significant differences.
Such changes may be due not only to improvement or deterioration of the patient but also to analytical im- precision and intra-individual biological variation.
Therefore, for a change to be significant, it must exceed the critical difference, which can be defined as the total variation required in serial results from an individual before significance can be claimed. For p < 0.05 the critical difference can be calculated as 2.77(CVA
2+ CVI
2)
1/2(3). The calculated critical differences for protein C, protein S and antithrombin are listed in table 2.
Use of the average CVI to calculate critical differences is truly valid only if all subjects have the same CVI.
This was investigated using an "index of heterogeneity"
of intra-individual variation. This index is defined as the ratio of the observed CV of a set of individual variances (CVA
2+ CVI
2)
172to the theoretical CV if no hetero- geneity existed, namely [2/(n—1)]
1/2, where n is the average number of observations per subject (13). If there were no heterogeneity of intra-individual variances, this ratio would be 1.00. When the index differs from unity by more than 2 SD, defined by 2/(2n)
1/2, then significant heterogeneity exists. The calculated indices of hetero- geneity for the analytes investigated are described in ta- ble 2. Since no index exceeds 1.00 by more than 2 SD, we believe that the critical differences detailed here are useful in clinical practice as guidelines in the interpreta- tion of changes in serial results.
Our data on the critical difference and the CVI of antithrombin monitored over a six weeks period appear to be of the same order as those observed over six months by Costongs et al. (i.e., critical difference, 19.6%; CVI, 6.6%) (3). In Costongs' work the intra- individual variations and the critical differences of 9 co- agulation quantities were investigated during short-term (within-one-day) and long-term (six months) periods.
The antithrombin long-term CVI was found to be much smaller than the short-term one (16.3%), highlighting the fact that variations over the day should therefore be interpreted carefully.
Usefulness of conventional population-based reference values
Reference intervals are of particular importance when a test is used for screening or in making an initial diagno- sis, when no previous data are available on an indivi-
dual. The dispersion of conventional reference intervals is due to a composite of analytical, intra- and inter-indi- vidual variation. Conventional population-based refer- ence values are of use only when the intra-individual variability exceeds the inter-individual variability. The ratio of the intra- to inter-individual biological variation, known as the "index of individuality" provides informa- tion on the utility of conventional population-based ref- erence intervals (14). When this index is less than 0.6, reference values are of limited utility, but when it is more than 1.4, such values are of considerable use. Table 2 shows the indices of individuality for protein C, pro- tein S and antithrombin. For all the quantities, the index is < 0.6. This high degree of individuality means that subjects could have values that are very unusual for them but still lie within the conventional reference in- terval. Thus, the analytes examined in this study, al- though commonly assayed in clinical chemistry laboratories, will be of little use in the diagnosis of early or latent disease, or as general population-screening tests.
Number of specimens required
Since many analytes show considerable intra-individual variation, analyses of multiple specimens will produce a more precise estimate of the homeostatic set point. The required number of specimen collections needed to esti- mate the mean to within a desired precision, may be calculated from a rearrangement of the usual formula for the standard error of the mean:
n = [Z(CVA
2+ CVI
2)
1/2/D]
2,
where n is the number of specimens required, Z the number of standard deviates required for a stated prob- ability under the normal curve, and D is the desired per- centage closeness to the homeostatic set point (1).
For protein C, protein S and antithrombin we found that five of a patient's specimens are required to achieve a 95% chance that the mean is within ± 5% of the true value.
Conclusions
Data on analytical, intra- and inter-individual variation support the following conclusion:
- analytical goals derived from data on biological variation for protein C, protein S and antithrombin indicate that the standard of analytical performance achieved at present may be adequate for ideal pa- tient care;
— the intra-individual variation exhibited by protein C,
protein S and antithrombin means that, even when ana-
lytical goals for precision are met, relatively large differ-
ences (i.e., 16—17%) between sequential results are re-
260
Melzi d'Eril et al.: Biological variability of protein C, protein S and antithrombinquired before two values can be said to be significantly different;
— population-based reference ranges are of limited value for the interpretation of results of measurements of protein C, protein S and antithrombin, because of the high degree of individuality for these quantities in plasma. Thus assays for protein C, protein S and
antithrombin in plasma are likely to be useful in moni- toring individuals but not in detecting disease with the desired nosological sensitivity.
- five specimens should be collected for protein C, protein S and antithrombin to estimate the homeostatic set point of an individual.
References
1. Fräser CG, Harris . Generation of data on biological varia- tion in clinical chemistry. Crit Rev Clin Lab Sei 1989;
27:409-37.
2. Harris EK. Statistical principles underlying analytic goal-set- ting in clinical chemistry. Am J Clin Pathol 1979; 72:374-82.
3. Costongs GMPJ, Bas BM, Janson PCW. Short-term and long- term intra-individual variations and critical differences of co- agulation parameters. J Clin Chem Clin Biochem 1985;
23:405-10.
4. Harris EK. Effects of intra- and inter-individual variation on the appropriate use of normal ranges. Clin Chem 1974;
30:1535-42.
5. Ross JW. Evaluation of precision. In: Werner M, editor. Hand- book of clinical chemistry, Vol. 1. Boca Raton, FL: CRC Press, 1982:391-422.
6. Fräser CG. The application of theoretical goals based on bio- logical variation in proficiency testing. Arch Pathol Lab Med 1988; 112:404-15.
7. Fräser CG. Biological variation in clinical chemistry. An up- date: collated data, 1988-1991. Acta Pathol Lab Med 1992;
116:916-23.
8. Bertina RM. Prevalence of hereditary thrombophilia and the identification of genetic risk factors. Fibrinolysis 1988; 2:7.
9. High KA. Antithrombin III, protein C, and protein S. Arch Pathol Lab Med 1988; 112:28-36.
10. Fräser CG, Peake MJ. Problems associated with clinical chem- istry quality control materials. Crit Rev Clin Lab Sei 1980;
12:59-86.
11. Fräser CG. Desirable performance standards for clinical chem- istry. Adv Clin Chem 1983; 23:299-339.
12. Fräser CG, Browning MCK. The "index of fiduciality" pro- posed for use in evaluation and comparison of methods. Clin Chem 1988; 34:1356-7.
13. Harris EK. Distinguishing physiologic variation from analytic variation. J Chron Dis 1970; 23:469-80.
14. Harris EK. Statistical aspects of reference values in clinical pathology. Prog Clin Pathol 1981; 8:45-66.
Received October 2, 1996/January 3, 1997
Corresponding author: Adriano Anesi, Laboratorio di Analisi, Ospedale Civile, via Depretis, 95, 1-27049 Stradella (PV), Italy Fax: +39-385-582285