Journal of
Clinical Medicine
Article
Linezolid Concentrations in Plasma
and Subcutaneous Tissue are Reduced in Obese
Patients, Resulting in a Higher Risk of Underdosing in Critically Ill Patients: A Controlled Clinical
Pharmacokinetic Study
Philipp Simon
1,2,*
,†, David Busse
3,4,†, David Petroff
2,5, Christoph Dorn
6,
Lisa Ehmann
3,4, Sophie Hochstädt
1, Felix Girrbach
1, Arne Dietrich
2,7, Markus Zeitlinger
8, Frieder Kees
9, Charlotte Kloft
3,†and Hermann Wrigge
1,2,10,†1
Department of Anaesthesiology and Intensive Care, University of Leipzig Medical Centre, 04103 Leipzig, Germany; sophie.hochstaedt@googlemail.com (S.H.);
felixfrederic.girrbach@medizin.uni-leipzig.de (F.G.); hermann.wrigge@bergmannstrost.de (H.W.)
2
Integrated Research and Treatment Centre (IFB) Adiposity Diseases, University of Leipzig, 04103 Leipzig, Germany; david.petroff@zks.uni-leipzig.de (D.P.);
arne.dietrich@medizin.uni-leipzig.de (A.D.)
3
Department of Clinical Pharmacy and Biochemistry, Institute of Pharmacy, Freie Universitaet Berlin, 12169 Berlin, Germany; david.busse@fu-berlin.de (D.B.); lisa.ehmann@fu-berlin.de (L.E.);
charlotte.kloft@fu-berlin.de (C.K.)
4
Graduate Research Training program PharMetrX, 12169 Berlin, Germany
5
Clinical Trial Centre Leipzig, University of Leipzig, 04107 Leipzig, Germany
6
Institute of Pharmacy, University of Regensburg, 93053 Regensburg, Germany;
christoph.dorn@chemie.uni-regensburg.de
7
Department of Visceral, Transplant, Thoracic and Vascular Surgery, Division of Bariatric and Metabolic Surgery, University of Leipzig Medical Centre, 04103 Leipzig, Germany
8
Department of Clinical Pharmacology, Medical University of Vienna, 1090 Vienna, Austria;
markus.zeitlinger@meduniwien.ac.at
9
Department of Pharmacology, University of Regensburg, 93053 Regensburg, Germany; frieder.kees@web.de
10
Department of Anaesthesiology, Intensive Care and Emergency Medicine, Pain Therapy, Bergmannstrost Hospital Halle, 06112 Halle, Germany
*
Correspondence: arbeit.simon@gmail.com; Tel.:
+49-341-97-17700†
These authors contributed equally to the work.
Received: 1 March 2020; Accepted: 7 April 2020; Published: 9 April 2020
Abstract: Background: Linezolid is used for the treatment of soft tissue infections in critically ill patients. However, data for characterizing the pharmacokinetics (PK) and assessing whether effective concentrations are reached at the target site are lacking. We hypothesized that current dosing regimens do not lead to effective concentrations in the plasma and interstitial fluid (ISF) of subcutaneous tissue in obese patients. Methods: As a controlled clinical model, critically ill obese and non-obese patients undergoing intra-abdominal surgery received 600 mg linezolid as a single infusion. Concentrations in the plasma and microdialysate from the ISF of subcutaneous tissue were determined up to 8 h after dosing. Pharmacokinetic analysis was performed by non-compartmental methods. As a therapeutic target, we used f AUC/MIC > 80. Results: Fifteen obese (BMI: 48.7 ± 11.2 kg/m
2) and 15 non-obese (23.9 ± 2.1 kg/m
2) patients were analyzed. AUC
0–8in ISF decreased by − 1.69 mg*h/L (95% CI: − 2.59 to − 0.79, p < 0.001) for every 10 kg increase in weight. PK in obese patients were characterized by lower maximal plasma concentrations (median 3.8 vs. 8.3 mg/L, p < 0.001) and a higher volume of distribution (41.0 vs. 30.8 L, p < 0.001), and the therapeutic target was not reached for MIC ≥ 1 mg/L in ISF and ≥ 2 mg/L in plasma. Conclusions: Increasing the weight led to a decrease of
J. Clin. Med.2020,9, 1067; doi:10.3390/jcm9041067 www.mdpi.com/journal/jcm
J. Clin. Med.2020,9, 1067 2 of 14
linezolid concentrations in the plasma and subcutaneous tissue. The current dosing regimen does not seem to produce sufficient concentrations to kill bacteria with MIC ≥ 2 mg/L, especially as empirical antimicrobial therapy in critically ill obese patients.
Keywords: antibiotic dosing; concentrations; linezolid; microdialysis; obesity; pharmacokinetics;
soft tissue
1. Introduction
Linezolid is used for the treatment of complicated skin and soft tissue infections with methicillin-resistant Staphylococcus aureus [1–3] and for toxic shock syndrome [4], and has become an important treatment option in empirical antimicrobial therapy in intensive care medicine, e.g., recommended in German guidelines for septic shock with a risk of methicillin-resistant Staphylococcus aureus (MRSA) infection [5]. In addition, linezolid is a frequently used antibiotic for the treatment of vancomycin-resistant Enterococcus (VRE), which is increasingly triggering serious infections in critically ill patients. For the success of an anti-infective therapy, as well as the prevention of the development of resistance, choices related to the right antibiotic, the duration of therapy, and the correct dosing regimen play a decisive role. Effective therapy requires sufficiently high antibiotic concentrations for a sufficient time period at the target site. Recent studies suggest that the current standard dosing regimen of 600 mg twice daily is insufficient for pathogens [6,7] such as MRSA [8]. Therefore, a discussion on the optimal dosing regimen for linezolid is currently underway [8–10]. Studies almost always use plasma concentrations as the basis for their analyses. However, target concentrations should not only include plasma, but above all, the site of bacterial infection, which is often the interstitial fluid (ISF) of the target tissue [11–13].
Obesity is widespread and is exhibiting an increasing incidence worldwide [14]. It is considered a risk factor for acquiring severe infections and the obese population has particularly severe problems once infections are acquired [15]. Therefore, adequate antibiotic therapy with sufficient effective concentrations is particularly important for obese patients. However, guideline recommendations for linezolid suggest weight-independent dosing [16]. The plasma volume does not differ between non-obese and obese patients nearly as much as the volume of soft tissue [17]. Given the similar plasma volumes, the dependence on the weight of plasma exposure cannot be expected to be as large as that for the ISF, i.e., for the target site. Only a few studies with a limited number of patients have focused on target site concentrations of linezolid, but without including obese patients [6,18–21] and without investigating the influence of obesity compared to a non-obese control group [22,23]. Consequently, there is a lack of data for characterizing the pharmacokinetics (PK) in this population and assessing whether effective linezolid concentrations are reached.
We hypothesized that the approved dosing regimen for linezolid does not lead to effective concentrations in the plasma and ISF of subcutaneous adipose tissue (one possible target site) in morbidly obese patients. To approach the problem with a clinically feasible model suitable for intensive care, but free from numerous influences, we accrued obese and non-obese patients undergoing elective abdominal surgery in a controlled setting and measured the free linezolid concentrations in soft tissue by microdialysis.
2. Materials and Methods
Patients were recruited for this prospective, parallel group, open-label, controlled single-center
trial as part of a larger pharmacokinetic study at Leipzig University Hospital (German trial register
number: DRKS00004776, www.who.int/ictrp/network/drks2/en/). Approval for the trial was granted
by the Leipzig University ethics committee (121/13-ff) and the Federal Institute for Drugs and Medical
Devices of Germany (BfArM), and was registered in the European Union clinical trials register (EudraCT
J. Clin. Med.2020,9, 1067 3 of 14
number 2012-004383-22). All patients gave written informed consent prior to inclusion. After taking dropouts into account, a sample size of 15 per group was determined for the primary endpoint to find a correlation coefficient between the area under the concentration–time curve and weight of 0.52 with a power of 80%. The expectation for the correlation coefficient was taken from data presented in publications along with simulation studies [11,12]. Further details on the methods, design, and sample size calculations have previously been described in detail, including a CONSORT diagram for the whole study [24].
2.1. Study Population
Patients scheduled for elective abdominal surgery at Leipzig University Hospital were screened for eligibility. Inclusion criteria comprised age ≥ 18 years and body mass index (BMI) ≥ 35 kg/m
2for obese patients or between 18.5 and 30 kg/m
2for non-obese patients. The non-obese patients were matched based on age (within five years) and sex, depending on the availability of sequentially encountered patients [24]. The main exclusion criteria were pregnancy or breastfeeding, a known allergic reaction to one of the investigated medications, and severe liver or severe kidney disease.
2.2. Intervention
Anesthesia was performed according to clinical standards and at the discretion of the anesthetist.
The local clinical standard included either balanced anesthesia with propofol and sufentanil or remifentanil followed by desflurane/isoflurane, or total intravenous anesthesia. All patients received an infusion of crystalloid fluid, with or without additional vasopressors such as theodrenaline/cafedrine and/or norepinephrine, as required, to assure a mean arterial pressure > 60 mmHg. All patients received 1000 mg prophylaxis meropenem as a perioperative antibiotic and 600 mg linezolid as a clinical model, administered with a single 30 min infusion after the induction of anesthesia (60–30 min prior to incision) through an additional vein access procedure.
2.3. Blood and Microdialysate Samples
Two microdialysis catheters were placed in the interstitial fluid of subcutaneous adipose tissue of both upper arms (one in each arm) after skin disinfection and under sterile conditions, without using local anesthesia, ensuring that the complete length was subcutaneous, but without using ultrasound for the detection of anatomical landmarks. The catheters were placed 90 min before beginning anesthesia and the administration of the study drugs. The catheters were perfused with 0.9% saline at 2 µ L/min.
After equilibration (30 min), microdialysate was collected for 1 h and a baseline blood sample was taken.
Additional blood samples were taken at 0.5 (end of infusion), 1, 2, 3, 4, 5, 6, and 8 h. Microdialysate samples were collected from 0–0.5, 0.5–1, 1–1.5, 1.5–2, 2–3, 3–4, 4–5, 5–6, 6–7, and 7–8 h [24]. The choice to sample for 8 h was based on a compromise between minimizing the burden to the patient, practicability, and ensuring rich sampling for various substances with different half-lives from a more extensive protocol (linezolid, meropenem, tigecycline, cefazolin, metronidazole, and piperacillin).
Blood samples were centrifuged within 30 min of sampling (3000 g, 4
◦C, 10 min). Plasma and microdialysate samples were frozen immediately at − 25
◦C and then stored at − 80
◦C until analysis.
2.4. Microdialysis
Microdialysis was performed at a constant flow rate of 2 µL/min. To obtain the drug concentration in the ISF from microdialysate concentrations (C
µD), the retrodialysis method was used [24,25].
Retroperfusate (C
RP) and retrodialysate (C
RD) drug concentrations were utilized to determine the in vivo relative recovery as follows: Relative recovery = (1 – C
RD/C
RP) × 100%. The concentration of the drug in the ISF was then given by C
ISF= C
µD× 100/relative recovery [24]. Due to the constant perfusate flow through the catheter and hence incomplete equilibrium at the membrane, only a fraction of the actual ISF drug concentration will be ‘recovered’ in the microdialysate, which is referred to as
‘relative recovery’ [26].
J. Clin. Med.2020,9, 1067 4 of 14
2.5. Study Visits and Data Collection
Patients were visited preoperatively, intraoperatively, and daily between postoperative day 1 and 7 or until discharge, as described in the visit schedule described elsewhere [24]. Study data were collected and managed using an Oracle-DBMS database with eResearch Network. Electronic data capture tools were employed at the Clinical Trials Centre of the University of Leipzig, Germany.
2.6. Drug Analysis
Linezolid was determined by a validated HPLC-UV method, as described previously [26,27].
Sample treatment for the determination of total linezolid included the deproteinization of plasma with perchloric acid, and microdialysate was directly injected into the column. The linearity of the method has been proven from 0.1 to 100 mg/L for plasma and from 0.1 to 300 mg/L for saline. Saline was used as a surrogate for microdialysate, as enough blank microdialysate was not available and a matrix effect is not observed when HPLC-UV is used. The coefficients of linear correlation (plasma/saline) were > 0.990/0.9991, the coefficients of variation for inter- and intra-assay precision (plasma/saline) at the lower limit of quantification (LLOQ) as determined by back-calculation were < 3%/< 1%, and the accuracy was 102.6%/100.7%, respectively. Based on in-process quality control (QC) samples, the intra- and inter-assay coefficient of variation and the in-accuracy (bias) was < 3%. Free linezolid in plasma was determined after ultrafiltration. The ultrafiltrate was injected directly [27]. The accuracy for free linezolid cannot be specified, as the protein binding in a particular plasma sample is not known.
As the intra-assay variation was as low as 1% in preliminary experiments, QC samples (pooled plasma of healthy subjects spiked with 20, 4 or 0.8 mg/L linezolid) were analysed with each assay as single determinations. The unbound fraction in the QC samples (protein binding of linezolid is independent of the concentration) was 78.2 ± 2.0% (CV 2.6%).
2.7. Study Endpoints
The primary endpoint was the dependence of the area under the concentration–time curve from 0 to 8 h (AUC
0–8) in the ISF on weight. Secondary outcomes were the weight dependence of the AUC
0–8in plasma (AUC
plasma), and the weight dependence of the linezolid maximum concentration (C
max), half-life (t
1/2), clearance (CL), volume of distribution (V) at a steady state (V
ss), and AUC
ISF/AUC
plasma. We used the currently recommended target daily AUC of unbound concentrations divided by a minimum inhibitory concentration (f AUC
24/MIC) > 80 [28,29] for an exploratory analysis and selected different relevant MIC values for linezolid (0.5–4 mg/L), with 4 mg/L defined as the linezolid-susceptible breakpoint for most Gram-positive isolates, including multiresistant pathogens [30]. As noted in [24], some endpoints foreseen in the protocol, such as wound infections, were not informative in our context and were thus only presented through summary statistics.
2.8. Pharmacokinetic and Statistical Analysis
ISF and plasma concentrations were analysed on a logarithmic scale and data from the two catheters were averaged. Non-compartmental pharmacokinetic analysis (NCA) was carried out using Phoenix WinNonlin 8.1 (Certara, Princeton, NJ, USA). The elimination rate constant λ
zwas determined by log-linear regression in the elimination phase, which required at least three data points per patient and typically began by 4 h (plasma) or 4.5 h (ISF). The linear-up/log-down trapezoidal rule was used for the calculation of AUC. The extrapolation of AUC to infinity (AUC
∞) was based on the last predicted concentration and the elimination constant (k
el). The AUC for a daily dose of 1200 mg linezolid was calculated as AUC
24= 2 × AUC
∞after 600 mg linezolid, as determined in the present study.
The estimation of AUC
24allowed us to relate our findings to the established target, f AUC
24/MIC > 80,
as mentioned above. The total body clearance (CL) and volume of distribution at a steady state
(V
ss) were calculated from plasma data. V
sswas found to be the product of the mean resistance
J. Clin. Med.2020,9, 1067 5 of 14
time (MRT) with the CL. MRT is the ratio of the area under the first moment curve divided by AUC, both extrapolated to infinity, minus half the infusion time.
For evaluating the dependence of AUC on weight and other demographic data, linear models with AUC as the dependent variable and the covariates sex and weight or BMI were analysed using the software R (version 3.6.0, Vienna, Austria). A model containing both weight and BMI was not considered because of co-linearity. Pearson’s correlation was estimated, but robust methods were used in the presence of outliers [31,32], and Fisher’s Z transform was used for the confidence interval.
Linear mixed-models were used for longitudinal data for each catheter separately with a random effects term allowing an intercept and slope for each patient. The obesity status, catheter, and time were taken as fixed effects, along with a term for the interaction between obesity status and time. Values are reported as the mean ± standard deviation or median (interquartile range). Tests were always two-sided and p-values < 0.05 were considered statistically significant.
3. Results
3.1. Participants
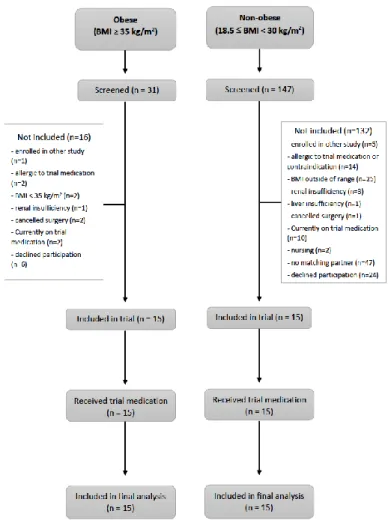
Patients were enrolled from December 2013 until March 2016. The patient flow (Figure 1—CONSORT flow diagram) demonstrates that all patients that underwent surgery were included in the analysis. Table 1 presents the patient characteristics. Non-obese patients were prospectively matched by sex and age ( ± five years). All patients in the obese group underwent bariatric surgery. In the non-obese group, 11 patients underwent gynecological operations, and the remaining four operations involved the stomach, liver, kidneys, and appendix.
J. Clin. Med. 2020, 9, x 5 of 15
J. Clin. Med. 2020, 9, x; doi: www.mdpi.com/journal/jcm
median (interquartile range). Tests were always two-sided and p-values < 0.05 were considered statistically significant.
3. Results
3.1. Participants
Patients were enrolled from December 2013 until March 2016. The patient flow (Figure 1—CONSORT flow diagram) demonstrates that all patients that underwent surgery were included in the analysis. Table 1 presents the patient characteristics. Non-obese patients were prospectively matched by sex and age (± five years). All patients in the obese group underwent bariatric surgery. In the non-obese group, 11 patients underwent gynecological operations, and the remaining four operations involved the stomach, liver, kidneys, and appendix.
Figure 1. Flowchart of enrolment and outcomes. BMI = body mass index.
Figure 1.
Flowchart of enrolment and outcomes. BMI
=body mass index.
J. Clin. Med.2020,9, 1067 6 of 14
Table 1.
Patient characteristics. Entries are the mean
±standard deviation or numbers (%). BMI
=body mass index.
Obese (n=15) Non-Obese (n=15)
Number of females (n (%)) 13 (87%) 13 (87%)
Age (years) 50.3
±9.5 49.5
±10.0
Weight (kg) 134.3
±34.3 67.9
±8.8
Height (m) 1.66
±0.07 1.68
±0.07
BMI (kg/m
2) 48.7
±11.2 23.9
±2.1
Creatinine (µmol/L) 86.4
±27.2 75.3
±18.9 Type of surgery (n (%))
laparoscopic 15 (100%) 3 (20%)
open 0 (0%) 12 (80%)
ASA classification (n (%))
I 1 2
II 4 11
III 10 2
3.2. Primary (ISF) and Secondary Study Endpoint (Plasma): Correlation of AUC
0–8with Weight
Plasma and interstitial fluid data were available from all patients, though in one patient, one of the two catheters slipped out and could not be analysed. The median (interquartile range (IQR)) value for relative recovery in ISF was 48% (34%, 58%). The AUC
0–8in the ISF changed by − 1.69 mg*h/L (95%
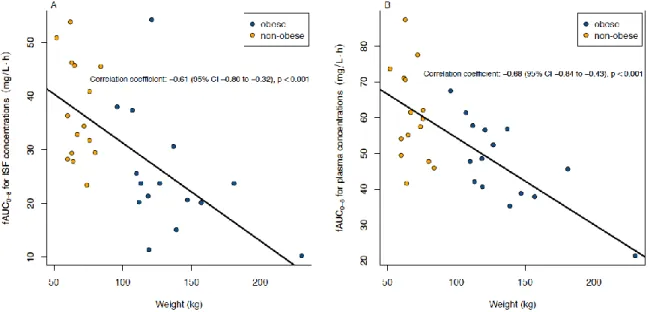
CI: − 2.59 to − 0.79, p < 0.001) for every 10 kg increase in weight and had a correlation coefficient of − 0.61 (95% CI: − 0.80 to − 0.32, p < 0.001) (see Figure 2A). In the sensitivity analysis, the extreme value from a patient with a weight of 230 kg was removed and the correlation coefficient became − 0.54, p = 0.002.
The free concentrations in plasma had a median (IQR) of 86% (84%, 88%) of the total concentrations.
In plasma, f AUC
0-8changed by − 2.2 mg*h/L (95% CI: − 3.1 to − 1.2, p < 0.001) for every 10 kg increase in weight and the correlation coefficient was − 0.68 (95% CI: − 0.84 to − 0.43, p < 0.001) (Figure 2B).
Correlations between AUC
0-8and BMI were very similar to those with weight and were − 0.60 (95% CI:
− 0.79 to − 0.31, p < 0.001) and − 0.64 (95% CI: − 0.81 to − 0.36, p < 0.001) in ISF and plasma, respectively.
J. Clin. Med. 2020, 9, x 6 of 15
J. Clin. Med. 2020, 9, x; doi: www.mdpi.com/journal/jcm
Table 1. Patient characteristics. Entries are the mean
standard deviation or numbers (%). BMI = body mass index.
Obese (n = 15) Non-obese (n = 15) Number of females (n (%)) 13 (87%) 13 (87%)
Age (years) 50.3 9.5 49.5 10.0 Weight (kg) 134.3 34.3 67.9 8.8
Height (m) 1.66 0.07 1.68 0.07 BMI (kg/m
2) 48.7 11.2 23.9 2.1 Creatinine (µmol/L) 86.4 27.2 75.3 18.9 Type of surgery (n (%))
laparoscopic 15 (100%) 3 (20%)
open 0 (0%) 12 (80%)
ASA classification (n (%))
I 1 2
II 4 11
III 10 2
3.2. Primary (ISF) and Secondary Study Endpoint (Plasma): Correlation of AUC
0–8with Weight
Plasma and interstitial fluid data were available from all patients, though in one patient, one of the two catheters slipped out and could not be analysed. The median (interquartile range (IQR)) value for relative recovery in ISF was 48% (34%, 58%). The AUC
0-8in the ISF changed by −1.69 mg*h/L (95% CI: −2.59 to −0.79, p < 0.001) for every 10 kg increase in weight and had a correlation coefficient of −0.61 (95% CI: −0.80 to −0.32, p < 0.001) (see Figure 2 (A)). In the sensitivity analysis, the extreme value from a patient with a weight of 230 kg was removed and the correlation coefficient became −0.54, p = 0.002.
The free concentrations in plasma had a median (IQR) of 86% (84%, 88%) of the total concentrations.
In plasma, fAUC
0-8changed by −2.2 mg*h/L (95% CI: −3.1 to −1.2, p < 0.001) for every 10 kg increase in weight and the correlation coefficient was −0.68 (95% CI: −0.84 to −0.43, p < 0.001) (Figure 2 (B)). Correlations between AUC
0-8and BMI were very similar to those with weight and were −0.60 (95% CI: −0.79 to −0.31, p <
0.001) and −0.64 (95% CI: −0.81 to −0.36, p < 0.001) in ISF and plasma, respectively.
Figure 2. Correlation between the area under the concentration–time curve for unbound linezolid (fAUC0-8
) (A) in the interstitial fluid of subcutaneous adipose tissue (ISF) and (B) in plasma and weight after single
Figure 2.
Correlation between the area under the concentration–time curve for unbound linezolid
(fAUC
0–8) (A) in the interstitial fluid of subcutaneous adipose tissue (ISF) and (B) in plasma and weight
after single intravenous administration of 600 mg linezolid. fAUC
=area under the concentration–time
curve of unbound concentrations; CI
=confidence interval.
J. Clin. Med.2020,9, 1067 7 of 14
3.3. Analysis of ISF and Plasma Data as Functions of Time
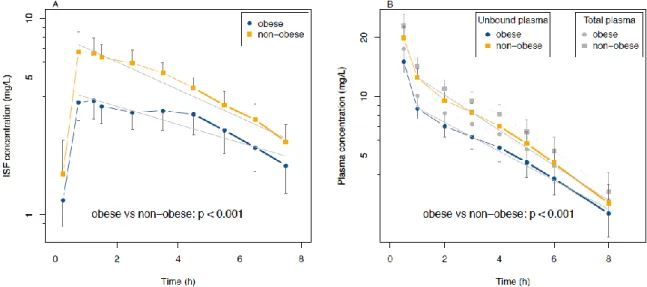
Linear mixed-models showed that ISF concentrations in the obese group were 0.52 (95% CI: 0.39 to 0.70, p < 0.001) times those of the non-obese group, but declined at a rate that was 1.06 (95% 1.00 to 1.11, p = 0.037) times that of the non-obese group (see Figure 3A). The catheters on the right yielded concentrations 0.95 (95% CI: 0.91 to 0.99, p = 0.015) times those on the left.
Plasma concentrations in obese patients were 0.67 (95% CI: 0.58 to 0.78, p < 0.001) times those of the non-obese group and the rate of decline was similarly, but not significantly, higher, with a factor of 1.04 (95 % CI: 1.00 to 1.08, p = 0.066) compared to the non-obese group (see Figure 3B).
J. Clin. Med. 2020, 9, x 7 of 15
J. Clin. Med. 2020, 9, x; doi: www.mdpi.com/journal/jcm
intravenous administration of 600 mg linezolid. fAUC = area under the concentration–time curve of unbound concentrations; CI = confidence interval.
3.3. Analysis of ISF and Plasma Data as Functions of Time
Linear mixed-models showed that ISF concentrations in the obese group were 0.52 (95% CI: 0.39 to 0.70, p < 0.001) times those of the non-obese group, but declined at a rate that was 1.06 (95% 1.00 to 1.11, p = 0.037) times that of the non-obese group (see Figure 3 (A)). The catheters on the right yielded concentrations 0.95 (95% CI: 0.91 to 0.99, p = 0.015) times those on the left.
Plasma concentrations in obese patients were 0.67 (95% CI: 0.58 to 0.78, p < 0.001) times those of the non-obese group and the rate of decline was similarly, but not significantly, higher, with a factor of 1.04 (95
% CI: 1.00 to 1.08, p = 0.066) compared to the non-obese group (see Figure 3 (B)).
Figure 3. Concentration–time curves of linezolid (A) in interstitial fluid of subcutaneous adipose tissue (ISF)
and (B) in plasma (total and unbound) after single administration of 600 mg linezolid intravenously.
Whiskers indicate a 95% CI. The linear mixed-model was visualized by the solid (obese) and dashed lines (non-obese) of concentrations in ISF (Figure 3 (A)) or unbound concentrations in plasma (Figure 3 (B)) and formed the basis for the formal statistical comparison of the obese vs. non-obese groups. Note that half-lives were estimated by linear regression using the last 4–5 points in the curves and are not represented by the lines in the figure.
3.4. PK Parameters in ISF and Plasma and Statistical Analysis
Table 2 describes the relevant main PK parameters. The V
sswas significantly higher in the obese group (41.0 L) compared to the non-obese group (30.8 L, 95% CI for the difference is 6.9 to 21.3 L, p < 0.001). C
maxand AUC
0-8were significantly lower in both plasma and interstitial fluid in the obese group (see Table 2 for estimates and p-values). The fAUC
0-8 ISF/fAUC
0-8 plasmaratio was somewhat, though not statistically significantly, lower in the obese group (0.53 vs. 0.62, p = 0.080).
Figure 3.
Concentration–time curves of linezolid (A) in interstitial fluid of subcutaneous adipose tissue (ISF) and (B) in plasma (total and unbound) after single administration of 600 mg linezolid intravenously. Whiskers indicate a 95% CI. The linear mixed-model was visualized by the solid (obese) and dashed lines (non-obese) of concentrations in ISF (Figure 3A) or unbound concentrations in plasma (Figure 3B) and formed the basis for the formal statistical comparison of the obese vs. non-obese groups.
Note that half-lives were estimated by linear regression using the last 4–5 points in the curves and are not represented by the lines in the figure.
3.4. PK Parameters in ISF and Plasma and Statistical Analysis
Table 2 describes the relevant main PK parameters. The V
sswas significantly higher in the obese group (41.0 L) compared to the non-obese group (30.8 L, 95% CI for the difference is 6.9 to 21.3 L, p <
0.001). C
maxand AUC
0–8were significantly lower in both plasma and interstitial fluid in the obese group (see Table 2 for estimates and p-values). The f AUC
0–8 ISF/f AUC
0–8 plasmaratio was somewhat, though not statistically significantly, lower in the obese group (0.53 vs. 0.62, p = 0.080).
3.5. PK Relations to MIC Values for Susceptible Bacteria
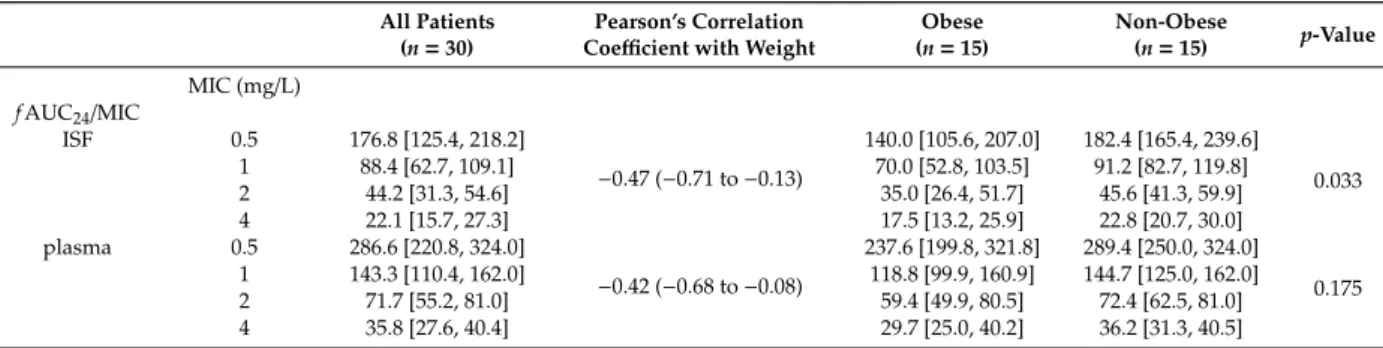
Table 3 shows the f AUC
24/MIC ratios for MICs of 0.5, 1, 2, and 4 mg/L. With an MIC ≥ 2 mg/L,
f AUC
24/MIC was lower than the target of 80 in both groups in plasma and ISF. In the obese group in
ISF, this also occurred with an MIC of 1 mg/L. In contrast to unbound plasma, the ratio in ISF was
significantly lower in the obese group (p = 0.033, see Table 3 for estimates and confidence intervals).
J. Clin. Med.2020,9, 1067 8 of 14
Table 2.
Pharmacokinetic parameters for linezolid. Entries are the median [interquartile range], estimate (95% confidence interval), or count (%). The p-values refer to comparisons of the obese and non-obese groups. AUC
=area under the concentration–time curve; CL
=total body clearance; ISF
=interstitial fluid of the subcutaneous adipose tissue; MRT
=mean resistance time; V
ss=volume of distribution at a steady state; C
max=maximum concentration; t
1/2=half-life; T
max=time point of C
max. Bold type indicates significant values.
All Patients (n=30)
Pearson’s Correlation
Coefficient with Weight Obese (n=15)
Non-Obese
(n=15) p-Value Cmax(mg/L)
ISF 5.5 [3.8, 8.5] −0.70 (−0.85 to−0.45) 3.8 [3.2, 5.3] 8.3 [5.7, 10.2] <0.001 Plasma (total) 21.9 [17.2, 24.4] −0.63 (−0.81 to−0.36) 19.2 [16.1, 22.1] 24.4 [18.9, 26.9] 0.013 Plasma (unbound) 18.5 [14.4, 21.1] −0.66 (−0.82 to−0.39) 15.9 [13.3, 18.7] 21.1 [16.6, 23.3] 0.007
t1/2(hours)
ISF 3.9 [2.8, 4.8] 0.11 (−0.26 to 0.45) 3.9 [2.7, 5.1] 3.8 [3.0, 4.2] 0.664
Plasma(total and unbound) 3.4 [2.6, 4.4] 0.52 (0.20 to 0.74) 3.8 [3.0, 4.8] 3.0 [2.5, 3.6] 0.088 Vss(L), plasma 37.7 [31.3, 44.6] 0.87 (0.75 to 0.94) 41.0 [38.4, 57.9] 30.8 [27.9, 35.5] <0.001 CL (L/h), plasma 7.2 [6.3, 9.3] 0.21 (−0.16 to 0.53) 8.2 [6.2, 10.8] 7.0 [6.4, 8.2] 0.170 MRT (h), plasma 5.0 [3.8, 6.3] 0.47 (0.13 to 0. 71) 5.7 [4.5, 6.9] 4.4 [3.8, 5.4] 0.079 Tmax, ISF 30–60/60–90/>90 min
(number of patients) 17/3/10 — 7/3/5 10/0/5 0.252
AUC0-8, (mg*h/L)
ISF 29.4 [23.5, 37.8] −0.61 (−0.80 to−0.32) 23.7 [20.2, 28.1] 34.4 [29.4, 45.5] 0.004 Plasma(total) 63.4 [52.8, 71.1] −0.66 (−0.82 to−0.39) 57.9 [45.4, 65.6] 67.8 [61.5, 80.5] 0.011 Plasma(unbound) 54.5 [45.6, 61.5] −0.68 (−0.84 to−0.43) 47.7 [39.7, 56.7] 59.6 [51.7, 70.8] 0.005 AUC0–8 ISF/fAUC0–8 plasma 0.53 [0.46, 0.65] −0.28 (−0.58 to 0.09) 0.53 [0.45, 0.55] 0.62 [0.53, 0.68] 0.080
Table 3.
Linezolid exposure in the interstitial fluid of subcutaneous adipose tissue and plasma relative to clinically relevant MIC values. Entries are the median [interquartile range] or estimate (95% confidence interval). The p-values refer to comparisons of the obese and non-obese groups. f AUC
=area under the concentration–time curve of unbound concentrations; ISF
=interstitial space fluid; MIC
=minimal inhibitory concentration.
All Patients (n=30)
Pearson’s Correlation
Coefficient with Weight Obese (n=15)
Non-Obese
(n=15) p-Value MIC (mg/L)
fAUC24/MIC
ISF 0.5 176.8 [125.4, 218.2]
−0.47 (−0.71 to−0.13)
140.0 [105.6, 207.0] 182.4 [165.4, 239.6]
0.033
1 88.4 [62.7, 109.1] 70.0 [52.8, 103.5] 91.2 [82.7, 119.8]
2 44.2 [31.3, 54.6] 35.0 [26.4, 51.7] 45.6 [41.3, 59.9]
4 22.1 [15.7, 27.3] 17.5 [13.2, 25.9] 22.8 [20.7, 30.0]
plasma 0.5 286.6 [220.8, 324.0]
−0.42 (−0.68 to−0.08)
237.6 [199.8, 321.8] 289.4 [250.0, 324.0]
0.175
1 143.3 [110.4, 162.0] 118.8 [99.9, 160.9] 144.7 [125.0, 162.0]
2 71.7 [55.2, 81.0] 59.4 [49.9, 80.5] 72.4 [62.5, 81.0]
4 35.8 [27.6, 40.4] 29.7 [25.0, 40.2] 36.2 [31.3, 40.5]
J. Clin. Med.2020,9, 1067 9 of 14
4. Discussion
The main findings of this study were that linezolid concentrations in soft tissue and plasma depended on the weight and therapeutic targets of f AUC
24/MIC > 80 [28,29] were below accepted values in intensive care medicine, particularly for obese patients.
Our data expanded on other studies, which only performed measurements in plasma and/or lacked a non-obese control group [7,10,33]. Obesity leads to increased extracellular fluid and consequently, to an increased volume of distribution with lower plasma concentrations [33–35]. In our study, the increase was from 31 to 41 L. It should also be noted that other studies of non-obese patients showed comparable estimates of V (26.7–31.9 L) [36]. The slightly lower ratio of f AUC
0–8 ISF/f AUC
0–8 plasmain obese patients suggests that target site exposure among the obese may not directly follow penetration in normal weight patients. This agrees with other studies showing differences in this penetration ratio between obese and non-obese groups [37]. Hence, our results corroborated that measurement at the target site is required to assess the adequacy of anti-infective exposure [13]. This finding may well be even more relevant in critically ill patients, where volumes of distribution are generally higher [38].
In critically ill patients, the phenomenon of augmented renal clearance is also described, which leads to an enhanced renal function and thus has an effect on the effective levels of many antibiotics in critically ill patients [39,40]. In contrast, altered renal clearance does not seem to have a relevant effect on the elimination of linezolid [41,42]. Renal function accounted for only 16% of the variance in linezolid clearance [10]. Therefore, the use of linezolid may be advisable, especially in critically ill patients with an altered renal function.
Recommendations of current guidelines [1–3,5] and the survival benefit of linezolid therapy compared to vancomycin in soft tissue infections [43] will lead to the more frequent use of linezolid, especially in intensive care medicine. We have confirmed the numerous plasma-based scientific results to date showing that the current dose of linezolid is sufficient in non-obese patients for a low MIC of 0.5 or 1 mg/L. This is also true in the ISF of the target tissue, although concentrations were lower.
Moreover, our therapeutic target was not reached in plasma and ISF with an MIC above 2 mg/L for non-obese patients, as found in previous studies [6,7,10,44]. The differences between ISF and plasma concentrations were considerable. In the former, there was a clinically relevant difference between obese and non-obese groups, and in obese patients, the target was not even reached at the low MIC of 1 mg/L. Particularly in pathogens with higher MICs, such as multiresistant pathogens (2 or 4 mg/L) [30], our results indicated that the current therapy may be inadequate in all patients, especially in obese patients, and may lead to an increased development of resistance. This could be particularly relevant for empirical antimicrobial therapy with linezolid in severe skin and soft tissue infections, toxic shock syndrome, or septic shock in critically ill patients.
These findings imply the need for dosing intensification, as is currently being discussed [8,9,45], especially in obese patients. However, results of studies investigating dose adjustment in obese patients under clinical conditions do not yet exist. The fraction of enterococci resistant to linezolid is currently reported to be 1.6% worldwide [46] and the rate is increasing [47–49]. In this context, therapeutic drug monitoring is recommended [50,51].
The mean t
1/2of 3.4 h in plasma was somewhat shorter than what has been summarized by Stalker et al. [41], although it agrees well with other published values in the peri-operative setting, where increased diuresis after surgery is a factor that is likely to be relevant [20].
The total CL of linezolid did not depend on weight, which indicates that no relative adjustment
of the maintenance dose solely due to the obesity status may be necessary. However, since this is
a single-dose study, such extrapolations to a steady state after multiple dosing should be performed
with caution. However, our data do permit statements regarding the loading dosage. Based on
a population kinetic approach, a dosing schedule of 450 mg linezolid thrice daily has been suggested,
in order to avoid high peak plasma concentrations during multiple dosing [10]. Based on the result of
the present study, an alternative and practicable twice daily dosing schedule could include a loading
dose of 600 mg or even 900 mg, accounting for the higher volume of distribution in obese patients
J. Clin. Med.2020,9, 1067 10 of 14
and the slower diffusion into the tissue, followed by standard dosing of 600 mg linezolid twice daily, accounting for the similar clearance in both groups, and preferably administered as prolonged infusion, starting, e.g., after 8 h instead of 12 h. Regarding further dose adjustments during multiple dosing in critically ill patients, therapeutic drug monitoring is advised due to the high variability of linezolid plasma concentrations in these patients [27,50,51].
Post-hoc, exploratory nonlinear modeling of mixed effects with compartment methods has been performed to investigate additional hypothesis-generating questions, such as those relating to different dosing regimens. [52]. Moreover, different body size descriptors, such as the ideal body weight and lean body weight, could be useful for gaining an in-depth understanding of PK [53] and were considered in the exploratory paper mentioned above, whereas we complied with the foreseen protocol analysis based on weight. Using the methods employed in nonlinear modeling, Monte-Carlo simulations allowed us to explore the probability of target attainment in a variety of scenarios.
This study addresses the PK of linezolid in plasma, as well as at a subcutaneous target site, in morbidly obese patients and includes a control group of non-obese patients. In addition, it is the first controlled study with a larger sample size for target site measurements. However, this study had some limitations. The sampling schedule was limited to 8 h due to the clinical setting covering less than three half-lives. However, the extrapolation for AUC
24was 24% and thus only marginally in excess of the recommended 20% for bioequivalence studies. In ISF, the extrapolation was 33%. Estimates of clearance and the distribution volume also rely on extrapolated data. As both groups are likely to be affected approximately equally, the comparison of obese and non-obese patients should by quite robust.
Some of the differences may also be attributable to the different type of surgery (e.g., laparoscopy).
Anesthesia may have an effect on the elimination of linezolid with expected reduced clearance due to a possible reduction of the cardiac output. This could only be investigated with a control group without anesthesia but was not the aim of the study. Infections can occur in different tissues and extrapolation of the results from the ISF of subcutaneous adipose tissue requires caution.
Patients without infection were examined and measurements were taken in healthy tissue, but other authors have shown that in diabetic patients, infected tissue has the same linezolid concentrations as in healthy tissue [54,55]. However, extrapolation from this single-dose study in non-infected surgical patients to infected critically ill patients, where problems of underdosing are expected to be more pronounced, should be done with caution [6,23].
5. Conclusions
An increasing weight led to a clinically significant continuous decrease of linezolid concentrations in plasma, but also, more importantly, at the target site. Furthermore, the current dosing regimen of linezolid did not seem to lead to a sufficient concentration for empirical antibiotic therapy in intensive care medicine with an expected MIC of 2 or 4 mg/L in plasma or at the subcutaneous target site, particularly in obese critically ill patients. Our data suggest the need to measure linezolid concentrations in obese and above all, critically ill patients, especially at the target site, over a longer multiple-dosing treatment period.
Author Contributions:
All authors followed the International Committee of Medical Journal Editors (ICMJE) guidelines. P.S., H.W., D.P., F.K., M.Z., and A.D. contributed to the study conception and design.
Material preparation, data collection, and analysis were performed by P.S., S.H., D.P., F.K., and C.D. The first draft of the manuscript was written by P.S. and D.P.; D.B., C.D., L.E., F.G., F.K, C.K. and H.W. commented on previous versions of the manuscript. P.S., D.B., C.D., L.E., S.H., F.G., A.D., M.Z., F.K. C.K. and H.W. read and approved the final manuscript. All authors have read and agreed to the published version of the manuscript.
Funding:
This trial is funded by the Federal Ministry of Education and Research, Germany (Integrated Research and Treatment Centre IFB “Adiposity Diseases”, FKZ: 01E01001), and by departmental funding.
Acknowledgments:
We thank the team of the Clinical Trial Centre of the University of Leipzig for organizational
support, study promotion, and on-site monitoring. Many thanks to Christiane Prettin (Clinical trial centre, Leipzig)
for the excellent study management and to Frank Mehner, Nancy Neumann, Melanie Simon, Sven Walther,
and Jana Heyde for their help in data acquisition (all University of Leipzig Medical Centre, Department of
Anaesthesiology and Intensive Care, Leipzig).
J. Clin. Med.2020,9, 1067 11 of 14
Conflicts of Interest:
H.W. received grants from Pfizer (Investigator Initiated Trial Program, Berlin, Germany) and InfectoPharm (Heppenheim, Germany), both for the clinical microdialysis trial. H.W. reports lecture fees from InfectoPharm (Heppenheim, Germany) and MSD (Konstanz, Germany) and consultant honoraria from Dräger Medical (Lübeck, Germany). P.S. reports lecture fees from InfectoPharm (Heppenheim, Germany).
C.K. reports research grants from an industry consortium (AbbVie Deutschland GmbH & Co. KG, Boehringer Ingelheim Pharma GmbH & Co. KG, Grünenthal GmbH, F. Hoffmann-La Roche Ltd., Merck KGaA and SANOFI), the Innovative Medicines Initiative-Joint Undertaking (‘DDMoRe’), Diurnal Ltd. and the Federal Ministry of Education and Research within the Joint Programming Initiative on Antimicrobial Resistance Initiative (JPIAMR).
M.Z. received funding for other investigator-initiated trials from Pfizer (Wien, Austria). The other authors declare that they have no competing interests.
References
1. Stevens, D.L.; Bisno, A.L.; Chambers, H.F.; Dellinger, E.P.; Goldstein, E.J.; Gorbach, S.L.; Hirschmann, J.V.;
Kaplan, S.L.; Montoya, J.G.; Wade, J.C. Infectious Diseases Society of America. Practice guidelines for the diagnosis and management of skin and soft tissue infections: 2014 update by the Infectious Diseases Society of America. Clin. Infect. Dis.
2014,59, e10–e52. [CrossRef] [PubMed]
2. Bassetti, M.; Baguneid, M.; Bouza, E.; Dryden, M.; Nathwani, D.; Wilcox, M. European perspective and update on the management of complicated skin and soft tissue infections due to methicillin-resistant Staphylococcus aureus after more than 10 years of experience with linezolid. Clin. Microbiol. Infect.
2014,20, 3–18. [CrossRef]
[PubMed]
3. Sartelli, M.; Guirao, X.; Hardcastle, T.C.; Kluger, Y.; Boermeester, M.A.; Ra¸sa, K.; Ansaloni, L.; Coccolini, F.;
Montravers, P.; Abu-Zidan, F.M.; et al. 2018 WSES/SIS-E consensus conference: Recommendations for the management of skin and soft-tissue infections. World J. Emerg. Surg.
2018,13, 58. [CrossRef] [PubMed]
4. Burnham, J.P.; Kirby, J.P.; Kollef, M.H. Diagnosis and management of skin and soft tissue infections in the intensive care unit: A review. Intensive Care Med.
2016,42, 1899–1911. [CrossRef]
5. Brinkmann, A.; Röhr, A.C.; Frey, O.R.; Krüger, W.A.; Brenner, T.; Richter, D.C.; Bodmann, K.F.; Kresken, M.;
Grabein, B. S2k guidelines of the PEG on calculated parenteral initial treatment of bacterial diseases in adults: Focussed summary and supplementary information on antibiotic treatment of critically ill patients.
Anaesthesist
2018,67, 936–949. [CrossRef]
6. Minichmayr, I.K.; Schaeftlein, A.; Kuti, J.L.; Zeitlinger, M.; Kloft, C. Clinical Determinants of Target Non-Attainment of Linezolid in Plasma and Interstitial Space Fluid: A Pooled Population Pharmacokinetic Analysis with Focus on Critically Ill Patients. Clin. Pharmacokinet.
2017,56, 617–633. [CrossRef]
7. Xie, F.; Mantzarlis, K.; Malliotakis, P.; Koulouras, V.; Degroote, S.; Koulenti, D.; Blot, S.; Boussery, K.;
Van Bocxlaer, J.; Colin, P.; et al. Pharmacokinetic evaluation of linezolid administered intravenously in obese patients with pneumonia. J. Antimicrob. Chemother.
2019,74, 667–674. [CrossRef]
8. Dong, H.; Xie, J.; Wang, T.; Chen, L.; Zeng, X.; Sun, J.; Wang, X.; Dong, Y. Pharmacokinetic/pharmacodynamic evaluation of linezolid for the treatment of staphylococcal infections in critically ill patients. Int. J. Antimicrob.
Agents
2016,48, 259–264. [CrossRef]
9. Taubert, M.; Zander, J.; Frechen, S.; Scharf, C.; Frey, L.; Vogeser, M.; Fuhr, U.; Zoller, M. Optimization of linezolid therapy in the critically ill: The effect of adjusted infusion regimens. J. Antimicrob. Chemother.
2017,72, 2304–2310. [CrossRef]
10. Cojutti, P.; Pai, M.P.; Pea, F. Population Pharmacokinetics and Dosing Considerations for the Use of Linezolid in Overweight and Obese Adult Patients. Clin. Pharmacokinet.
2018,57, 989–1000. [CrossRef]
11. Toma, O.; Suntrup, P.; Stefanescu, A.; London, A.; Mutch, M.; Kharasch, E. Pharmacokinetics and tissue penetration of cefoxitin in obesity: Implications for risk of surgical site infection. Anesth. Analg.
2011,113, 730–737. [CrossRef]
[PubMed]
12. Hollenstein, U.M.; Brunner, M.; Schmid, R.; Muller, M. Soft tissue concentrations of ciprofloxacin in obese and lean subjects following weight-adjusted dosing. Int. J. Obes. Relat. Metab. Disord.
2001,25, 354–358.
[CrossRef] [PubMed]
13. Jager, N.G.L.; van Hest, R.M.; Lipman, J.; Roberts, J.A.; Cotta, M.O. Antibiotic exposure at the site of infection:
Principles and assessment of tissue penetration. Expert Rev. Clin. Pharmacol.
2019,12, 623–634. [CrossRef]
[PubMed]
14. World Health Organization. Obesity and Overweight 2009 [Fact Sheet No. 311; Online]. Available online:
http://www.who.int/mediacentre/factsheets/fs311/en/index.html (accessed on 29 September 2009).
J. Clin. Med.2020,9, 1067 12 of 14
15. Alobaid, A.S.; Hites, M.; Lipman, J.; Taccone, F.S.; Roberts, J.A. Effect of obesity on the pharmacokinetics of antimicrobials in critically ill patients: A structured review. Int. J. Antimicrob. Agents
2016,47, 259–268.
[CrossRef] [PubMed]
16. Meng, L.; Mui, E.; Holubar, M.K.; Deresinski, S.C. Comprehensive Guidance for Antibiotic Dosing in Obese Adults. Pharmacotherapy
2017,37, 1415–1431. [CrossRef]
17. Hanley, M.J.; Abernethy, D.R.; Greenblatt, D.J. Effect of obesity on the pharmacokinetics of drugs in humans.
Clin. Pharmacokinet.
2010,49, 71–87. [CrossRef]
18. Dehghanyar, P.; Bürger, C.; Zeitlinger, M.; Islinger, F.; Kovar, F.; Müller, M.; Kloft, C.; Joukhadar, C. Penetration of linezolid into soft tissues of healthy volunteers after single and multiple doses. Antimicrob. Agents Chemother.
2005,49, 2367–2371. [CrossRef]
19. Gee, T.; Ellis, R.; Marshall, G.; Andrews, J.; Ashby, J.; Wise, R. Pharmacokinetics and tissue penetration of linezolid following multiple oral doses. Antimicrob. Agents Chemother.
2001,45, 1843–1846. [CrossRef]
20. Schwameis, R.; Syré, S.; Sarahrudi, K.; Appelt, A.; Marhofer, D.; Burau, D.; Kloft, C.; Zeitlinger, M. Penetration of linezolid into synovial fluid and muscle tissue after elective arthroscopy. J. Antimicrob. Chemother.
2017,72, 2817–2822. [CrossRef] [PubMed]
21. Thallinger, C.; Buerger, C.; Plock, N.; Kljucar, S.; Wuenscher, S.; Sauermann, R.; Kloft, C.; Joukhadar, C.
Effect of severity of sepsis on tissue concentrations of linezolid. J. Antimicrob. Chemother.
2008,61, 173–176.
[CrossRef] [PubMed]
22. Buerger, C.; Plock, N.; Dehghanyar, P.; Joukhadar, C.; Kloft, C. Pharmacokinetics of unbound linezolid in plasma and tissue interstitium of critically ill patients after multiple dosing using microdialysis. Antimicrob.
Agents Chemother.
2006,50, 2455–2463. [CrossRef] [PubMed]
23. De Pascale, G.; Fortuna, S.; Tumbarello, M.; Cutuli, S.L.; Vallecoccia, M.; Spanu, T.; Bello, G.; Montini, L.;
Pennisi, M.A.; Navarra, P.; et al. Linezolid plasma and intrapulmonary concentrations in critically ill obese patients with ventilator-associated pneumonia: Intermittent vs continuous administration. Intensive Care Med.
2015,41, 103–110. [CrossRef] [PubMed]
24. Simon, P.; Petroff, D.; Dorn, C.; Ehmann, L.; Kloft, C.; Prettin, C.; Dietrich, A.; Zeitlinger, M.; Kees, F.; Wrigge, H.
Measurement of soft tissue drug concentrations in morbidly obese and non-obese patients—A prospective, parallel group, open-labeled, controlled, phase IV, single center clinical trial. Contemp. Clin. Trials Commun.
2019,
15, 100375. [CrossRef] [PubMed]
25. Bouw, M.R.; Hammarlund-Udenaes, M. Methodological Aspects of the Use of a Calibrator in In Vivo Microdialysis–Further Development of the Retrodialysis Method. Pharm. Res.
1998,15, 1673–1679. [CrossRef]
26. Burau, D.; Petroff, D.; Simon, P.; Ehmann, L.; Weise, C.; Dorn, C.; Kratzer, A.; Wrigge, H.; Kloft, C.
Drug combinations and impact of experimental conditions on relative recovery in in vitro microdialysis investigations. Eur. J. Pharm. Sci.
2019,127, 252–260. [CrossRef]
27. Töpper, C.; Steinbach, C.L.; Dorn, C.; Kratzer, A.; Schleibinger, M.; Liebchen, U.; Kees, F.; Salzberger, B.;
Kees, M.G. Variable Linezolid Exposure in Intensive Care Unit Patients-Possible Role of Drug-Drug Interactions. Ther. Drug Monit.
2016,38, 573–578.
28. Rayner, C.R.; Forrest, A.; Meagher, A.K.; Birmingham, M.C.; Schentag, J.J. Clinical pharmacodynamics of linezolid in seriously ill patients treated in a compassionate use programme. Clin. Pharmacokinet.
2003,42, 1411–1423. [CrossRef]
29. Pea, F.; Furlanut, M.; Cojutti, P.; Cristini, F.; Zamparini, E.; Franceschi, L.; Viale, P. Therapeutic drug monitoring of linezolid: A retrospective monocentric analysis. Antimicrob. Agents Chemother.
2010,54, 4605–4610. [CrossRef]
30. European Committee on Antimicrobial Susceptibility Testing. Breakpoint Tables for Interpretation of MICs and Zone Diameters, Version 9.0. 2019. Available online: http://www.eucast.org/fileadmin/src/media/PDFs/
EUCAST_files/Breakpoint_tables/v_9.0_Breakpoint_Tables.pdf (accessed on 1 January 2019).
31. Maronna, R.A.; Yohai, V.J. The behavior of the Stahel-Donoho robust multivariate estimator. J. Am. Stat. Assoc.
1995,
90, 330–341. [CrossRef]
32. Wang, J.; Zamar, R.; Marazzi, A.; Yohai, V.; Salibian-Barrera, M.; Maronna, R.; Zivot, E.; Rocke, D.; Martin, D.;
Maechler, M.; et al. Robust: Port of the S+ “Robust Library” 2020. R Package Version 0.5-0.0. Available online: https://CRAN.R-project.org/package=robust (accessed on 27 March 2020).
33. Bhalodi, A.A.; Papasavas, P.K.; Tishler, D.S.; Nicolau, D.P.; Kuti, J.L. Pharmacokinetics of Intravenous Linezolid in Moderately to Morbidly Obese Adults. Antimicrob. Agents Chemother.
2013,57, 1144–1149.
[CrossRef] [PubMed]
J. Clin. Med.2020,9, 1067 13 of 14
34. Taubert, M.; Zoller, M.; Maier, B.; Frechen, S.; Scharf, C.; Holdt, L.M.; Frey, L.; Vogeser, M.; Fuhr, U.; Zander, J.
Predictors of Inadequate Linezolid Concentrations after Standard Dosing in Critically Ill Patients. Antimicrob.
Agents Chemother.
2016,60, 5254–5261. [CrossRef]
35. Meagher, A.K.; Forrest, A.; Rayner, C.R.; Birmingham, M.C.; Schentag, J.J. Population pharmacokinetics of linezolid in patients treated in a compassionate-use program. Antimicrob. Agents Chemother.
2013,47, 548–553.
[CrossRef] [PubMed]
36. McGee, B.; Dietze, R.; Hadah, D.J.; Molino, L.P.; Maciel, E.L.; Boom, W.H.; Palaci, M.; Johnson, J.L.;
Peloquin, C.A. Population pharmacokinetics of linezolid in adults with pulmonary tuberculosis. Antimicrob.
Agents Chemother.
2009,53, 3981–3984. [CrossRef] [PubMed]
37. Brill, M.J.; Houwink, A.P.; Schmidt, S.; Van Dongen, E.P.; Hazebroek, E.J.; van Ramshorst, B.; Deneer, V.H.;
Mouton, J.W.; Knibbe, C.A. Reduced subcutaneous tissue distribution of cefazolin in morbidly obese versus non-obese patients determined using clinical microdialysis. J. Antimicrob. Chemother.
2014,69, 715–723.
[CrossRef]
38. Blot, S.I.; Pea, F.; Lipman, J. The effect of pathophysiology on pharmacokinetics in the critically ill patient—Concepts appraised by the example of antimicrobial agents. Adv. Drug Deliv. Rev.
2014,77, 3–11. [CrossRef]
39. Udy, A.A.; Putt, M.T.; Boots, R.J.; Lipman, J. ARC—Augmented renal clearance. Curr. Pharm. Biotechnol.
2011,
12, 2020–2029. [CrossRef]
40. Udy, A.A.; Roberts, J.A.; Boots, R.J.; Paterson, D.L.; Lipman, J. Augmented renal clearance: Implications for antibacterial dosing in the critically ill. Clin. Pharmacokinet.
2010,49, 1–16. [CrossRef]
41. Yue, J.; Dong, B.R.; Yang, M.; Chen, X.; Wu, T.; Liu, G.J. Linezolid versus vancomycin for skin and soft tissue infections. Cochrane Database Syst. Rev.
2016,1. [CrossRef] [PubMed]
42. Brier, M.E.; Stalker, D.J.; Aronoff, G.R.; Batts, D.H.; Ryan, K.K.; O’Grady, M.; Hopkins, N.K.; Jungbluth, G.L.
Pharmacokinetics of Linezolid in Subjects with Renal Dysfunction. Antimicrob. Agents Chemother.
2003,47, 2775–2780. [CrossRef] [PubMed]
43. Yang, M.; Zhang, J.; Chen, Y.; Liang, X.; Guo, Y.; Yu, J.; Zhu, D.; Zhang, Y. Optimization of linezolid treatment regimens for Gram-positive bacterial infections based on pharmacokinetic/pharmacodynamic analysis.
Future Microbiol.
2017,12, 39–50. [CrossRef] [PubMed]
44. Wu, X.; Tang, Y.; Zhang, X.; Wu, C.; Kong, L. Pharmacokinetics and pharmacodynamics of linezolid in plasma/cerebrospinal fluid in patients with cerebral hemorrhage after lateral ventricular drainage by Monte Carlo simulation. Drug Des. Dev. Ther.
2018,12, 1679–1684. [CrossRef]
45. Pfaller, M.A.; Cormican, M.; Flamm, R.K.; Mendes, R.E.; Jones, R.N. Temporal and Geographic Variation in Antimicrobial Susceptibility and Resistance Patterns of Enterococci: Results From the SENTRY Antimicrobial Surveillance Program, 1997–2016. Open Forum Infect. Dis.
2019,6, 54–62. [CrossRef]
46. Tsilipounidaki, K.; Gerontopoulos, A.; Papagiannitsis, C.; Petinaki, E. First detection of an optrA-positive, linezolid-resistant ST16 Enterococcus faecalis from human in Greece. New Microbes New Infect.
2019,29, 100515. [CrossRef] [PubMed]
47. Sassi, M.; Guérin, F.; Zouari, A.; Beyrouthy, R.; Auzou, M.; Fines-Guyon, M.; Potrel, S.; Dejoies, L.; Collet, A.;
Boukthir, S.; et al. Emergence of optrA-mediated linezolid resistance in enterococci from France, 2006–16.
J. Antimicrob. Chemother.
2019,74, 1469–1472. [CrossRef] [PubMed]
48. Deshpande, L.M.; Castanheira, M.; Flamm, R.K.; Mendes, R.E. Evolving oxazolidinone resistance mechanisms in a worldwide collection of enterococcal clinical isolates: Results from the SENTRY Antimicrobial Surveillance Program. J. Antimicrob. Chemother.
2018,73, 2314–2322. [CrossRef] [PubMed]
49. Pea, F.; Cojutti, P.G.; Baraldo, M. A 10-Year Experience of Therapeutic Drug Monitoring (TDM) of Linezolid in a Hospital-wide Population of Patients Receiving Conventional Dosing: Is there Enough Evidence for Suggesting TDM in the Majority of Patients. Basic Clin. Pharmacol. Toxicol.
2017,121, 303–308. [CrossRef]
50. Zoller, M.; Maier, B.; Hornuss, C.; Neugebauer, C.; Döbbeler, G.; Nagel, D.; Holdt, L.M.; Bruegel, M.; Weig, T.;
Grabein, B.; et al. Variability of linezolid concentrations after standard dosing in critically ill patients:
A prospective observational study. Crit. Care
2014,18, R148. [CrossRef]
51. Stalker, D.J.; Jungbluth, G.L.; Hopkins, N.K.; Batts, D.H. Pharmacokinetics and tolerance of single- and multiple-dose oral or intravenous linezolid, an oxazolidinone antibiotic, in healthy volunteers.
J. Antimicrob. Chemother.
2003,51, 1239–1246. [CrossRef]
J. Clin. Med.2020,9, 1067 14 of 14
52. Ehmann, L.; Simon, P.; Busse, D.; Petroff, D.; Dorn, C.; Huisinga, W.; Dietrich, A.; Zeitlinger, M.; Wrigge, H.;
Kloft, C. Risk of target non-attainment in obese compared to non-obese patients in calculated linezolid therapy. Clin. Microbiol. Infect.
2020. under review.53. Green, B.; Duffull, S.B. What is the best size descriptor to use for pharmacokinetic studies in the obese? Br. J.
Clin. Pharmacol.
2004,58, 119–133. [CrossRef]
54. Traunmueller, F.; Schintler, M.V.; Spendel, S.; Popovic, M.; Mauric, O.; Scharnagl, E.; Joukhadar, C. Linezolid concentrations in infected soft tissue and bone following repetitive doses in diabetic patients with bacterial foot infections. Int. J. Antimicrob. Agents
2010,36, 84–86. [CrossRef] [PubMed]
55. Eslam, R.B.; Burian, A.; Vila, G.; Sauermann, R.; Hammer, A.; Frenzel, D.; Minichmayr, I.K.; Kloft, C.;
Matneller, P.; Oesterreicher, Z.; et al. Target Site Pharmacokinetics of Linezolid After Single and Multiple Doses in Diabetic Patients with Soft Tissue Infection. J. Clin. Pharmacol.
2014,54, 1058–1062. [CrossRef]
[PubMed]
©