Riedel et al.: Hydroxyproline, glycine and serine concentrations in plasma of haemodialysis patients 851 J. Clin. Chem. Clin. Biochem.
Vol. 27, 1989, pp. 851-856
© 1989 Walter de Gruyter & Co.
Berlin · New York
Changes in the Concentrations of Hydroxyproline, Glycine and Serine in the Plasma of Haemodialysis Patients Undergoing
Erythropoietin Therapy
By E. Riedel, M. Nündel, B. Algermissen Freie Universität Berlin, Institut für Biochemie Hannelore Hampl
Freie Universität Berlin, Klinikum Rudolf Virchow, Abteilung für Innere Medizin mit Schwerpunkt Nephrologie P. Scigalla
Fa. Boehringer Mannheim GmbH, Abteilung Klinische Entwicklung Salvia and U. Stabell
Institut för Nuclearmedizin
tDillenburgerstraße, Berlin 33
(Received August 25, 1988//May 9/August 10, 1989)
Summary: The concentrations of proline, hydroxyproline, glycine and serine were determined in the plasma of 39 haemodialysis patients and 18 healthy subjects, using liquid chromatography with fluorescence detection.
Plasma cpncentrations of the N-terminal immunoreactive parathyrin were also measured. In haemodialysis patients, the plasma concentrations of glycine (p < 0.01), hydroxyproline (p < 0.05) and proline (p < 0.10) were significantly increased, whereas the serine concentrations (p < 0.01) were decreased, compared with those of the healthy controls. Haemodialysis patients showed greatly elevated plasma N-terminal immunoreactive parathyrin valües (> 30 pmol/1), which showed a signiflcant correlation with the hydroxyproline values (r = 0.79). Fourteen haemodialysis patients received erythropoietin therapy. In these patients, changes in the concentrations öf plasma amino acids were observed up to one year after the beginning of therapy. In the course of the erythroppietin therapy, the plasma cöücentrations of glycine (p < 0.05) and hydroxyproline (p < 0.10) of the haemodialysis patients decreased, whereas the concentration of serine increased (p < 0.05) to approximately normal values. The resülts indicate that erythropoietin therapy leads to a normalization of amino acid metabolism.
Introduction
Osteodystrophies and elevated concentrations of hy- droxyproline in plasma are closely correlated in pa- tients with chrpnic renäl diseases. Hence, the concen- tration of free hydroxyproline in plasma was recom-
J) Enzymes
Hydroxyproline oxidase (EC l'.4.3.—) Glycine hydroxymethyltransferase (Serine hydroxymethylase) (EC 2.1.2.1)
J. Clin. Chem. Clin. Biochem. / Vol. 27,1989 / No. 11
mended äs a useful biochemical marker for diagnosis
and therapy of bone diseases (1). Varghese et al. (1)
showed that the ratio of free plasma hydroxyproline
to peptide-bound hydroxyproline was unchanged in
haemodialysis patients with and without visible bone
condition, and concluded that catabolism is not in-
hibited in haemodialysis patients. Hydroxyproline is
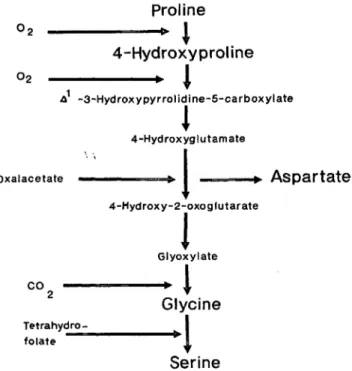
degraded in the liver to A^-hydroxy-pyrrolidine-S-
carboxylate by hydroxyproline oxidase
1) (fig. 1). It has
The Roots of Modern Biochemistry
Fritz Lipmann's Squiggle and its Consequences
Editors Horst Kleinkauf, Hans von Döhren, Lothar Jaenicke 1988.17 cm 24 cm. XII, 988 pages. Numerous illustrations.
Hardcover. DM 448,-; approx. US $263.00 ISBN 311011585 9
A Fritz Lipmann dedicatory volume, originating frörn the Memorial Meeting held in Berlin-Dahlem in 1987, presenting the major aspects of modern biochemistry and their development in 90 essays. The Warburg/Meyerhof era, the time of emigration and postwar science are revived. Contemporaries and coworkers together with other outstanding scientists describe the state of biochemistry in major fields: äs it was, äs it is now, and where it will be göing. At the same time this volume is a reference book on Fritz Lipmann, the
outstanding biochemist, and life scientist, who considered his concept
of the energy-rich bond, symbolized by the squiggle, äs his major \ achievement.
From the Contents
Fritz Lipmann 1899-1986 · Biochemistry Comes of Age ·
Molecular Biology Sharpens its Tools · Functional Dynamics:
The Squiggle-Symbol of Bioenergetics; Molecular Recognition and Communication · Evolution · List of Contributors · Lipmann's
Coworkers at Massachusetts General Hospital, Boston, and the Rockefeller University, New York · Fritz Lipmann: Bibliography 1924-1985 · Author Index · Subject Index
Price is subject to change without notice
w
DEG er · Berlin · New York
Verlag Walter de Gruyter & Co., Genthiner Str. 13, D-1000 Berlin 30, Tel.: (030) 26005-0, Telex 184027 Walter de Gruyter, Inc., 200 Saw Mill River Road, Hawthorne, N. Y. 10532, Tel. (914) 747-0110, Tefex 646677
(116)
Are g/ucose determlnatlons partofyour
routfne operatlons?
ESAT is ideally suited to your needs. This analyzer can perform up to 120 determi-
nations per hour and it is rapid, precise and cost-effec- tivetoo.
Do you use different types ofsamples?
That is no problem for the ESAT. It can analyze the glu- cose concentration of whole blood, plasma and serum.
Eppendorf even delivers special tubes for blood with- drawal.
Eppendorf -
Netheler - Hinz GmbH P.O. Box 65 06 70 D-2000 Hamburg 65 Telephone (040)-53801 -Q Teletex no: 403061 = EGHAM Telefax (0 40) 5 38 01556
G/ucose analysis in seconds
Do you require rapid results for a STAT sample?
ESAT can process a STAT sample in less than a minute.
Do you receiVe samples round the dock?
The ESAT is always prepared - it is ready for Operation 24 hours a day.
Is your time of the essence?
You will still find time for the ESAT, äs it requires a
minimum of operational effort The analysis of the glucose concentration is fully
automatic. Reliable data is ensured due to the analyzer's self-checking System.
Are you looklng for an all·
round solutlon?
Put us to the test. Eppendorf is your ideal partner. We offer you the complete program for your ESAT analyzer.
Qualityyou can relyon
852
Riedel et al,: Hydroxyproline, glycine and serine concentrations in plasraa of haemodialysis patientsbeen shown experimentally (2) that hydroxyproline is
the main biosynthetic precursor of serine in the prox- imal tubulus of the kidney. Glycine is an intermediate in the degradation of hydroxyproline, and it also serves s precursor of serine biosynthesis. Plasma concentrations of serine are usually lowered in uraemic patients (3, 4). A disturbance of serine bio- synthesis might therefore be reflected by an elevated concentration of plasma hydroxyproline, although other pathways of glycine and serine must be taken into consideration in making this Interpretation.
Proline 4-Hydroxyproline J
02
-3-Hydroxypyrrolidine-5-carboxylate
4-Hydroxyglutamate
Oxalacetate
-i As pa r t te
4-Hydroxy-2-oxoglutarate
l
C°2 Tetrahydro- folate
Glyoxylate
, i
* tGlycine Serine »11
Fig. 1. Pathway of hydroxyproline metabolism in serine bio- synthesis (2).
Haemodialysis patients are normally anaemic. Some metabolic disturbances in haemodialysis patients are therefore closely related to their anaemia (5). This is in part accounted for by the reduced erythropoietin biosynthesis of the diseased kidney. The reduced os- motic resistance of erythrocytes in cases of elevated plasma concentrations of parathyrin might also con- tribute to anaemia (6). Erythropoietin produced by genetic engineering techniques can now be sed to treat anaemia in haemodialysis patients. In the present study, we have determined aspartate, glycine, proline, hydroxyproline and serine in the plasma of haemo- dialysis patients and healthy subjects, and we have investigated the extent to which the disturbed metab- olism of these mino acids in haemodialysis patients undergoing erythropoietin therapy can be infltienced by reducing anaemia.
Materials and Methods Patients
Eighteen healthy subjects and 39 haemodialysis patients were included in the study. Fourteen of the haemodialysis patients were selected for erythropoietin therapy.
The control group included 6 male and 12 female persons from 21 to 56 years of age. The patient group included 15 men and 24 women from 21 to 76 years of age. Tne erythr poietin group included 2 men and 12 women from 26 to 76 years of age, who were suffering from nephronophthisis (n = 1), nephirosclerosis (n = 2), analgesia nephropathy (n = 4), glomerulonephritis (n = 3), nephrolithiasis with interstitial nephritis (n = 2) aiid chronic pyelonephritis (n = 2). The patients were haemodia- lysed 3 times a week for 4—5 hours over a period of 15 t 111 months. In the erythropoietin groupj the patients were injected intravenously with 100 U erythropoietin per kg body weight after each dialysis. When a h emoglobin concentration of 100 g/l was reached, the patients were maintained at this level by individual dose reduction. Before and in course pf erythropoi- etin therapy, all patients received phosphate lowering drugs if necessary. In course of the study 6 patients interrupted the therapy. With the consent of the patients, blood samples were collected by vein puncture in heparinized Sarstedt safety mono- vettes before dialysis. Recombinant human erythr poietin s freeze dried substance (BM 06.019) was a gift from Fa. Boeh- ringer Mannheim GmbH.
Methods Samples
Blood samples were centrifuged for 10 minutes at 3000g, and 200 μΐ plasma portions were immediately lyophilized and stored at -20°C.
Amino acid analysis
The following methods for amino acid analysis were pplied (T)·
1. Reagents and equipment
Extraction buffer: 800 ml methanol H- 200 ml 50 mmol/1 sodium acetate pH 7.0.
Borate buffer: 0.5 mol/1 pH 9.5.
Reagent I: 50 mg -phthaldialdehyde in 4.5 ml methanol, 500 μΐ borate buffer and 50 μΐ 2-mercaptpethanol.
Reagent ίί: 50 mg -phthaldialdehyde in 4.5 ml methanol and 500 μΐ borate buffer.
Eluent A: 220 ml methanol + 780 ml 50 mmol/1 sodium acetate pH 7.0.
Eluent B: 750 ml methanol -i- 250 ml 50 mmol/1 sodium acetate pH 7.0.
Reagent III: 50 mg 7-chloro-4-nitrobenz-2-oxa-1.3-diazole in 5 ml methanol.
The following HPLC equipment was used: Du Pont 850 System, Kontron fluorescence detector SFM 23, Lichrospher RP 18 (5 μπα) column (25 cm, 4.6 mm id.).
2. Serine, glycine, aspartate detennination
Lyophilisates were extr cted with 1000 μΐ extraction buffer.
Extracts (500 μΐ) were mixed with 200 μΐ borate buffer, 50 μΐ internal Standard (2 μg hofrioserine) and 100 μΐ reagent I. After a reaction time of 10 minutes the reaction was stopped by addition of 50 μΐ 0.1 mol/1 HC1. The reaction mixture (50 μΐ) was diluted l: 5 with eluent A and 50 μΐ of this dilution were injected onto the HPLC column. >
Elution gradient conditions: 20 minutes 10-^30% eluent B, linear; 20 minutes 30—100% eluent B, linear; 5 minutes 100 — 10% eluent B, linear.
Detection: Excitation at 330 nm, emissi n at 450 nm.
J. CKn. Chem. Clin. Biochem. / Vol. 27,1989 / No. 11
Riedel et al.: Hydroxyproline, glycine and serine concentrations in plasma of haemodialysis patients 853 3. Proline, hydroxyproline determination
To the lyophilised plasma sample were added 500 μΐ extraction buffer, followed by vortexing then centrifugation for l minute at 3000 g. The extract (200 μΐ) was mixed wilh 100 μΐ borate buffer, 25 μΐ internal Standard (2 μΐ 3.4-dehydroproline) and 50 μΐ reagent II and incubated for l minute at 60 °C. Reagent III (50 μΐ) was added and the mixture was incubated for 5 minutes at 60 PC. After addition of 25 μΐ 2 mol/1 HC1 and l: 5 dilution with eluent A, 50 μΐ were injected onto the HPLC column.
Elution gradient conditions: 15 minutes 10—50% eluent B, exponent 2; 5 minutes 50-100% eluent B, linear.
Detection: Excitation at 470 nm, emission at 530 nm.
The direct extraction of lyophilisates results in recoveries of amino acids up to nearly 100%. Coefficients of Variation for determination were (in series and from day to day, n = 5):
serine 6.2%, 5.6%; glycine 7.0%, 8.2%; aspartate 4.6%, 8.6%;
proline 3.4%, 2.5%, and hydroxyproline 2.7%, 2.4%.
Haemoglobin assay
Haemoglobin was determined s haemiglobin cyanide (Mercko-
test 3317, Fa. Merck). l
Parathyrin assay
Parathyrin was measured using the Human N-Tact Parathyroid Hormone-Radioimraunoassay Kit No 6900 by INC-Immuno Nuclear (Fa. IBL, Hamburg). Intact parathyrin is present in normal plasma at a concentration of ~ 5 pmol/1. Plasma also contains biologically inactive fragments (mid-region-sequence 35—64 and C-region sequence 65 — 84) at a ratio to intact parathyrin of 100:1. These inactive fragments cross-react with most parathyrin radioimmunoassays (8). The N-Tact Para- thyrid Hormone kit overcomes these obstacles by an extraction and concentration procedure using speciflc adsorption particles, which remove intact parathyrin and N-terminal-fragments. The correlation between biologically active parathyrin and the val-' ues determined with this kit is 95%.
Results
Haemodialysis patients showed elevated plasma con- centrations f glycine, hydroxyproline and proline, and significantly lowered serine values, compared with the coiitrol group (tab. 1). Plasma concentrations of hydroxyproline and parathyroid hormone (N-termi- nal immunoreactive parathyrin) showed no or only
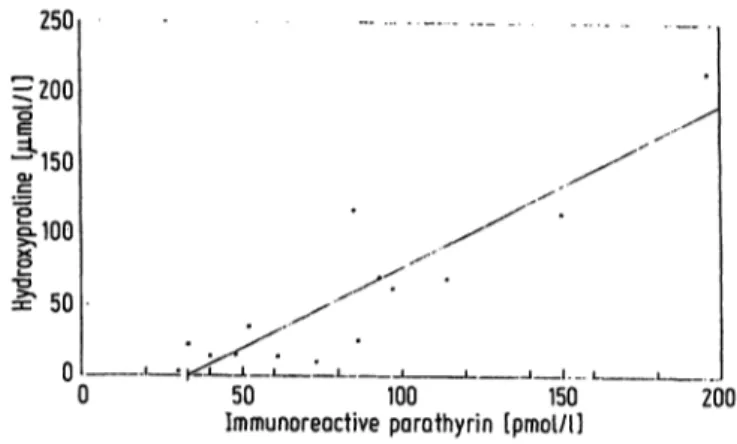
very poor correlation in haemodialysis patients:
y = 0.68 χ + 10.5 (r = 0.54) (y = hydroxyproline concentration μπιοΐ/ΐ, χ = N-terminal immunoreac- tive parathyrin concentration pmol/1). A correlation between plasma concentrations of hydroxyproline and N-terminal immunoreactive parathyrin was found, however, in all patients (n = 16) showing highly ele- vated plasma N-terminal immunoreactive parathyrin (> 30 pmol/1); y = 1.15 χ - 38.34 (r = 0.79) (fig.2).
250
§200
-150 l
1100
= 50
50 "" 100 "" 150"l
Immunoreactive parathyrin [pmol/U 200 Fig. 2. Correlation of plasma concentrations of free hydroxy- proline (Hyp) and parathyroid hormone (N-terminal immunoreactive parathyrin, i-PTH) in haemodialysis patients (n = 14)
= 1.15 CJ.PTH - 38.34 (r = 0.79).
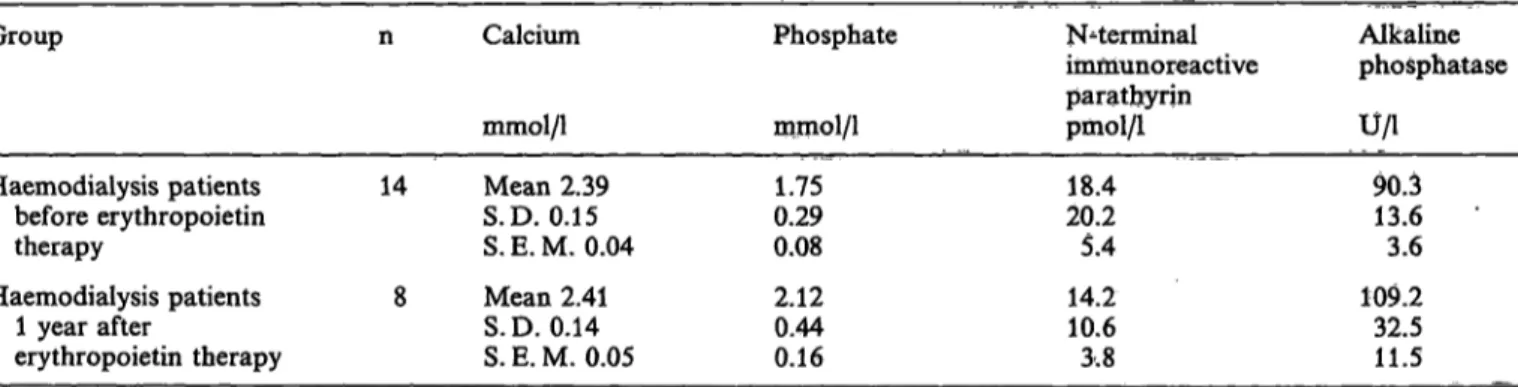
The success of the erythropoietin therapy can be mon- itored by the determination of blood haemoglobin (tab. 2). The desired haemoglobin content of 100 g/l was attained after approximately 12 weeks. In the 14 patients before erythropoietin therapy, plasma levels of N-terminal immunoreactive parathyrin were 22.9
± 27.0 prnol/1. One year after the beginning of ther- apy the levels of N-terminal immunoreactive para- thyrin wefe 14.2 + 10.6 pmol/1. The plasma levels of calcium, inorganic phosphate and alkaline phospha- tase were slightly but not significantly increased dur- irig the course of the erythropoietin therapy (tab. 3).
Tab. 1. Free concentrations of amino acids in the plasma of healthy subjects (controls) and haemodialysis patients. Significance of t values by Studenfs t index p < 0.10 (*), p < 0.05 (**), p < 0.01 (***).
Group n
Controls 18
Haemodialysis group 39
MeanS.D.
S. E. M.
MeanS.D.
S. E. M.
Proline μηιοΐ/l 19235
8 239*70
11
Hydroxy- proline μπιοΐ/l 10.75.0
1.2 24.2**
15.22.4
Proline/
hydroxy- proline 21.19.6
2.3 14.5**
9.81.6
Glycine μπιοΐ/ΐ 19652 ' 11
333***
15525
Serine μιηοΐ/ΐ 94.717.6
4.2 68.5***
19.03.0
Aspartate μηιοΐ/ΐ
4.22.2 0.5 11.5***
6.41.0
J. Clin. Ohem. Clin. Biochem. / Vol. 27,1989 / No. il
854
Riedel et al.: Hydroxyproline, glycine and serine concentrations in plasma of haemodialysis patients Tab. 2. Haemoglobin plasma concentrations (g/l) in 14 hae-modialysis patients in the course of erythropoietin ther- apy before, 4 weeks and l year after beginning of the therapy. Eighteen healthy subjects served s controls.
Significance of t values by Student** i index in reference to therapy Start p < 0.05 (**), p < 0.01 (***).
Group Controls
Haemodialysis group Before erythropoietin therapie
4 weeks
erythropoietin therapy 12 weeks
erythropoietin therapy 1 year
erythropoietin therapy
• \
n Haemoglobin 18 Mean
S.D.S. E. M.
14 Mean S.D.S. E. M.
14 Mean S.D.S. E. M.
13 Mean S.D.S. E. M.
8 Mean S. E. M.S.D.
g/l 138.5
15.73.7
61.614.8 4.0 79.1**
15.14.0 94.4***
18.95.3 93.2***
16.45.8
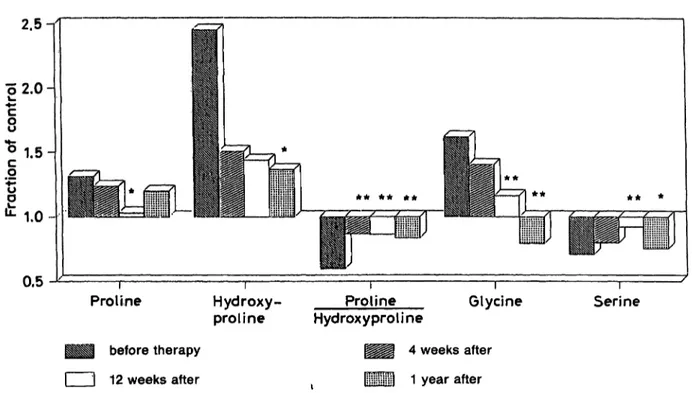
Surprisingly, there is a significant increase in the plasma concentration of serine, and a simultaneous, significant drop in the glycine and hydroxyproline concentrations during the correction of the anaemia (tab. 4). The slightly elevated proline concentrations observed in haemodialysis patients ret rn to normal values after 12 weeks of erythropoietin therapy.
After one year of therapy the patient group was reduced to 8 patients. In this group, proline increased slightly and serine decreased slightly, compared with the values at 12 weeks, whereas hydroxyproline con- centf ations decreased further to a normal level (fig. 3).
Discussion
The occurrence of elevated glycine, hydroxyproline and proline concentrations s well s lowered serine concentrations in the plasma of patients with chronic renal disease has been known for some time (1> 3, 4, 10). However, the age^dependent increase of plasma levels of hydroxyproline should also be taken irito
Tab. 3. Concentrations of calcium, inorganic phosphate, parathyroid horm ne (N^terminal immunoreactive parathyrin), and alkaline phosphatase (EC 3.1.3.1) in the plasma of patients before and l year after beginning of erythropoietin therapy.
Group
Haemodialysis patients before erythropoietin therapy
Haemodialysis patients 1 year after
erythropoietin therapy
n Calcium mmol/1 14 Mean 2.39
S.D. 0.15 S. E. M. 0.04 8 Mean 2.41
S.D. 0.14 S. E. M. 0.05
Phosphate mmol/1 0.291.75 0.08 2.120.44 0.16
N^terminal iinmunoreactive parathyrin pmol/1 20.218.4
5.4 14.210.6 3.8
Alkaline phosphatase U/l
90.313.6 3.6 109.2 32.511.5
Tab. 4. Concentrations of free amino acids in the plasma of 14 haemodialysis patients in the course of erythropoietin therapy before and 4, 12 weeks and l year after beginning of therapy. Significance oft values by Student'* t index see table 1.
Group n
Haemodialysis group 14 Before erythropoietin therapy
4 weeks 14 erythropoietin therapy
12 weeks 13 erythropoietin therapy 1 year 9 erythropoietin therapy
. .. _.
MeanS.D.
S.E.M.
MeanS.D.
S. E. M.
MeanS.D.
S. E. M.
MeanS.D.
S. E. M.
Proline μπιοΐ/ΐ 25275
20 23769 19 198*66
18 23052 17
Hydroxy- Proline/
proline hydroxy- μιηοΐ/ΐ proline 26.220.7
5.5 16.19.0 2.5 15.413.6 3.8 14.6*
5.01.7n
12.67.7 2.1 18.3**
9.22.5 18.2**
9.62.7 17.6**
4.61.5
Glycine μηιοΐ/ΐ 317113
30 27579 22 228**
5616 155***
4415
Serine μπιοΐ/ΐ 67.015.8
4.2 22.475.6 6.2 87.3**
32.28.9 71.4*
13.94.6
Aspartate μπιοΐ/ΐ 11.14.2
1.1 12.09.1 2.4 21.6***
10.02.8 19.2***
6,52.2
J. Clin. Chem. Clin. Biochem. / Vol. 27,1989 / No. 11
Riedel et al.: Hydroxyproline, glycine and serine concentrations in plasma of haemodialysis patients 855
2.5 n
o 2.0-
ou1.5-
E
u1.0-
0.5
Pro l ine
betöre therapy l l 12 weeks after
Hydroxy-
proline Proline Glycine Serine
Hydroxyproline
4 weeks after ilil 1 year after
Fig. 3. Fraction of control (line 1.0, 18 healthy subjects) of plasma levels of amino acids in 14 haemodialysis patients in the course of erythrppoietin therapy calculated äs follows: [(patients plasma amino acid level — control plasma amino acid level) -4- control plasma amino acid level]. Significance oft values by Sludenfs t index p < 0.10 (*), p < 0.05 (**) related to values before erythropoietin therapy.
consideration. The control group in our study had a mean age of 42.4 +11.2 years, while the mean age of the patient group receiving erythropoietin therapy was 63.7 ± 13.4 years. Gilbertson et al. (11) have proposed a procedure for calculating the age-depend- ent normal plasma levels of total hydroxyproline (pro- tein-bound + peptide-bound + free). In our study we have so far measured only the free hydroxyproline plasma levels. On the basis of the Gilbertson rule, for a median age difference of 21.3 years we should cor^
rect the total hydroxyproline plasma levels by about 6%. The differences between control and patient plasma levels of free hydroxyproline in our study were in the ränge of 144 äs to 36% (fig. 3), i. e. far greater than the age-dependent differences.
A comparison of the plasma cpneentrations of hy- droxyproline with those of parathyrin showed initially no correlation in the haemodialysis patients. How- ever, the higher the parathyrin values, the more strongly they were corfelated (fig. 2). According to Varghese et al. (1), elevated hydroxyproline values also occur without evidence of osteodystrophies. We found strongly elevated hydroxyproline values (> 30 / ) without excessively elevated parathyrin values (< 10 pmol/1) in 6 (out of 39) haemodialysis patients, but not one case of low or normal hydroxyproline values with parathyrin values > 30 pmol/1.
Elevated hydroxyproline concentrations in plasma ap- pear to be the result of metäbolic disturbances äs well
äs the marker symptom of osteodystrophies. In ad- dition, in patients suffering from renal failure, the impaired tubular reabsorption of amino acids must be considered. The unexpected drop in glycine, hy- droxyproline and proline concentrations and the in- crease in serine concentrations towards a normaliza- tion of the amino acid level in course of the eryth- ropoietin therapy suggests a correction of amino acid metabolism, including hydroxyproline. In the early phase of therapy (first 12 weeks), the decrease of plasma hydroxyproline concentrations showed a scat- ter (for Standard deviations, see tab. 4). After one year of therapy this scatter vanished, and the differ- ences became significant.
Serine is mainly produced in liver and kidney from the pfecursor glycine, involving the enzyme serine hydroxymethylase
1) and the cofactor tetrahydrofolic acid (2). During the depletion of the glycine pool, there is a simultaneous degradation of plasma hy- droxyproline to produce more glycine. In an inter- mediate Step, transamination between 4-hydroxy-L- glutamate and oxalacetate produces 4-hydroxy-2-oxo- glutarate and aspartate.
In the course of the erythropoietin therapy, the plasma concentrations of aspartate increase (p < 0.01). It is possible, however, that less hydroxyproline is pro- duced during erythropoietin therapy, so that the re- duction in hydroxyproline might indicate an improve- ment in the osteodystrophic Situation (see Varghese
J. Clin. Chem. Clin. Biochem. / Vol. 27,1989 / No. fl
856 Riedel et al.: Hydroxyproline, glycine and serine concentrations in plasma of haemodialysis patients
et al. (1)). Further evidence for this assumption seems to be the significant increase in the ratio, proline/
hydroxyproline, during the therapy. Measurements of calcium, inorganic phosphate and alkaline phospha- tase showed no significant changes during erythropie- tin therapy. However, all patients received continu- ously phosphate lowering drugs, which influence these analytes. Hence this question cannot been settled on the basis of the plasma concentrations alone, but requires detailed biochemical investigations.
Doubtless the plasma concentrations of amino acids in haemodialysis patients during erythropoietin ther- apy might be influenced by dietary habits (4). The patients were informed about the necessity to elimi- nate such potential influences, and blood samples were taken in the morning after overnight fasting.
Nevertheless, in normal adult subjects who underwent starvation, the plasma concentrations of aspartate (—40%) and proline (—23%) were diminished, while those of glycine (+44%) and serine (+9%) were elevated (12)": In our haemodialysis patients, the plasma concentrations of aspartate (+169%), proline (+31%) and glycine (+62%) were elevated, while that of serine (—29%) was decreased. These values
agree with reports of Chami et al. (3), Young et al.
(4), Druml et al. (14) and others. We shoiild expect an increase in the plasma levels of aspartate and proline and a decrease of glycine and serine äs positive nutritional effects. However, in our patients we see during the erythropoietin therapy an increase in as- partate, but a decrease in proline
fand glycme, and an increase in serine, although after one year of therapy the trend towards the normalization of proline and serine is slightly reversed (fig. 3), Hence the measured effects on amino acid metabolism in the coürse of erythropoietin therapy were orily partly explained by better nutrition. Without any doubt, however, deter- minations of amino acid plasma concentrations, which have been greatly facilitated and irnproved by the newly developed high pressure liquid Chromato- graphie fluorescence technique, will be of considerable help in monitoring the coürse of the disease and the therapy of haemodialysis patients.
Acknowledgement
We are gratefül to Mrs. Gisela Wendel and Mrs. Heidi Schröder for excellent technical and secretarial assistance.
References
1. Varghese, Z., Moorhead, J. F. & Wills, M. R. (1981) Plasma hydroxyproline fractions in patients with dialysis osteodys- trophy. Clin. Chim. Acta HO, 105-111.
2. Lowry, M., Hall, D. E. & Brosnan, I. T. (1985) Hydroxy- proline metabolism by the rat kidney: distribution of renal enzymes of hydroxyproline catabolism and renal conver- sion of hydroxyproline to glycme and serine. Metabolism 34,955-561.
3. Chami, J., Reidenberg, M. C., Wellner, D., David, D. S., Rubin, A. & Stenzel, K. (1978) Pharmacokinetics of essen- tial amino acids in chronic dialysis patients. Am. J. Clin.
Nutr. 31, 1652-1659.
4. Young, G. A., Swanepoel, C. R., Croft, M. R., Hobson, S.
M. & Parsons, F. M. (1982) Anthropometry and plasma valine, amino acids and proteins in the nutritional assessr ment of hemodialysis patients. Kidney International 21, 492-499.
5. Eschbach, J. W. & Adamson, J. W. (1985) Anemia of end- stage renal disease. Kidney International 28, 1—5.
6. Bogin, E., Massry, S. G., Levi, J., Djaldeti, M., Bristol, G.
& Smith, J. (1982) Effect of parathyroid hormone on os- motic fragility of human erythrocytes. J. Clin. Invest. 69, 1017-1025.
7. Riedel, E., Algermissen, B. & Nündel, M. (1988) Improved HPLC determination of free amino acids and amines in biological fluids by precolumn fluorescence derivatization.
J. Prot. Chem. 7, 278-279.
8. Mallette, L. E., Tuma, S. N., Berger, R. E. & Kirkland, J.
L. (1982) Radioimmunoassay for the middle region of hu- man parathyroid hormone using an homologous antiserum with a carboxy-terminal fragment of bovine parathyroid hormone äs radioliganä. J. Clin. Endocrinol. Metab. 54, 1017.
9. Ali Qureshi, G., Fohlin, L. & Bergström, J. (1984) Appli- cation of HPLC to the determination of free amino acids in physiological fluids. J. Chromatogr. 297, 91—100.
10. Minisola, S., Antonelli, R. & Mazzuoli, G. (1985) Clinical significance of free hydroxyproline measurement in meta^
bolic bone disease. J. Clin. Chem. Clin. Biochem. 23, 515—
11. Gilbertson, T. J., Brunden, M. N., Gruszczyk, S. B., Whyte,519.
M. P. & Burnett, M. A. (1983) Serum total hydroxyproline assay: effects of age, sex and Paget's bone disease. J. Clin.
Chem. Clin. Biochem. 21, 129 — 132.
12. Albert, J. D., Legaspi, A., Horowitz, G. D., Tracey, K. J., Brennan, M. F. & Lowry, S. F. (1986) Extremity amino acid metabolism during starvation and intravenpus refeed- ing in humans. Am. J. Physiol. 257, E 604—610.
13. Fitch, W. L. & King, J. C. (1987) Plasma amino acid, glucose, and insulin responses to moderate-protein and high-protein test meals in pregnant, nonpregnant, and ges- tational diabetic women. Am. J. Clin. Nutr. 46, 243—249.
14. Druml, W., Bürger, U., Kleinberger, G., Lenz, K. & Lag- gner, A. (1986) Elimination of amino acids in acute renal failure. Nephron 42, 62—67.
Prof. Dr. Eberhard Riedel Institut für Biochemie der Freien Universität Berlin Limonenstraße 7
D-1000 Berlin 45
J. Clin. Chem. Clin. Biochem. / Vol. 27,1989 / No. 11