Bioluminescent Methods for Determining Metabolites in Micro-Samples of Pig Plasma
1)
Melinda J. Thompson, Peter G. Arthur and Peter E. Hartmann
Department of Biochemistry, The University of Western Australia, Neulands, Australia
Summary: A highly sensitive and simplified method for the luminometric determination of plasma metabolites has been developed. Furthermore, the technique has been automated for the Dynatech ML2250 Microtiter Plate Lurnino- meter and can be applied to the measurement of any plasma metabolite which may be coupled to a reaction involving the reduction of NAD+. Assays are described for lactose/galactose, -hydroxybutyrate and £>-lactate, and have been validated with plasma samples. The assays require 1 — 2 μΐ of plasma, and are capable of detecting concentrations below 5 μηιοΐ/ΐ. Since luminometry is based on the kinetics of the luciferase/oxidoreductase enzyme system, components of complex biological samples may interfere with the rate of the reaction; necessitating the use of internal standards for individual samples. However, the need for internal standards to account for sample to sample variation in the luminescent response, has been eliminated with the present technique.
Introduction
Luminometry involving bacterial luciferase2) is based on the production of light during a two stage reaction catalyzed by luciferase and NAD(P)H:FMN oxidoreduc- tase2), and requiring reduced nicotinamide adenine dinu- cleotide (NADH), flavin mononucleotide (FMN), a long chain aldehyde and molecular oxygen. When all other substrates are present in excess, the rate of light pro- duction is dependent upon the concentration of NADH.
Thus, pre-existing assays involving the production of NAD(P)H may be coupled to a luminescent reaction, providing greater sensitivity than can be obtained in either a spectrophotometer or fluorometer (1—2).
Recent advances in bioluminescent assays (1—3) have decreased the volume of sample required for the analysis of multiple metabolites. This allows frequent blood sam- pling from small animals without a significant reduction in blood volume. Furthermore, it is often advantageous to collect finger-prick blood samples from humans.
!) Funding Organisation:
Pig Research and Development Corporation of Australia
2) Enzymes:
Galactose dehydrogenase:
D-Galactose : NAD+ 1-oxidoreductase (EC 1.1.1.48);
-Galactosidase:
-Z)-Galactoside galactohydrolase (EC 3.2.1.23);
Hydroxybutyrate dehydrogenase:
[R]-3-Hydroxybutanoate : NAD+ oxidoreductase (EC 1.1.1.30);
D-Lactate dehydrogenase:
[R]-Lactate : NAD+ oxidoreductase (EC 1.1.1.28);
Luciferase:
Alkanal: reduced-FMN-oxygen oxidoreductase (EC 1.14.13.3);
Oxidoreductase:
NAD(P)H : FMN oxidoreductase (EC 1.6.8.1).
However, the usefulness of bioluminescence as an ana- lytical tool has been hindered by the expense and limited stability of the reagent (1). Furthermore, previously de- scribed bioluminescent assays have presented measure- ments either from standards and not biological samples, or have required internal standards to account for the interference from the samples (2, 4, 5).
We have developed a semi-automatic procedure which allows the rapid measurement of any plasma metabolite which can be coupled to a NADH-producing reaction.
In addition to decreasing the cost of the assays, and increasing the stability of the reagents, the sensitivity of the technique described here has allowed large dilution of the sample, thus removing sample-specific inhibition of the kinetic, bioluminescent reaction.
The assays described here were chosen for their possible clinical significance. Plasma lactose may provide an in- dication of gastrointestinal disorders associated with increased gut permeability (6), while increases in the plasma concentration of -hydroxybutyrate and D-lac- tate are associated with ketosis and acidosis, respec- tively.
Materials and Methods Materials
All reagents were prepared from analytical grade chemicals and were dissolved in de-ionized water.
Bioluminescent reagent
The first step in the assays was the metabolite-specific reaction resulting in the production of NADH; the reagents for which are described below. However, the measurement of the NADH through the bioluminescent reaction was common to all the assays and the
reagent was prepared as described by Arthur & Hochachka (3) with the following modifications. The reagent contained potassium phosphate (100 mmol/1), bovine serum albumin (essentially fatty acid free; 16 g/1), EDTA (disodium salt; 4 mmol/1), FMN (8 μηιοΐ/l), tetradecanal (Aldrich Chemical Co., NY: 1 g/1) and lu- ciferase2) (Sigma Chemical Co.: EC 1.14.14.3: protein 0.2 g/1) in tris[hydroxymethyl]methyl-2-aminoethanesulphonic acid (TES) buffer (300 mmol/1, pH 6.8) and was aliquoted and frozen at -80 °C. The reagent was stable for at least four months if stored at —80 °C and protected from light. The addition of a second en- zyme was not required since the luciferase preparation was con- taminated with oxidoreductase. The light response obtained was similar to previous experiments (1, 3) which used pure enzyme preparations of luciferase (6 mg/1 final reaction volume) and oxi- doreductase (33 U/l final reaction volume), however, the impure Sigma preparation represented a significant reduction in cost.
Reagents for metabolite assays
The -hydroxybutyrate assay was based on the conversion of - hydroxybutyrate to acetoacetate by hydroxybutyrate dehydroge- nase2) (Boehringer Mannheim, North Ryde, Australia: EC 1.1.1.30), with the co-production of NADH. The assay was adapted from an existing spectrophotometric iron-chelate assay (7). Since the equilibrium for -hydroxybutyrate dehydrogenase is unfavour- able for acetoacetate formation (8), the reaction was driven with hydrazine. Reagent A for -hydroxybutyrate, containing hydrazine sulphate (50 umol/1), NAD+ (250 umol/1), and hydroxybutyrate dehydrogenase (40 U/l) in TES buffer (0.1 mol/1, pH 8.4), was prepared fresh for each sample set. The ammonium sulphate sus- pension of hydroxybutyrate dehydrogenase was unsuitable for long term storage of the enzyme. However, resuspension in a buffer containing calcium chloride (1 mmol/1) in potassium phosphate (10 mmol/1; pH 7) allowed storage of the enzyme at -20 °C (9), and decreased the background readings.
The D-lactate assay was a modification of an existing fluorometric assay (10) involving conversion by Z)-lactate dehydrogenase2) (Sigma Chemical Col, Missouri, USA: EC 1.1.1.28). Reagent A for D-lactate was prepared fresh and contained hydrazine sulphate (5 mmol/1), ascorbic acid (2 mmol/1), NAD+ (2 mmol/1) and D- lactate dehydrogenase (51 kU/1) in glycine buffer (l mol/1, pH 9).
A spectrophotometric assay for the determination of galactose (11) was modified for the measurement of lactose on the luminometer.
Lactose was hydrolyzed by -galactosidase2) (Boehringer Mann- heim: EC 3.2.1.23) and the galactose moiety reacted in the pres- ence of galactose dehydrogenase2) (Boehringer Mannheim: EC 1.1.1.48). The reagents for the measurement of lactose could be prepared in advance, were stable, and showed no increase in back- ground readings, if stored on ice for 24 hours. Lactose reagent A (for hydrolysis of lactose) contained MgCl2 (1.9 mmol/1) and - galactosidase (3 kU/1) in potassium phosphate buffer (85 mmol/1, pH 8), while reagent B (for oxidation of galactose) contained MgCl2 (1.9 mmol/1), NAD+ (2.9 mmol/1) and galactose dehydroge- nase (1.2 kU/1) in potassium phosphate buffer (85 mmol/1, pH 8).
Apparatus
Working standards were checked on a Titertek Multiskan® MCC/
340 plate reader (Flow Laboratories, McLean, VA, USA). Other- wise a Dynatech ML2250 Microtiter Plate Luminometer (Dynex, Chantilly, VA, USA) was used.
Plasma samples
Blood samples (60 μΐ) were taken from the ear vein of 11 Landrace and Large White (pure and cross-breed) piglets according to the method of Holmes et al. (11). Plasma was separated by centrifuga- tion at 3000 g for 5 minutes, deproteinized with perchloric acid (0.6 mol/1) and neutralized according to the method of Arthur et al. (1), and buffered (0.1 mol/1; pH « 7) with either glycine (D- lactate assay) or phosphate ( -hydroxybutyrate and lactose) before being stored at —20 °C. Blanks consisting of de-ionized water,
standards, and plasma samples used as quality controls, were also deproteinized with each set of samples.
Procedure
Deproteinized samples were planted onto 96-well V-bottomed plates (Flow Laboratories, McLean, VA, USA) and reagent added.
Assay conditions for the metabolite-specific reactions are outlined in table 1. All samples were measured in duplicate. Two sets of sample duplicates were used in the lactose assay; one set was incu- bated with reagent A minus the -galactosidase to account for the concentration of free galactose in the plasma.
The final reactions were stopped with the addition of 150 μΐ of sodium hydroxide (10 mmol/1). Aliquots (5 μΐ) from each well were transferred to an opaque, white Microlite® 96-well round- bottomed plate, further diluted with 10 mmol/1 sodium hydroxide (40 μΐ) and then 15 μΐ of bioluminescent reagent was injected. The luminometer was programmed for a 5 second delay after addition of the bioluminescent reagent, followed by a 1 second read period.
The peak and mean light response over the latter period was calcu- lated. In all cases, the mean light response was used. Samples were repeated if duplicates differed by more than 10%.
Results
Bioluminescent assay
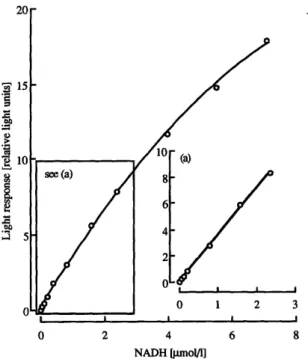
The 5 second delay period after injection of the biolumi- nescent reagent was sufficient to ensure that the kinetic reaction had reached a plateau before the response was read for a further 1 second. The reaction was not limited by substrate supply over this period (fig. 1). The detec- tion limit of the bioluminescent assay, defined as the lowest concentration of NADH in the reaction well that was significantly different from the mean (n = 4) light response of the blanks (at 99% confidence) was 0.5 nmol/1, and the response was linear (r2 = 0.999) to 2.5 μιηο1/1οίΝΑΟΗ(Γ^.2).
Standard curves
The reactions were checked to ensure that they had reached completion within the incubation time and that there was no drift reactions due to contaminating en- zymes or metabolites. To check accuracy, the standards of -hydroxybutyrate, .D-lactate and lactose were re- acted, and the change in absorbance at 340 nm checked against known concentrations of NADH. The light re- sponse to deproteinized standards increased linearly
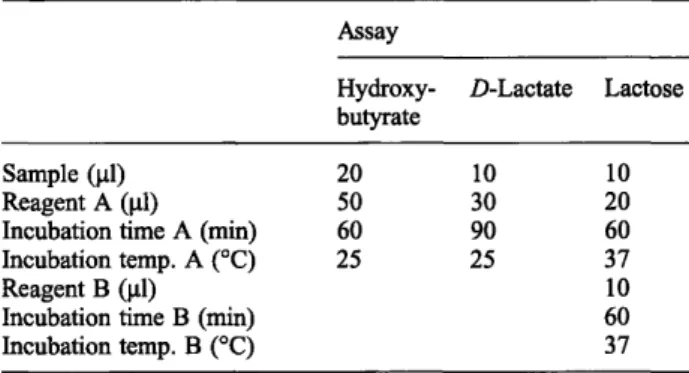
Tab. 1 Details of metabolite assays Assay
Hydroxy- Z)-Lactate Lactose butyrate
Sample (μΐ) Reagent Α (μΐ) Incubation time A (min) Incubation temp. A (°C) Reagent Β (μΐ)
Incubation time B (min) Incubation temp. B (°C)
2050 6025
3010 9025
2010 6037 6010 37
(r2 ^ 0.998) with an increase in the concentration of the standards up to 1 mmol/1.
Recoveries, imprecision and detection limit The addition of three spikes of increasing concentration (25, 50 and 100 μηιοΐ/ΐ) to aliquots of three different samples of piglet plasma showed complete recovery of the various metabolites (tab. 2). The metabolites were stable in plasma for at least 6 months if deproteinized and stored at —20 °C. The enzyme ZMactate dehydroge- nase was specific for D-lactate and did not react with the L-isomer of lactate, although the L-lactate salt (Boehringer Mannheim, Lot # 11742634-43) was con- taminated by the D-isomer (approximately 1%). Further-
10 Time [s]
15 20
Fig. 1 The light response after injection of bioluminescent rea- gent (t0) into a well containing NADH. The reagent (15 μΐ) was injected into a final volume of 60 μΐ containing approximately 2 nmol/l NADH in 7.5 mmol/1 NaOH.
20 r
13 15
•s»
I 10
•a
NADH [μιηοΐ/ΐ]
Fig. 2 Standard curve for NADH. The concentration of NADH is given as the final concentration in the luminometer reaction well.
The regression line for concentrations below 2 umol/1 (a) was y = 0.06 + 3.5x (r2 = 0.999).
more, incubation in 0.6 mol/1 perchloric acid for several hours at room temperature did not result in the racemiza- tion of L-lactate into D-lactate.
The within-plate imprecision of the luminometer was evaluated by transferring aliquots of a NADH solution to each well of the luminometer plate. The light response (RLU) was 0.674 ± 0.023 RLU (n = 96, C. V. = 3.3%) for the plate if the temperature of the machine was set at 30 °C and the plate was equilibrated for 5 minutes before being run. The reproducibility of the assays was checked by including a sample (quality control) of known concentration on all plates. The quality controls (mean ± SD) measured 133 ± 8 μηιοΙ/1 (CV = 6%;
η = 9) for ZMactate, 59 ± 3 umoVl (CV = 5%; η = 17) for lactose and 15 ± 0.6 μηιοΙ/1 (CV = 4%; η = 7) for
-hydroxybutyrate (tab. 2).
The assays had a high sensitivity (tab. 2) although dilu- tion of the sample at deproteinization resulted in a sub- stantial decrease in sample sensitivity. Thus, the sample sensitivity was defined as the lowest concentration in the undiluted sample that was significantly different (at 99% confidence) from the mean blank response.
Interference studies
Inhibition of the light response by the components of the metabolite-specific reagents was minimized by the high dilution of the initial reaction mixture prior to transfer to the Microlite® plates. The effects of the vari- ous components on the light response are given in ta- ble 3.
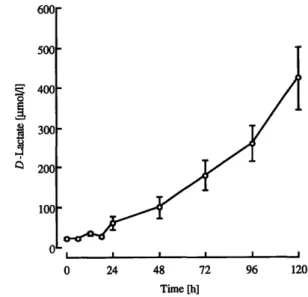
Metabolite concentrations in piglet plasma The concentration of lactose in the peripheral plasma of the piglet peaked at 24 h after birth (211 ±49 μηιοΙ/1) and decreased thereafter (fig. 3). The concentration of -hydroxybutytate in the plasma of the newborn piglets was less than 5 μηιοΙ/1. The concentration increased dur- ing the first 3 hours to 15 ± 4 μπιοΐ/ΐ and remained rela- tively stable for the duration of the sampling period (12 ± 7 μπιοΐ/ΐ). The concentration of D-lactate in the peripheral plasma of the young piglet was low at birth (22 ± 2 umol/l) but increased significantly by 72 h, and continued to increase thereafter, reaching 423 ± 79 μιηοΐ/ΐ at 120 h (fig. 4).
Discussion
The technique described here is substantially simpler than previous luminometric techniques, and has elimi- nated the need for the inclusion of internal standards to account for variation in the kinetic response between samples and between standards and samples (2).
Furthermore, this technique represents an improvement in sensitivity and a decrease in the cost of the biolumi-
Tab. 2 Recovery of known concentrations of spikes added to samples of piglet plasma, the inter-assay variation, and the sample and assay sensitivity of the metabolite assays.
Hydroxybutyrate Z)-Lactate Lactose
Recovery (%)
Mean ± SE 100 ±2
99 ±2 101 ± 3
Inter-assay variation
n 99 9
% 46 5
n 79 17
Sensitivity1
Sample3 (μπιοΙ/1) Mean ± SE n 2.1 ± 0.2 5 2.2 ± 0.2 9 2.4 ± 0.3 17
Assayb (nmol/1) Mean ± SE n
1.0 ± 0.1 5 0.6 ± 0.05 9 0.7 ± 0.08 17
1 The lowest concentration in (a) the undeproteinized sample and (b) the luminometer reaction well, that was significantly different from the mean blank (at 99% confidence).
Tab. 3 Concentration of reagent components that result in a slight (10%) or large (50%) inhibition of the light response to 500 nmol/1 NADH.
Concentration (mmol/l)a
10% inhibition11 50% inhibitionb
Ascorbic acid Hydrazine sulphate Perchlorate ions Phosphate0 Sodium hydroxide TESC
>0.070.07
>8.0
<295 2.6
0.37
>150 208.0
a The final concentration in the luminometer reaction well (i. e. in a final volume of 60 μΐ).
b The light response in the absence of the reagent component was taken as 100%.
c The light response at the concentration normally present in the diluted reagent (i. e. in a final volume of 60 μΐ) was taken as 100%.
nescent assay, and may be applied to a range of metabo- lite assays which result in NADH production, with little modification of these existing assays. In addition, the assays were developed for micro-samples of plasma from the piglet (an accessible and cost-effective medical model). The small volume of plasma required means
that less invasive blood sampling techniques may be used, such as finger, ear or heel pricks.
The ML2250 Microlite Luminometer reads each well in a 96-well plate in approximately 19 minutes, which is considerably faster than previously described methods (1, 3). The opaque Microlite® plates used for the biolu- minescent reaction maximized sensitivity and eliminated cross talk. However, in preliminary experiments it was found that the initial reactions involving the conversion of the metabolite and the co-production of NADH, did not complete in the Microlite® plates. Therefore the ini- tial reaction(s) was carried out in 96-well V-bottomed plates. The separation of the metabolite-specific reac- tion^) from the bioluminescent reaction, allowed a greater dilution of the sample and reagent, thus decreas- ing possible interference or inhibition of the biolumines- cent reactions.
Although sodium hydroxide caused some inhibition of the light response (tab. 3) the use of sodium hydroxide as a diluent served several purposes. Addition of the sodium hydroxide to the metabolite-specific reaction made the conditions sufficiently alkaline to stop enzy- matic reactions at a designated time point, thus limiting
Π
24 48 72 Time[h]
96 120
Fig. 3 Concentration of galactose and lactose in the plasma of suckling piglets over the first 120 hours after birth (to). All values given are mean ± SE (n = 11).
24 48 72
Time [h]
96 120
Fig. 4 Concentration of D-lactate in the plasma over the first 120 hours after birth (t0) in suckling piglets. All values given are mean
± SE (n = 11).
the contribution of any contaminating enzymes (3).
Furthermore, NADH is unstable at high dilution, but sta- bility can be increased if the NADH in the reaction mix- ture is in alkaline conditions (12). Ascorbic acid at a con- centration of 2 mmol/1 or greater, also stabilizes NADH (12) and was therefore included in the longer initial incu- bation for Z>-lactate. However, the final concentration of ascorbic acid in the luminometer well was kept to a mini- mum to prevent inhibition of the light response.
Evaluation of the methods showed that the precision was satisfactory and that the recoveries were quantitative.
There was some interference of the kinetic reaction (i. e.
the bioluminescent reactions) by various components of the assay mixtures, however, these were minimized with increased dilution before transfer to the Microlite®
plates. Furthermore, inhibition was standard for the plate and did not involve sample to sample variation. In early experiments, which were run at room temperature, there was a significant change in the kinetic response of the bioluminescent reagent over the plate due to temperature variations. However, the reaction plate could be main- tained at a constant ( ± 2 °C) temperature between 30 °C and 40 °C, which was sufficient to keep the variability over a plate at acceptable (< 5%) levels.
The bioluminescent assay was coupled to three assays with possible clinical applications. Measurement of plasma lactose showed that despite a continuing increase in the concentration of lactose hi the milk of the sow over the first 5 days post-partum (13—14), and the high concentration of galactose in the plasma of the piglets, there was a decline in the concentration of lactose in the piglet plasma, after 24 hours. This agrees with previous reports indicating that 'closure' of the gut of the piglet to macromolecular uptake occurs at approximately 24 to 36 hours after birth (13 — 14). Thus, this assay may have clinical applications for the investigation of gut perme- ability/damage. Furthermore, this assay could be adapted for the determination of lactulose (17—19), which would remove variation due to differences hi the hydrolytic ca- pacity between individuals.
ß-Hydroxybutyrate is the major ketone body circulating in the blood of healthy individuals (19). During ketosis the concentration, as well as the proportion of ß-hydro-
xybutyrate increases (20), although the extent of the increase is variable. The traditional diagnostic spot test detects acetoacetate and acetone, but does not react with ß-hydroxybutyrate. Thus, ketosis may be greatly, and variably, under-estimated. Several methods have been described for the kinetic measurement of ß-hydroxybu- tyrate, however, these methods differ considerably with regards to reaction conditions, and interference from un- identified causes could invalidate these methods (21).
Coupled to the bioluminescent reaction, the assay de- scribed here provides an easy, cost effective means for the identification and investigation of clinical and sub- clinical ketosis in humans and animals, using only small samples of plasma.
Acidosis due to £>-lactate is well known in ruminants after carbohydrate over-feeding (22), and has been de- scribed in man (23). The presence of D-lactate in body fluids indicates either bacterial invasion or absorption from an area of high bacterial activity, such as the gut (24). In the present study, the timing of the increase in the concentration of plasma D-lactate agreed with previ- ous reports indicating colonization of the sterile gut of the newborn piglet (25). Changes in plasma D-lactate can also be used to indicate the success of dietary man- agement of D-lactic acidosis in short bowel syndrome (26). The assay for D-lactate described in this paper, provides a sensitive and specific means for monitoring ZMactate acidosis.
The present bioluminometric method affords several ad- vantages over earlier methods for metabolite determina- tion hi plasma samples. An important improvement is the increased stability of the bioluminescent reagent, which may be stored frozen for several months. Further- more, the large dilution of sample prior to reaction with the bioluminescent reagent has completely removed sample-inhibition of the luminescence signal, which has remained a problem with modern luminometric tech- niques (2).
Acknowledgements
The authors would like to acknowledge the assistance of Miss Christine Wakeford, Wandalup Farms for the use of their facilities and animals, and the financial support of the Pig Research and Development Corporation of Australia.
References
1. Arthur PG, Kent J, Hartmann . Microanalysis of the meta- bolic intermediates of lactose synthesis in human milk and plasma using bioluminescent methods. Anal Biochem 1989;
176:449-56.
2. Jüngling E, Timmerman M, Aretz A, lonescu I, Mertens M, Löken C, et al. Luminometric measurement of subnanomole amounts of key metabolites in extracts from isolated heart muscle cells. Anal Biochem 1996; 239:41-6.
3. Arthur PG, Hochachka PW. Automated analysis of cellular me- tabolites at nanomolar to micromolar concentrations using bio- luminescent methods. Anal Biochem 1995; 227:281-4.
4. Agren A, Berne C, Brolin SE. Photokinetic assay of pyruvate in the islets of Langerhans using bacterial luciferase. Anal Bio- chem 1977; 78:229-34.
5. Stanley PE. Determination of subpicomole levels of NADH and FMN using bacterial luciferase and the liquid scintillation spectrometer. Anal Biochem 1971; 39:441-53.
6. Gryboski JD, Thayer WR (jr), Gabrielson IW, Spiro HM. Dis- acchariduria in gastrointestinal disease. Gastroenterology 1963; 45:633-7.
7. Kientsch-Engel RI, Siess EA. D-(-)-3-Hydroxybutyrate and acetoacetate. In: Bergmeyer HU, Bergmeyer J, Graßl M, edi-
tors. Methods of enzymatic analysis. Weinheim: Verlag Chemie, 1986: 8:60-9.
8. Krebs HA, Mellanby J, Williamson DH. The equilibrium con- stant of the ß-hydroxybutyrate dehydrogenase system. Bio- chemJ 1962; 82:96-8.
9. Bergmeyer HU, Gawehn K, Klotzsch H. Purification and prop- erties of crystalline 3-hydroxybutyrate dehydrogenase from Rhodopseudomonas spheroides. Biochem J 1967; 102:423 — 31.
10. McLellan AC, Phillips SA, Thornalley PJ. Fluorometric assay of D-lactate. Anal Biochem 1992; 206:12-6.
11. Hohnes MA, Arthur PG, Hartmann . Changes in the con- centrations of glucose and galactose in the peripheral blood of suckling pigs. J Dairy Res 1990; 57:331-7.
12. Passonneau JV, Lowry OH. Enzymatic analysis. A practical guide. Totowa, New Jersey: Humana Press, 1993.
13. Klobasa F, Werhahn E, Butler JE. Composition of sow milk during lactation. J Anim Sei 1987; 64:1458-66.
14. Kent JC, Arthur PG, Hartmann PE. Citrate, calcium, phosphate and magnesium in sow's milk at initiation of lactation. J Dairy Res 1998; 65:In press.
15. Lecce, JG. Effect of dietary regime on cessation of uptake by piglet intestinal epithelium (closure) and transport to the blood.
JNutrl973; 103:751-6.
16. Clarke RM, Hardy RN. Histological changes in the small intes- tine of the young pig and their relationship to macromolecular uptake. J Anat 1971; 108:63-77.
17. Behrens RH, Docherty H, Elia M, Neale G. A simple enzy- matic method for the assay of urinary lactulose. Clin Chim Actal984; 137:361-7.
18. Northrop CA, Lunn PG, Behrens RH. Automated enzymatic assays for the determination of intestinal permeability probes in urine. 1. Lactulose and lactose. Clin Chim Acta 1990;
187:79-88.
19. Wildenhoff KE. Diurnal variation in the concentrations of blood acetoacetate, 3-hydroxybutyrate and glucose in normal persons. Acta Med Scand 1972; 191:303-9.
20. Stephens JM, Sulway MJ, Watkins JP. Relationship of blood acetoacetate and 3-hydroxybutyrate in diabetes. Diabetes 1971; 20:485-9.
21. Li PK, Lee JT, MacGillvray MH, Schaefer PA, Siegel JH. Di- rect fixed time kinetic assays for ß-hydroxybutyrate and acet- oacetate with a centrifugal analyzer or a computer-backed spectrophotometer. Clin Chem 1980; 26:1713-7.
22. Dunlop RH, Hammond PB. D-Lactic acidosis of ruminants.
AnnNYAcadSci 1964; 119:1109-30.
23. Oh MS, Phelps KR, Traube M, Barbosa-Saldivar JL, Boxhill C, Carroll HJ. D-Lactic acidosis in a man with the short-bowel syndrome. New Engl J Med 1979; 394:294-52.
24. Smith SM, Eng RHK, Buccini F. D-Lactic acid measurements in the diagnosis of bacterial infections. J Infectious Dis 1986;
165:658-64.
25. Wilbur RD, Catron V, Quinn LY, Speer VC, Hays VW. The intestinal flora of the pig as influenced by diet and age. J Nutr 1970; 71:168-75.
26. Mayne AJ, Handy DJ, Preece MA, George RH, Rooth IW.
Dietary management of D-lactic acidosis in short bowel syn- drome. Arch Dis Childhood 1990; 65:229-31.
Received June 30/September 12, 1997
Corresponding author: M. J. Thompson, Centre for Mediterranean Agricultural Research, CSIRO, Private Bag, PO Wembley W.A. 6014, Australia
Tel.: +61 (0)8 9333 6670, Fax: +61 (0)893878991, e-mail: m.thompson@ccmar.csiro.au