J. Clin. Chem. Clin. Biochem.
Vol. 19,1981, pp. 457-463
A Multi-Wavelength Spectrophotometric Method for the Simultaneous Determination of Five Haemoglobin Derivatives
EyA. Zwart*, AnnekeBuursma*,E. /. van Kämpen**, B. Oeseburg*,P. H. W. van der Ploeg** and W. G. Zifktra*
* Department of Physiology, University of Groningen
** Clinical Chemical Laboratory, Diakonessen Hospital, Groningen, The Netherlands (Received April 29/November 25,1980)
Summary: A method is described by which the concentration of deoxyhaemoglobin, oxyhaemoglobin, carboxy- haemoglobin, haemigjobin and sulphaemoglobin in a human blood sample is determined by passing the haemolysate without air contact through a coarse filter and subsequently measuring the absorbance at = 500, 569, 577, 620 and 760 nm. The euouing set of equations is solved by matrix calculation with the aid of a simple computer program. The method has been tested by comparing it with conventional methods for the determination of the various haemoglobin derivatives separately.
Eine Viel-Wellenlängen Methode für die simultane spektrophotometrische Bestimmung von fünf Hämoglobinderivaten
Zusammenfassung: Eine Methode, mit der die Konzentration von Desoxyhämoglobin, Oxyhämoglobin, Carboxy- hämoglobin, Hämiglobin und Sulfhämogjobin in einer Blutprobe vom Menschen bestimmt werden kann, wird beschrie- ben. Das Hämolysat durchläuft ohne Luftkontakt ein grobes Filter; die Absorption bei = 500, 569, 577, 620 und 760 nm wird gemessen. Der sich ergebende Satz von Gleichungen wird durch Matrizen-Berechnung mit Hilfe eines einfachen Rechnerprogramms gelöst. Die Methode wurde durch Vergleich mit konventionellen Methoden für die separate Bestimmung der verschiedenen Hämoglobinderivate geprüft.
Introduction
Numerous Spectrophotometric methods have been devised for the determination of haemoglobin and its common derivatives (1). Most of these are two^wave- length methods for the analysis of two-component sys- tems. By proper preparation of the samples and/or by judicious wavelength selection, care is taken that no more than two haemoglobin derivatives determine the absorption at the two wavelengths. In most of these methods one wavelength is chosen at a cross-over point in the absorption spectra of the two components
(isosbestic wavelength), which results in a linear relation- ship between the ratio of the absorptions measured at the two wavelengths and the relative concentration of each of the components. The importance of this advan- tage, however, has diminished since simple and inexpen- sive calculators came into general use. So there is now little ground for adhering to the use of an isosbestic wavelength. In fact, in some cases it is even desirable
not to use it.This is, for instance, the case in measuring the oxygen saturation of blood independent of the possible presence
of indocyanine green, a dye commonly used for the determination of cardiac output. The absorption maxi- mum of indocyanine green almost coincides with the isosbestic point of deoxyhaemoglobin (Hb) and oxy- haemoglobin (HbO
?) at = 800 nm (fig. 1). Therefore,
= 860 nm is used instead, thus eliminating the influ- ence of the dye on the oxygen saturation measurement
(2).Until recently, the analysis of blood samples containing more than two haemoglobin derivatives has been much more difficult. Nevertheless, various methods have been developed, especially for the simultaneous determina- tion of carboxyhaemoglobin (HbCO) and haemiglobin (methaemoglobin; Hi) (3, 4, 5), or HbCO, Hi and sulph- haemoglobin (SHb) (6). All these methods are rather cumbersome. They involve elaborate preparatory meas- ures and the determination of correction factors or the use of special nomograms. Extensive manipulation of the blood samples is especially undesirable when Hb and HbO
2have to be measured in addition to one or more dyshaemoglobins (HbCO, Hi, SHb) (7), as any contact with air may cause a change in oxygenation.
0340-076X/8 1/001 9-0457S02.00
© by Walter de Gruyter & Co. - Berlin · New York
0.020 Q015
i / l 0,010
0,005
450 500. 550 600 650 650 700 750 ÈÏÏ 850 ëÀçðé] Xtnm]
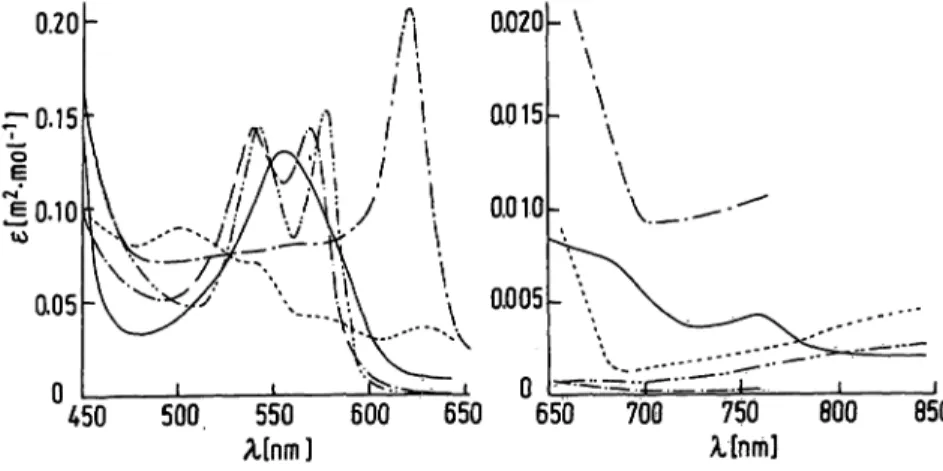
Fig. I.Absorption spectra of Hb ( ), Hb02 ( ), HbCO (-·-), Hi(-—) (pH 7.0-7.4) and SHb (-—).·
Since the lineic absorbances1) of most common haemo- globin derivatives are known over a wide spectral range (8,9), it would seem astonishing that no straightforward multi-wavelength methods have been developed for the simultaneous determination of oxygen saturation, one or more dyshaemoglobins and total haemoglobin in human blood. The introduction of such methods, how- ever, has for years been impeded by the fact that no practical method was available for removing all scattering particles from the haemolysate so that the lineic absorb- ances determined with partly purified haemoglobin solutions could be applied. Most filtering procedures appeared to need high pressures, and they resulted in a clogged filter before enough filtrate was obtained.
Moreover, it was necessary to avoid any contact between sample and ambient air, or any appreciable degree of dilution of the sample, as these may cause changes in oxygenation. The application in the clinical chemical laboratory of a multi-wavelength method for the deter- mination of haemoglobin derivatives has until recently also been impeded by the lack of a simple means of solving a set of equations with more than three un- knowns. Since the absorption spectrum of SHb was not accurately known, it was also impossible to include all clinically important haemoglobin derivatives in the assay.
Easy processing of Spectrophotometric data was made possible for the clinical chemist by the advent of micro- computers and programmable calculators. The necessary data on the absorption spectrum of SHb is available from recent work in our laboratory (7). As a solution to the main problem, it was found that filtration through a rather coarse filter, e.g. a piece of cotton wool, removes enough scattering material from the haemolysate so that the use of the known lineic absorbances of the common haemoglobin derivatives is valid. This paper describes a five-wavelength method for the simultaneous deter- mination of Hb, Hb02, HbCO, Hi and SHb. The sum of the concentrations of the five haemoglobin derivatives proved to be equal to the total haemoglobin concentra-
J) Lineic absorption is the new, IUPAC/IFCC approved term for exctinction coefficient.
tion (cSb) as determined with the internationally stand- ardized haemiglobin cyanide (HiCN) method (10,11).
Application of both methods to the same blood sample thus affords an opportunity for interparametric quality control (12).
Methods
If a solution contains n dissolved substances with considerable differences between their absorption spectra, this n-component system can be analysed by measuring at at least n different wave- lengths. These measurements provide n equations of the type
A = •I (Eq.l)
where Áë = absorbance (log/0/7) at wavelength \, en = lineic absorbance of component ç at wavelength K, cn = concentration of component n, and / = lightpath length. The values of c\,
€2 cn can be calculated by solving the set of equations, assuming that the values of e^ and / are known.
For the simultaneous determination of Hb, HbC2, HbCO, Hi and SHb in human blood the absorbance of the haemolysate must be measured at 5 wavelengths. These wavelengths have been chosen in such a way that for each a (local) maximum is used: ë = 760 nm for Hb, ë = 577 nm for Hb02, ë = 569 nm for HbCO, ë = 500 nm for Hi and ë = 620 nm for SHb. Table 1 shows the 5-5 matrix of millimolar lineic absorbances. Most of these values have been taken from Van Assendelft (8), while
*SHb at ë = 500,569,577 and 620 nm are taken from Dijkhuizen et al. (7). In the course of this investigation €§5^0 an<* cSHb were redetermined.
The two haemoglobin derivatives that usually account for the largest part of the mixture (Hb and Hb02) have very different lineic absorbances at ë = 500, 569 and 577 nm on the one hand and ë = 620 and 760 nm on the other. Therefore, it proved
Tab. 1. Matrix of millimolar lineic absorbances e expressed in OTf1· minor1 -1=10*
\(nm) 500569 577 ' 760620
Hb 11.274.09
9.401.23 0.43
HbO2
11.275.05 15.37
0.240.13
• m2 · mol"1
HbCO 14.275.35 10.00
0.330.03
(cf. fig. 1).
Hi 9.044.10 4.103.35 0.24
SHb 7.208.10 8.10 20.80 1.04 / (ë = 500, 569,577) < 0.01 cm exactly calibrated /(ë = 620, 760) -0.2 cm to4 decimaLplaces Italics indicate the chosen maximum of each derivative
J. Clin. Chem. Ctin. Biochem. / VoL 19,1981 / No. 7
necessary to use two different pathlcngths to keep the absorb- ance values within the range in which they can be measured with reasonable accuracy (1, 8). At ë = 620 nm and 760 nm,
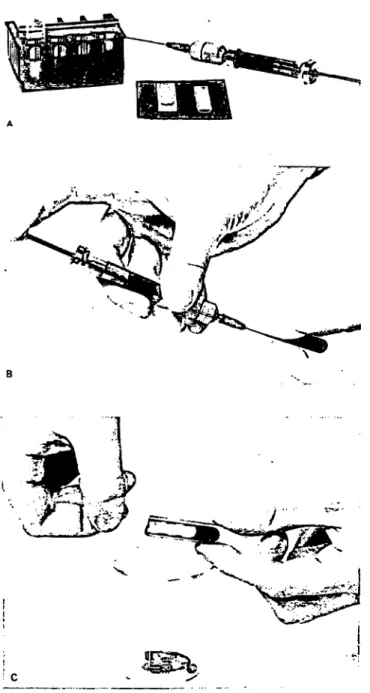
/ = 0.200 cm is adequate, whereas at ë = 500, 569 and 577 nm it is necessary to keep / < 0.010 cm. In this investigation we actually used / = 0.007 cm, achieved by inserting a 0.093 cm plan-parallel glass plate (Hellma Benelux, The Hague, The Nether- lands) into a 0.100 cm cuvette (fig. 2). The values of/ were checked by measuring the absorbance at ë = 540 nm of HiCN solutions of known concentration (13).
Fig. 2. Filling a 0.100 cm cuvette and inserting a 0.093 cm plan^
parallel glass plate. Cuvettes and glass inserts are stored in a chromic acid solution, rinsed before use with demineral- ized water followed by acetone and dried with an air jet.
The filter umt^between syringe and needle contains cotton wool. The filter unit is cleaned, dried and filled with new cotton wool before each determination.
A. Cuvette holder with reference cuvette, cuvette, glass insert and 2 ml syringe with filter and needle, con- taining the haemolyzed blood.
B. After discarding the first 10 drops the haemolysate is gently pressed through the filter into the cuvette.
C. The plan-parallel glass plate is inserted into the cuvette, leaving a lightpath length of 0.007 cm.
Procedures
Five-wavelength method
All measurements were made with freshly drawn, hcparinized blood samples from apparently healthy humans of both sexes.
The sample was transferred without any contact with air to a 2 ml glass syringe containing a mixing ball (ö = 5 mm) and with its dead space filled with a 5% solution of the non-ionic deter- gent Sterox SE (Hartman-Leddon Comp., Philadelphia, Pa., USA). After thouroughly mixing blood and detergent solution, a filter unit containing a piece of cotton wool was put on the syringe. After discarding the first 10 drops to flush the needle and filter space, the two cuvettes (/ = 0.200 and 0.100 cm) were filled with the haemolysate, and the plan-parallel glass plate was inserted into the 0.100 cm cuvette (fig. 2). The absorbances were measured at ë = 500, 569, 577, 620 and 760 nm with an Optica CF4 grating spcctrophotometer against similar cuvettes filled with distilled water in the reference channel. The spectral band width was less than 1 nm. The wavelength calibration was checked with the aid of mercury emission lines and the absorb- ance calibration with the aid of a carbon yellow filter (Corning HT yellow 0-10; NBS test 178473 0-10). The concentrations of the haemoglobin derivatives were calculated from the absorbance values by matrix calculation using a desk top calculator
(HP9845 A; cf. Appendix). The slight differences between the cuvettes in the measuring channel and the reference channel and the dilution of the sample with Sterox SE solution were taken into account. The concentrations of the various compo- nents were calculated both in mmol · Ã1 and as a fraction of total haemoglobin. In addition, the oxygen saturation
cHbO2
(Eq. 2) was calculated, and the concentrations of the components were added to obtain a value for Cfjb·
Preparation of blood samples
containing various haemoglobin derivatives
For testing the five-wavelength method, samples with different amounts of the various haemoglobin derivatives were prepared.
As the conventional methods for measuring these derivatives, except for the determination of Hi, are based on the assumption that not more than two components are present, the test samples were prepared accordingly. Blood with different ratios of Hb02 and Hb was prepared by tonometry with humidified 2/N2 mix- tures containing 5.6% CO2 in a stainless steel chamber with a magnetic stirrer at the bottom. The gases were fed into the tono- meter through ports in.the perspex lid and the O2/N2 ratio was adjusted by means of needle valves (14).
Blood with different ratios of HbCO and HbO2 was prepared in the following way. A blood sample was divided into two parts.
One part was oxygenated by tonometry with humidified pure 2 for 30 min, yielding practically 100% HbO2- The other part was subjected to tonometry with humidified pure CO for 15 min, followed by 5% CO and 95% O2 for 15 min. This procedure yields more than 90% HbCO, the remainder being HbO2- Samples with different HbCO fractions were then made by mixing various volumes from the two syringes in which the blood was kept after tonometry.
To prepare blood samples with various amounts of Hi, blood was haemolyzed by the addition of one drop of undiluted Sterox SE and distributed to several test tubes to which various volumes of a 90 mmol · Ã1 K3Fe(CN)e solution were added. The tubes were kept for 90 min at room temperature before the samples were measured.
Blood containing SHb was prepared according to Siggaard-An- dersen et al. (6). First, the blood was fully oxygenated by tonometry with humidified pure O2 for 2 h. One half of the oxygenated blood was centrifuged and the packed cells incubated for 30 min with an equal volume of a freshly prepared solution of Na2S and HC1 (50 and 75 mmol · Ã1, respectively; pH « 7.5).
Next, excess H2S was removed by tonometry with humidified pure O2 for 30 min and the blood, now containing 15-25%
J. Clin. Chem. Clin. Biochem. / Vol. 19,1981 / No. 7
111
SHb, was stored in a gas-tight syringe. The other half of the oxygenated blood was also stored in a syringe and samples with different SHb content were prepared by mixing various volumes from the two syringes.
Blood samples differing in total haemoglobin concentration were prepared by separating erythrocytes and plasma from a certain amount of blood and again mixing these components in different ratios.
Conventional methods
When a two-component system is analysed by measuring at two wavelengths, one of which is isosbestic for the two components, it follows from the two equations of the type of Eq. 1 with n = 2, that
cHi
(Eq.3) where a and b are constants and ë2 is the isosbestic wavelength (1). When the two components are Hb and HbO2, it follows from Eqs. (2) and (3), that
(Eq.4) ë1 ë2
a and b can be determined by measuring A /A for some fully oxygenated (So2 = 1) and some completely deoxygenated (S<32 = 0)blood samples. Suitable wavelengths for the deter- mination of 5o2 are ë = 680 and 800 nm. At the isosbestic point (ë = 800 nm) the absorption spectra of Hb and Hb02 are rather flat (2) and ë = 680 nm is in the range of maximum spectral sensitivity for the determination of SQ^ (15). Measurement of blood from 6 humans and 8 dogs gave a = - 0.3819 and b = 1.1633 (2). For each measurement 2 ml blood was trans- ferred anaerobically to a 2 ml syringe containing a glass ball (0 = 5 mm) for mixing and with its dead space filled with a 5 % Sterox SE solution. After thoroughly mixing the sample and discarding the first drops, the sample was injected into a plan- parallel glass cuvette with / = 0.200 cm. A680 andX800 were measured using an Optica CF4 grating spectrophotometer with an effective band width < 1 nm. SQ was calculated with the
aid of Eq. 5 2
= 1.1633 -0.3819A6*°
A 800
(Eq.7) where-4i,A2, A$ and A 4 represent the absorbances at
ë = 630 nm of the four blood reagent mixtures arid c total haemoglobin concentration.
SHb was determined by means of the following procedure.
0.5 ml blood was added to 25 ml of a solution containing 0.05%
Sterpx SE and a phosphate buffer (27.50 mmol -1"1 Na2HPO4 and 13.16 mmol · Ã* KH2PO4; pH = 7.4). The absorbance of this solution was measured at ë = 620 rim (Optica CF4) with either / ^ 1.00 cm or / = 4.00 cm according to the absorbance level. This one-wavelength method allows the calculation of the SHb fraction only when an appropriate correction is made for the absorbance of the other component present, i.e. Hb02 (Hi was excluded in all samples measured). This correction has been included in the equation for calculating SHb.
cSHb .620 620
(Eq. 5)
(Eq. 8) where c' represents the total haemoglobin concentration of the diluted blood in mmol · Ã1, and e|lib and €§^Q are the milli- molar lineic absorbances of SHb and HbO2 at ë = 620 nm (table 1).
The total haemoglobin concentration of the test samples was determined as HiCN in conformity with the recommendations of ICSH(ll).
Results
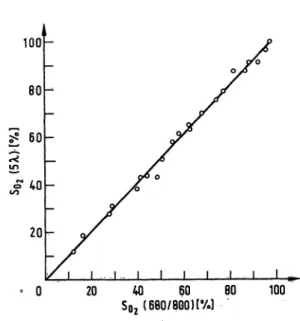
Figure 3 shows the results of 22 comparative determina- tions of ·5¼2 with the five-wavelength method and the 680/800 method. The systematic differences of the five- wavelength method with respect to the 680/800 method was 1.2%So2 with a standard deviation of 23%SOi, The results of 32 comparative measurements of the HbCO fraction with the five-wavelength method and the 562/540 method are shown in figure 4. The systematic difference of the five-wavelength method with respect to
For the determination of the HbCO fraction in the samples containing HbCO and HbO2 a similar method was used. The wavelengths selected for this determination were ë = 562 and 540 nm, the latter being isosbestic. The measurements were carried out with / = 0.007 cm (fig. 2). The constants of Eq. 6 have been determined by calibration against a titrimetric method for HbCO in blood (16).
cHbCO A 562
3.215^— -1.923.^540 (Eq.6) The Hi fraction in the test samples was determined with a KCN addition method (1, 7,17). Four reagent solutions were used.
Solution 1 contained 0.05% Sterox SE and a phosphate buffer (27.50 mmol · Ã1 Na2HPO4 and 13.16 mmol · Ã1 KH2PO4; pH = 7.4). Solutions 2 and 3 contained in addition 3.84 mmol · Ã1 KCN and 3.04 mmol · Ã1 K3Fe(CN)6, respectively. Solu- tion 4 contained in addition 3.84 mmol · Ã1 KCN as well as 3.04 mmol · Ã1 K3Fe(CN)6. 0.5 ml blood was added to 25 ml of each of the four solutions. In the second solution all Hi present becomes converted into HiCN. In the third and the fourth solution all haemoglobin present is converted into Hi and HiCN, respectively. The absorbance of the four solutions was measured at ë = 630 nm (Optica CF4) with either / = 1.00 cm or / = 4.00 cm according to the absorbance level. The Hi fraction was calculated with the aid of Eq. 7.
100
80
;£ 60
20
20 40 60
S0 2( 680/800) [%] 100 Fig. 3. S02 (5 ë) plotted against SOt (680/800) for 22 blood
samples from 3 healthy humans. Regression equation:
$0, (5 ë) = 1.03 X So, (680/800) - 0.32.-Correlation coefficient: 0.993;
J. Clin. Chem. Clin. Biochem. / VoL 19,1981 / No. 7
100
80
40
20
i I I I 1 I I I
20 40 60 80
HbCO{562/540)[V.) 100 Fig. 4. HbCO (5 ë) plotted against HbCO (562/540) for 32 blood
samples from 7 healthy humans. Regression equation:
% HbCO (5 ë) = 0.99x % HbCO (562/540) + 1.45.
Correlation coefficient: 0.996.
25 -
20
Si 15
10
10 15
SHb (620)1%) 20 25 Fig. 6. SHb (5 ë) plotted against SHb (620) for 8 blood samples
from a healthy human. Regression equation: % SHb (5 \) = 0.99÷ % SHb (620) - 0.52. Correlation coefficient:
0.998.
the 562/540 method was 1.2% HbCO with a standard deviation of 1.7% HbCO. Figure 5 shows the results of
16 comparative measurements of the Hi fraction with the five-wavelength method and the KCN addition
method. The systematic difference of the five-wavelength method with respect to the KCN addition method was - 0.4% Hi with a standard deviation of 0.7% Hi. Eight comparative measurements of the SHb fraction with the five-wavelength method and the 620 method are shown in figure 6. The systematic difference of the five- wavelength method with respect to the 620 method was - 0.6% SHb with a standard deviation of 0.2% SHb.
Figure 7 shows the relationship between c^b as deter- mined by adding the concentrations of all haemoglobin derivatives present in the sample (five-wavelength method) and cftb as determined by the HiCN method.
0 5 10 15 20 25 30 :Hi(CfT addition) [%]
Fig. 5. Hi (5 ë) plotted against Hi (KCN addition method) for 16 blood samples from 4 healthy humans. Regression equation: % Hi (5 ë) = 0.99x »Hi (KCN) - 0.31. Correla- tion coefficient: 0.994.
25
20
15
10
I _
10 20 25
Fig. 7. cfcb (5 ë) plotted against cftb (HiCN) for 22 blood samples of 5 healthy humans. Regression equation:
cHb (5 ë) = 1-00 cj-ib (HiCN) - 0.07. Correlation coeffi- cient: 0.988.
The systematic difference of the five-wavelength method with respect to the HiCN method was - 0.06 g · dl"1 with a standard deviation of 0.15 g - df1 (n = 22).
Discussion
This method for the simultaneous determination of 5 haemoglobin derivatives was developed following the observation that by simple filtration through cotton wool scattering particles can be removed from a haemoly- sate to such a degree that the lineic absorbances as deter- mined for partly purified haemoglobin solutions can be applied. All methods hitherto used for clearing haemoly- sates were top complicated and time-consuming and could hardly be carried out without air-contact, a condi- J.-Clin. Chem. Clin. Biochem. / VoL 19, 1981 / No. 7
tion which is essential for the accurate measurement of oxygen saturation. For the same reason any significant degree of dilution of the blood with a reagent solution had to be omitted. The small filter unit used in this investigation offers only slight resistance to flow and does not interfere with the filling of the cuvettes. Yet, the ensuing haemoglobin solutions are clear enough for the application of Lambert-Beer's law and the known lineic absorbances. The method has not yet been tested for blood with pathological plasma protein patterns. In such cases, for the time being, it should be applied with caution. The dilution of the sample with 5% Sterox SE solution is so slight that even when the oxygen saturation is near zero and the Sterox SE solution is in equilibrium with air the ensuing change in oxygen saturation will be less than 0.5%.
Wavelength and lightpath length are the most critical factors for the validity of the five-wavelength method.
The wavelength scale of the spectrophotometer should therefore be checked regularly. This is most easily done with the aid of mercury emission lines. A small spectral band width (< 1 nm) should be used and in each deter- mination all wavelengths should be adjusted carefully.
The lightpath length of the cuvettes should be deter- mined by comparative measurements with a calibrated
1 cm cuvette using various concentrations of a substance exactly obeying Lambert-Beefs law. HiCN solutions prepared in the same way as the International Reference Solution (13) are suitable for this purpose. Checking the absorbance scale with a filter of exactly known absorb- ance is recommendable, though not strictly necessary when a modern spectrophotometer is used.
Figures 3—6 show that the various haemoglobin deriva- tives can be accurately determined by means of the five- wavelength method. An objection which can be raised against the applied testing procedure is that the test samples usually contained only two haemoglobin deriva- tives. This was a consequence of the fact that the methods used for comparison, except for the determina- tion of Hi, could only be applied to two-component sys- tems. However, it should be noted that the five-wave- length method correctly indicated zero concentration for the components not present in the sample, which certainly is indicative of the validity of the method.
As shown in figure 5, the comparative measurements of Hi have been limited to the 0-30% range. We were forced to do so, because the KCN addition method progressively overestimates the Hi concentrations of samples containing > 30% Hi. Some additional dilution experiments indicated that the five-wavelength method gives correct values for the Hi fraction at least up to 80%. The comparative measurements of SHb had to be limited to the 0-25% range, because test samples with more than 25% SHb can hardly be obtained with the
used. In spite of these limitations, the results
shown in figures 5 and 6 for Hi and SHb, respectively, amply cover the clinically relevant range.
It may be regarded as a distinct advantage of the five- wavelength method that it allows the simultaneous deter- mination of Hi and SHb, which is of special interest in toxicological cases. Although the KCN addition method has originally been introduced as part of a determination of Hi and SHb in a single sample of blood (17), it has recently been shown that the presence of SHb results in an appreciable overestimation of the Hi fraction by this method (7).
If no other haemoglobin derivatives are present, the sum of the concentrations as determined by the five-wave- length method should be equal to c#b. This is beauti- fully borne out by the data of figure 7: the regression line is indistinguishable from the line of identity. These results could be obtained in spite of the fact that the reagent solution used in the HiCN method converts SHb into SHiCN instead of into HiCN. However, the error thus introduced is but slight (7). The fact that c^b (five- wavelength) equals cnb (HiCN) offers an easy opportunity for applying interparametric quality control (12). It will be sound practice to supplement each determination of haemoglobin derivatives by means of the five-wavelength method with a determination of ofa (HiCN).
As shown in figure 1 and table 1 the set of wavelengths chosen for the five-wavelength method contains for each haemoglobin derivative a local maximum. The use of ë = 760 nm for Hb at first sight seems rather curious, ë = 555 nm being, the obvious choice. In fact we did try to use ë = 555 nm instead of ë = 760 nm. This also has the advantage that a spectrophotometer without a red- sensitive photo-tube can be used. However, less accurate results were obtained when the 555 nm maximum of Hb was used. This was especially so in the determination of the Hb02 and HbCO fractions. A possible explanation for this might be the rather small differences between 6Hb, eHbO2 afld ^Hoco at ë = 555 and 569 nm. How- ever, the experiments clearly demonstrate that ë = 760 nm is to be preferred as the wavelength for measurements.
Appendix
10 ! The file-name is 5 lambda 20 OPTION BASE 1
30 DIM Len (5), Abs (5), Con (5), Eps (5,5) 40 MAT READ Eps, Un
50 DATA 4.09, 5.05, 5.35, 9.04, 7.2 60 DATA 11.27,11.27,14.27,4.1, 8.1 70 DATA 9.4,15.37,10.0,4.1,8.1 80 DATA 1.23, .24, .33, 3.35, 20.8 90 DATA .43, .13, .03, .24, 1.04
100 DATA .0071, .0071, .0071, .2013, .2013 ! Own calibrated values
110 FOR 1=1 to 5 120 F O R J = l t o 5
130 Eps (I, J) = Eps (I, J) * Len (I) 140 NEXTJ
150 NEXT I
160 MATEps = INV(Eps)
J. Clin. Chem. CJin. Biochem. / VoL 19,1981 / No. 7
170 PRINT 'The absorbances please"
180 MATINPUTAbs 190 MAT Con = Eps * Abs
200 Sum = SUM (Con) * Df ! Dilution-factor of syringe filled with Sterox SE
210 PRINT USO2 % = "; 100 * Con (2)1 (Con (1) + Con (2))
220 PRINT "HbCO % = "; 100 * Con (3) / SUM (Con) 230 PRINT "Hi % = "; 100 * Con (4) / SUM (Con) 240 PRINT "SHb % = "; 100 * Con (5) / SUM (Con) 250 PRINT "C * Hb (g/dl) = "; Sum * 1.61145 260 END
References
1. Van Kämpen, E. J. & Zijlstra, W. G. (1965), in Advances in Clinical Chemistry (Sobotka, H. & Stewart, C. P., eds.) Vol. 8,
141-187, Academic Press, New York/London.
2. Mook, G. A., Buursma, A., Gerding, A., Kwant, G. & Zijlstra, W. G. (1979), Cardiovasc. Res. 13, 233-237.
3. Zijlstra, W. G. & Muller, C. J. (1957), Clin. Chim. Acta 2, 237-245.
4. Small, K. A., Radford, E. P., Frazier, J. M., Rodkey, F. L. &
Collison, H. A. (1971), J. Appl. Physiol. 31, 154-160.
5. Rodkey, F. L., Hill, . ., Pitts, L. L. & Robertson, R. F.
(1979), Clin. Chem. 25,1388-1393.
6. Siggaard-Andersen, O., Ntfrgaard-Pedersen, B. & Rem, J.
(1972), Clin. Chim. Acta«, 85-100.
7. Dijkhuizen, P., Buursma, A., Gerding, A. M. & Zijlstra, W. G.
(1977), Clin. Chim. Acta 78, 479-487.
8. Van Assendelft, O. W. (1970), Spectrophotometry of Haemo- globin Derivatives, Van Gorcum and Comp., Assen, The Netherlands.
9. Van Assendelft, O. W. & Zijlstra, W. G. (1975), Anal. Bio- chem. 69, 43-48.
10. Van Kämpen, E. J. & Zijlstra, W. G. (1961), Clin. Chim.
Acta 6, 538-544.
11. International Committee for Standardization in Haematology (1978), J. Clin. Pathol. 31, 139-143.
12. Van Kämpen, E. J. (1978), in New Pathways in Laboratory Medicine (Rosalki, S. B., ed.), 132-140, Hans Huber Publishers, Bern/Stuttgart/Vienna.
13. Zijlstra, W. G. & Van Kämpen, E. J. (1962), Clin. Chim.
Acta 7, 96-99.
14. Oeseburg, B. (1979), Crit. Care Med. 7, 396-398.
15. Mook, G. A., Van Assendelft, O. W. & Zijlstra, W. G. (1969), Clin. Chim. Acta 26, 170-173.
16. Dijkhuizen, P., Buursma, A., Gerding, A. M., Van Kämpen, E. J. & Zijlstra, W. G. (1977), Clin. Chim. Acta 80, 95-104.
17. Evelyn, K. A. & Malloy, H. T. (1938), J. Biol. Chem. 126, 655-662.
Prof. dr. W. G. Zijlstra Department of Physiology University of Groningen Bloemsingel 10
NL-9712 KZ Groningen The Netherlands
J. Clin. Chem. Clin. Biochem. / VoL 19,1981 / No. 7
ill