of an integrated offshore grid in the baltic sea
Comparison of different levels of grid integration based on case studies
January 2019
Copyright:
Reproduction of this publication in whole or in part must include the customary bibliographic citation, including author attribution, report title, etc.
Cover photo:
General view of the wind farm, Aerial view, © EnBW Published by:
Baltic InteGrid Disclaimer:
The content of the report reflects the author’s/part- ner’s views and the EU Commission and the MA/JS are not liable for any use that may be made of the infor- mation contained therein. All images are copyrighted and property of their respective owners.
www.baltic-integrid.eu based on case studies By
Anna-Kathrin Wallasch Rasmus Borrmann Tobias Künne
(all Deutsche WindGuard) Richard Weinhold Clemens Gerbaulet (all IKEM)
Table of Contents
Table of Contents ...3
Table of Figures ... 4
Table of Tables ... 5
Executive Summary ...7
1. Introduction ... 11
1.1 Baltic InteGrid Project ... 12
1.2 Cost-benefit Analysis (CBA) ... 12
2. Status of evaluation of integrated offshore grids ...14
2.1 Status of implementation of integrated offshore grids in the EU ...14
2.2 Status of research on CBA of integrated offshore grids ...16
2.3 Summary of evaluation status ...18
3. CBA Methodology ...20
3.1 Main objectives ... 20
3.2 Methodology ... 20
4. Investigation Scope - Pre-feasibility Studies ... 23
5. Analysis of Benefits ...30
5.1 Market Model ... 30
5.2 Main input parameters and assumptions ...31
5.3 Monetarised Results ...32
5.3.1 Main Results – Total System Cost ...32
5.3.2 Electricity Prices ... 36
5.4 Overview of Non-monetarised Results ... 39
5.4.1 Adequacy rate in cases of line failure ... 39
5.4.2 CO2 Emission ... 43
6. Cost Analysis ...44
6.1 Linear Cost Model ... 44
6.1.1 Investment Cost Assumptions ... 44
6.1.2 Cost Development Assumptions ... 47
6.1.3 Risk Analysis of Cost Assumptions ... 47
6.2 Cost Results... 48
6.2.1 Total Cost ... 48
6.2.2 Cost Structure ...49
6.2.3 Sensitivity Analysis ... 52
7. Weighing Net Present Value of Costs and Benefits ...54
8. Conclusions ...56
Table of Figures
Figure 1 Case study 1 (left) and case study 2 (right), both showing high ...8
offshore wind installations and partial integration Figure 2 Methodology ...22
Figure 3 Case study locations ...23
Figure 4 Case study 1 with high offshore wind installation ...25
Figure 5 Case study 1 with low offshore wind installation ...26
Figure 6 Case study 2 with high offshore wind installation ...27
Figure 7 Case study 2 with low offshore wind installation ...28
Figure 8 Total system costs: case study 1 – low wind ...33
Figure 9 Total system costs: case study 1 – high wind ...34
Figure 10 Total system costs: case study 2 – low wind ...35
Figure 11 Total system costs: case study 2 – high wind ...36
Figure 12 Average electricity price difference for scenario variations ...37
(Top: Poland, Middle: Sweden, Bottom: Lithuania) Figure 13 Average electricity price difference for scenario variations ...38
(Top: Germany, Middle: Denmark, Bottom: Sweden) Figure 14 Adequacy rate CS1: Sweden ... 40
Figure 15 Adequacy rate CS1: Sweden (including outages) ... 40
Figure 16 Adequacy difference CS1: Sweden ... 40
Figure 17 Adequacy difference CS1: Poland ... 41
Figure 18 Adequacy difference CS1: Lithuania... 41
Figure 19 Adequacy difference CS2: Germany ... 42
Figure 20 Adequacy difference CS2: Sweden ... 42
Figure 21 CO2 Emissions in case study 1 with zero integration (in million tonnes) ....43
Figure 22 Cost functions ... 46
Figure 23 Expected total costs for the various scenarios, including results ... 49
of Monte Carlo analysis Figure 24 Cost structures for case study 1 with high offshore wind power ...50
Figure 25 Cost structures for case study 1 and low offshore wind power ...50
Figure 26 Cost structures for case study 2 with high offshore wind power ...51
Figure 27 Cost structures in case study 2 with low offshore wind power ...51
Table of Tables
Table 1 Comparison of recent studies on benefits of meshed offshore grids ... 19
Table 2 Development of a list of key cost and benefit indicators ...21
based on ENTSO-E criteria Table 3 Overview of the six case-study scenarios ...24
Table 4 Overall system cost differences in 2017 (bn €) ...32
Table 5 Cost parameter assumptions for CAPEX ... 45
Table 6 Cost parameter assumptions for OPEX ... 46
Table 7 Cost reduction assumptions ... 47
Table 8 Probability distribution assumptions ... 48
Table 9 Sensitivity Analysis ...52
Table 10 Results for Case Study 1 ...54
Table 11 Results for Case Study 2 ...54
Table 12 Most favorable integration levels ...55
Executive Summary
In an effort to reduce the greenhouse gas emissions from electricity generation, most of the European countries in the North Sea and Baltic Sea Regions have established national targets to increase offshore wind power capacity. As the share of renewable energies rises, however, power fluctuations are expected to become more frequent. As a result, international electricity grid interconnections have been implemented or are in the planning phase, and there is growing interest in the prospect of evacuating the power produced by offshore wind farms (OWFs) into transnational grid infrastructure.
The challenges associated with such systems are the subject of various European research collaborations and initiatives, the majority of which are focused on OWFs in the North Sea Region (NSR). The INTERREG project Baltic InteGrid (Integrated Baltic Offshore Wind Electricity Grid Development) is the first to concentrate on potential offshore wind develop- ment in the Baltic Sea. The project is a collaboration between 14 partners from all eight EU Member States in the Baltic Sea Region (BSR). Project research addresses multiple issues, including policy and regulation, market and supply chain, technology and grid design, envi- ronment and society, spatial planning, and costs and benefits.
This report examines the costs and benefits of different design options for an integrated off- shore grid. A systematic cost-benefit analysis (CBA) is conducted to allow for a direct com- parison of the socio-economic effects of varying levels of wind farm integration. The CBA is based on ENTSO-E guidelines and adapted to fit the long-term horizon (2050) of potential projects. The aim of this CBA is not to provide a precise economic forecast, but to enable a comparison of specific infrastructure variants.
This report analyses two case studies, each of which contains six scenarios with two main variables: the level of wind farm integration and the extent of OWF development. The first case study examines the interconnections between the electricity grids of Sweden, Poland, and Finland. The second focuses on interconnections between Swedish and German electricity markets.
Technology &
Grid Design Market &
Supply Chain Policy &
Regulation
Spatial Planning
Environment &
Society
2025
Converter station
2030 2035 2040 2045
HVDC cables HVAC cables Onshore connection point Commissioning year
Connection technology Figure 1
Case study 1 (top) and case study 2 (bottom), both showing high offshore wind installations and partial integration
For each case study, three levels of wind farm integration are analysed. The zero-integration case is the baseline and assumes that the development of HVDC interconnectors is com- pletely independent of the OWFs that are connected to their respective electricity markets in a conventional, radial manner, using mostly HVAC technology. In the partial-integration case, some wind farms are connected to interconnectors, whilst others are connected radially.
In addition, some direct connections of wind farms are assumed. In the maximum-integration scenario, all wind farms are part of a highly interconnected HVDC grid infrastructure. For the development of OWF installations, two different pathways are assumed. The high case assumes that most of the projects currently in planning stages will be realised. The low case only takes into account those projects with a high probability of realisation. The inter- connecting capacity is held constant for the different levels of integration.
The potential benefits of greater OWF-interconnector integration are primarily expressed as differences in total system costs for electricity provision in Europe under given condi- tions. The dynamic investment and dispatch model dynELMOD is used to calculate system costs. The predefined scenario configurations and greenhouse gas emissions targets are set as boundary conditions. The model determines cost-effective investment in generation ca- pacities, storage, and additional interconnectors through 2050 for the European electricity market as a whole. Non-monetarised results are also analysed.
For the cost evaluation, the linear model used assumes cost parameters for cables and nodes.
Cable costs include costs of materials and construction. Node costs include the total costs of converters or transformers, including construction and the platform cost for offshore nodes.
Operational costs, depreciation, and cost trends are also included. Because the scenarios have a long-term horizon and the development of innovative technology like HVDC breakers is anticipated, there is high uncertainty in cost assumptions. However, a sensitivity analysis shows that general results (i.e. the cost ranking for the different levels of integration) are quite robust to variations in cost assumptions.
Costs and benefits are expressed as net present values and are compared to evaluate rela- tive benefits of increased integration. The following table indicates the integration levels that proved to be the most favourable in the different case studies and OWF installation assumptions.
Case Study 1
(SE / PO / LT) Case Study 2 (DE / SE / DK)
High OWP Partial
Integration Maximum
Integration
Low OWP Maximum
Integration Zero
Integration
Five central conclusions can be derived from the analysis:
1. No general trend is observed as the level of integration increases. This is due to the spe- cific characteristics of the different scenarios. For future infrastructure projects, potential wind farm integration should be evaluated carefully and on a case-by-case basis.
2
.
The interconnection of market areas can be expected to yield significant socio-economic benefits. This interconnection is already a feature of the zero-integration cases. Differ- ences in benefits are relatively low for the various levels of wind farm integration. The analysis shows that the market benefits of additional integration are, at the very least, small or close to neutral. These include the benefits of an increased rate of adequacy, especially in cases of an overall low adequacy. Depending on the scenario, additional in- tegration may produce significant benefits. This analysis captures only the additional benefits of higher levels of integration; benefits from investments in the base case are not represented, although they may be significant. Individual infrastructure projects should therefore be evaluated in greater detail.3. Differences in costs between the three levels of integration are more significant. In each case, the CBA identifies the least expensive scenario as the most favourable. The cost structure varies significantly between zero-integration and maximum-integration scenarios. The results indicate that the replacement of HVAC infrastructure with HVDC technology in a meshed configuration could be economically competitive, but the level of integration has to be examined carefully. Although cost assumptions are highly uncertain, especially for HVDC technology, this finding is rather robust to cost variations.
4. A higher degree of integration appears to be more reasonable in scenarios with high off- shore wind capacity, because in such cases the high share of fixed costs can be distributed among many projects.
5. A higher level of integration supports additional non-monetarised benefits. For exam- ple, in many cases, better market coupling and additional feed-in options for OWFs can increase the security of supply.
The CBA shows that the integration of OWFs and interconnectors can increase socio-eco- nomic welfare, but the optimal level of integration should be evaluated carefully.
1. Introduction
The following report provides a cost-benefit analysis (CBA) of case studies in the Baltic Sea for different levels of grid integration between Baltic countries. The objective is to compare integration levels to determine the most favourable design for a meshed grid. The report was conducted as part of the Baltic InteGrid project (Integrated Baltic Offshore Wind Electricity Grid Development). Deutsche WindGuard was the leader of this group of activities and pre- pared the cost portion of the analysis. The benefit analysis was conducted by the Institute for Climate Protection, Energy and Mobility (IKEM), a Baltic InteGrid project partner. The results were then weighed against each other.
Sections 1.1 – 1.2 provide a brief introduction of the Baltic InteGrid project and the CBA sum- marised in this report. The current status of research on integrated offshore grids is then summarised (chapter 2), and the CBA methodology is explained (chapter 3). The scope of the investigation, including the design of the case studies, is outlined (chapter 4). The bene- fits of different integration levels are then analysed (chapter 5) and the corresponding cost analysis is presented (chapter 6). Costs and benefits are weighed against each other for the different cases and integration levels (chapter 7). Finally, conclusions are drawn regarding the relative benefits of specific integration levels (chapter 8).
Stiftung
Offshore-Windenergie, Eon-Netz,
Detlef Gehring 2008
1.1 Baltic InteGrid Project
The Baltic InteGrid project (Integrated Baltic Offshore Wind Electricity Grid Development) is co-financed within the framework of the INTERREG Programme for the Baltic Sea Region 2014 – 2020. It consists of 14 partners from all eight EU Member States in the Baltic Sea Region (BSR), which work in close cooperation with key stakeholders. The project duration is 2016 – 2019.
The project explores the potential for a meshed or integrated offshore grid in the BSR. It aims to promote sustainable electricity generation, advance the integration of regional electricity markets, and ensure security of supply in the BSR through an integrated grid approach that optimises the potential for, and efficiency of, offshore wind energy (OWE). There are three main output areas that are intended for use in strategic recommendations to support an integrated Baltic Offshore Grid:
· the Baltic Offshore Grid Forum: the conference and communication platform for the project
· a high-level concept for the Baltic Offshore Grid: the interdisciplinary research component of the project
· detailed case studies for two interconnection scenarios included in the Baltic Grid Concept This analysis contributes to the high-level concept for the Baltic Offshore Grid by assessing potential costs and benefits. The analysis is performed on the basis of concrete design options, which are then applied in case studies for two interconnection scenarios.
1.2 Cost-benefit Analysis (CBA)
This purpose of this study is to analyse the relative costs and benefits of different design options for an integrated offshore grid. Costs and benefits are evaluated on the basis of case study scenarios, and the disaggregated data are then used in an overall CBA.
CBA is a systematic approach to estimating the economic advantages and disadvantages of alternative projects or investments. It can be used to assess whether the benefits of an in- vestment option outweigh its costs and to evaluate the change in welfare attributable to it.
Costs and benefits are expressed in monetary terms and adjusted for the time value of money.
Because costs and benefits generally occur at different points in time, all flows of costs and benefits over time are expressed in a common unit of measurement, the ‘net present value’.1 CBA serves as a basis for comparing costs and benefits of different options under consider- ation. It is a particularly useful decision-making tool for projects can affect the public in- terest. For many reasons, it is challenging to perform a CBA for the development of an interconnected European electricity grid. For example, the analysis must account for the wide variation in policies (e.g. compensation systems) of participating states. In addition, implementation periods for grid planning projects often last as long as 10 – 20 years.
Very large projects with long time horizons introduce greater uncertainty about costs and benefits and therefore increase the complexity of CBA. In such cases, various assumptions must be made, including with regard to future energy-market development, resource avail- ability, and political decisions. One major challenge is the monetarisation of benefits, which is possible only to a limited extent.
All results must be assessed carefully to prevent an underestimation of costs or overesti- mation of benefits. Sensitivity and risk analysis may be useful as supplementary methods of evaluating the insecurity of results.
The CBA should also consider social, ecological, and other non-monetary factors. For ex- ample, effects on CO2 emission or grid flexibility are also relevant to the analysis of an inter- connected European electricity grid. The impact of the project on the overall welfare of states should also be considered, such as through an analysis of the effects on states and relevant stakeholders.
CBA is used in many contexts, including in policy-making and governmental processes, as well as in business activities of all kinds. CBAs for grid infrastructure projects are generally performed in accordance with the ENTSO-E2 guidelines for assessing projects of common in- terest (PCIs). This analysis develops a result-oriented methodology that is based on ENTSO-E guidelines and adapted to the specific goals of the study. Given the specific challenges of CBA for long-term electricity projects and the relatively high uncertainty of many input pa- rameters, the following CBA of an integrated Baltic Offshore Grid aims to compare different scenarios rather than provide an exact economic forecast for individual cases.
2. Status of evaluation of integrated offshore grids
Many recent studies have examined the potential for, and benefits of, integrated offshore grids in the North and Baltic Seas. The European Commission (EC) has a keen interest in advancing meshed concepts to the implementation stage; this is the objective, for instance, of the PROMOTiON project, which is currently underway in the North Sea. The first com- pleted integrated solution is Kriegers Flak, a hybrid grid connection in the Baltic Sea that connects Germany and Denmark through the OWFs Baltic 2 (DE) and Kriegers Flak (DK).
The following sections summarise recent research on the costs and benefits of integrated solutions. This is followed by an overview of political opinion formation at EU level.
2.1 Status of implementation of integrated offshore grids in the EU
This chapter reviews recent initiatives relevant to political opinion formation on the poten- tial costs and benefits of integrated offshore grids. The initiatives are presented in chrono- logical order.
Baltic Sea Region Energy Cooperation (BASREC)
The Baltic Sea Region Energy Cooperation (BASREC) was initiated in 1998 by regional ministers for energy and the EC. The BASREC format was revised in 2015, and the group now has no regular meetings. Any of the BASREC countries can propose meetings of the GSEO (Group of Senior Energy Officials) as needed to discuss an energy issue of common interest. Under the revised format, BASREC has no budget to finance further projects. Projects conducted by the group before the revision include studies on the potential for offshore wind in the BSR and research for the report ‘Electricity grid expansion in the context of renewables integration in the Baltic Sea Region’.3
Baltic Energy Market Interconnection Plan (BEMIP)
The Baltic Energy Market Interconnection Plan (BEMIP) initiative was launched in 2009 with the signing of a Memorandum of Understanding (MoU). In 2015, a new MoU extended the scope of the initiative to incorporate issues regarding security of supply, energy efficiency, renewable energy, and the integration of the Baltic States’ electricity network into the Continental European Network, including network synchronisation. The BEMIP enhances regional cooperation in the energy sector in the BSR to achieve its main objective: the creation of an open and integrated regional electricity and gas market between EU countries in the BSR. BEMIP has established dedicated working groups to develop measures, projects, and studies on specific topics (e.g. infrastructure, security of supply, and renewable energy).4 The BEMIP Action Plan includes objectives for interconnection and for renewable energy generation. In addition to better integrating the electricity market, it aims to promote sus- tainable energy development, the integration of renewable energy in electricity systems and cross-border cooperation on renewable energy.5
North Seas Countries Offshore Grid Initiative (NSCOGI)
In 2010, 10 European countries signed an MoU for a North Seas Countries Offshore Grid Initiative (NSCOGI). The objective was to establish a cooperative framework for grid infrastructure development in the North Sea in order to ensure energy security and a cost-efficient, low-carbon, sustainable energy solution for the region. Since then, NSCOGI has been responsible for evaluating and facilitating the coordinated development of a potential offshore grid in the North Sea. Three working groups were created to sup- port research on grid implementation, market/regulation, and permissions/planning.
The working groups are chaired by representatives of the energy ministries of two participat- ing countries. In 2013, the European Union (EU) identified the Northern Seas offshore grid (NSOG) as one of its four priority corridors for electricity infrastructure (Regulation (EU) 347/2013 on guidelines for trans-European energy infrastructure). The Northern Seas include the North Sea, the Irish Sea, the English Channel, the Baltic Sea, and neighbour- ing waters. The aim is ‘to transport electricity from renewable offshore energy sources to centers of consumption and storage and to increase cross-border electricity exchange’.6 Energy cooperation between the North Seas Countries
The NSCOGI gained new momentum in June 2016, when several EU member states (Belgium, Denmark, France, Germany, Ireland, Luxembourg, the Netherlands, Norway and Sweden, and later also the UK) and the European Commission (EC) signed a political declaration on energy cooperation that included a joint work programme for the coming years. The initi- ative focuses on building additional electricity links, increasing energy trading and further energy market integration, and reinforcing regional cooperation with the goal of reducing greenhouse gas emissions and enhancing security of supply.7 One explicit objective of the initiative is to advance the cost-effective development of wind energy in the region through voluntary cooperation. Further interconnection between the North Seas countries is to be enhanced using a step-by-step approach, with coordination in regional grid planning and development. By exchanging information on their offshore infrastructure planning, coun- tries will support coordinated investment planning and mobilise capital.8 The declaration expresses a political intent and has no binding effect.
‘Northern Seas as the Power House of North-Western Europe’
In early 2016, 20 members of the European Parliament signed a manifesto titled ‘Northern Seas as the Power House of North-Western Europe’. In this document, the signatories stated that cooperation in the NSR should focus on the large-scale deployment of OWFs and emerging marine renewables, along with the completion of a meshed electricity grid. The manifesto also proposed an action plan to implement a North Sea offshore grid to make the region’s waters the ‘power house’ of Europe.9
North Seas Energy Forum
The first North Seas Energy Forum was held in March 2017. The forum is organised by the European Commission and invites representatives from the public, private, and non-govern- mental sectors in the countries of the NSR (Belgium, Denmark, France, Germany, Ireland, Luxembourg, the Netherlands, Norway, Sweden, and the United Kingdom) and from the EC.10 The discussions are intended to advance the development of a regional offshore grid by addressing concrete questions and challenges.
Baltic Sea Offshore Wind Forum (BaSOF)
The Baltic Sea Offshore Wind Forum (BaSOF) is a forum established to promote the develop- ment of offshore wind power in the Baltic Sea. The forum organises workshops, conferences, and seminars with stakeholders from the Baltic Sea Countries (BSC). BaSOF meetings are held biannually to formulate a common strategy for recommendations to BSC governments.
Previous forum topics include cross-border support systems and grid interconnectors. On 15 June 2017, BaSOF members approved the Baltic Sea Declaration, which was developed to accelerate the use of offshore wind power in the Baltic Sea. The declaration, which addresses the political structures relevant to the Baltic Energy Market Interconnection Plan (BEMIP), aims to establish a legal framework for greater utilisation of offshore wind in the Baltic Sea and emphasises the need for further interconnection in the BSR.11
2.2 Status of research on CBA of integrated offshore grids
This chapter summarises key findings from recent studies on the costs and benefits of inte- grated offshore grids.
WindConnector Concept (2017)
In a study commissioned by TenneT and The Crown Estate, Pöyry examined the feasibility of a ‘WindConnector concept’, a plan for offshore grid infrastructure that can both transmit electricity generated by OWFs and connect electricity markets.12 This configuration would allow for the transmission of wind energy and facilitate international electricity exchange. The infrastructure would be utilised more efficiently, as it could be used for electricity exchange in less windy periods. The study was conducted from the perspective of a TSO seeking to increase the efficiency of its infrastructure. According to TenneT, the study indicated that combining infrastructure for OWE and interconnection significantly increased the occupancy rate and thus lowered consumer energy costs. The study identified potential capital savings of up to
€ 1.8 billion from a ‘WindConnector’ between the Netherlands and the UK. The asset utilisation could increase from 45–50 %, up to 80 %. The modelling suggested that the value of potential market-to-market flows more than offset the investment required to install infrastructure linking the markets. However, the realisation of combined infrastructure projects of this kind would require further research and adjustments to regulatory frameworks.13
NorthSea Grid (2015)
The NorthSeaGrid project investigated a meshed offshore grid to facilitate system integra- tion of OWE based on a case-study approach. The study, published in 2015, was undertaken by 3E, Deutsche WindGuard, CEPS, DNV GL, ECN, and Imperial College Consultants. Instead of investigating the overall power system, it focused on three concrete case studies (embed- ded in modelling of the overall European power system). Based on the case-study analysis, the project identified and researched barriers to integrated solutions, with a focus on finan- cial risks and regulatory issues. For each case, the costs and benefits were identified for all stakeholders. The cost and benefit calculations were based on sensitivities and risk assess- ments, and various approaches to cost-benefit allocation were examined. The net present value of the difference in net benefits of integrated and base options was calculated for the three cases. A sensitivity analysis was conducted for each case to ensure that the overall re- sults were robust to changes in key variables. Benefits were expressed as savings in gener- ation investment and operating costs. The case studies showed that the net present benefit of the integrated options fell between € 350 million and € 1,200 million or € 2,300 million for all integrated cases combined. In the German Bight and UK-Benelux cases, benefits were primarily driven by the increased level of interconnection between the countries of the NorthSeaGrid. In the UK-Norway case, a small capacity reduction led to a marginal increase in system cost. In the integrated cases, the material requirements and related costs were generally lower, which was associated with decreased operating costs. Furthermore, the re- sults for greater availability and utilisation of the infrastructure were positive. The technical risks were found to be largely similar for both isolated and integrated developments. There- fore, the additional net present benefit of integrated designs was higher. The study showed that uncertainties did not increase when integrated designs were implemented and that the major uncertainty drivers were the market and basic materials, such as copper and steel. The level of benefits of the integrated cases was, however, sensitive to the characteristics of the future European system. A higher penetration of renewables tended to increase the benefits.
Lower fuel and carbon prices and increased system flexibility supported by demand-response tended to reduce benefits.
Benefits of a meshed offshore grid in Northern Seas region (2014)
The ‘Study on the benefits of a meshed offshore grid in Northern Seas region’ was launched by the European Commission and conducted by Ecofys to assess the potential benefits of a meshed offshore grid in the North Sea, the Irish Sea, and the English Channel. The study compared a base case with a coordinated case (meshed grid). In the coordinated case, a larg- er number of offshore hubs were required, as were fewer cables with a higher rating. The study showed that the net infrastructure investment cost was € 4.9–10.3 billion higher for the coordinated network development. However, this investment was associated with sig- nificant techno-economical, environmental, and strategic benefits. The annual savings from a coordinated offshore grid in 2030 (including costs of losses, CO2 emissions and generation savings) were calculated as € 1.5–5.1 billion. These monetarised benefits led to the conclu- sion that the coordinated offshore grid was profitable in all study scenarios.15 The key drivers for these reductions of the total annual cost of electricity supply were the opportunities for energy trading; cross-border flows between Member State; and the resulting improvement in the integration of offshore wind capacity and different generation pools in the region.
The study found that greater coordination of the national reserve capacities could reduce generation costs by another € 3.4–7.8 billion.16
Strategic Development of North Seas Grid Infrastructure (2014)
The study ‘Strategic Development of North Seas Grid Infrastructure’, conducted by Imperial College London and E3G and published in July 2014, used cutting-edge computer modelling to assess the risks and opportunities associated with different designs for a North Sea elec- tricity grid. The study found that coordinated and strategic approaches to network planning in the North Sea could lead to lower infrastructure costs. By sharing resources and working together to plan and design the grid, by 2040 the North Sea countries could save € 25–75 billion of the costs associated with a national approach. According to the study, coordinating the planning process for OWF locations could increase benefits to € 30–80 billion. The authors also considered uncertainties regarding expected offshore wind deployment and determined that, even in the worst-case scenario (i.e. with offshore wind development assumed to be much lower than projected), the economic regret was limited to roughly € 1 billion.17
OffshoreGrid (2011)
The European project OffshoreGrid was one of the first major research studies on an inte- grated offshore grid in the North Sea. The project, which began in 2009 and was finalised in 2011, was coordinated by 3E.18 In the study, a detailed cost-benefit analysis of offshore elec- tricity infrastructure developments in the Northern European Seas was conducted for the first time on a large scale, taking into account technical, economic, and regulatory aspects.
In the OffshoreGrid project, a European Power System model and tailor-made infrastructure cost model was used to assess the costs and benefits of different integrated design concepts (hubs, tee-in and hub-to-hub interconnectors). The main conclusion was that consistent use of hub connections where appropriate in the North Sea could reduce investment costs by
€ 14 billion. Based on that determination, two interconnected grid designs were developed:
the ‘Direct Design’ and ‘Split Design’. The additional investments required for these options were € 5.4–7.4 billion, depending on the specific design. The benefits were not calculated in monetary terms, but the additional investment was found to be negligible when spread over the long project lifetimes and referred to the kWh of offshore wind electricity produced. The study was the basis for further research, including the NorthSeaGrid project.
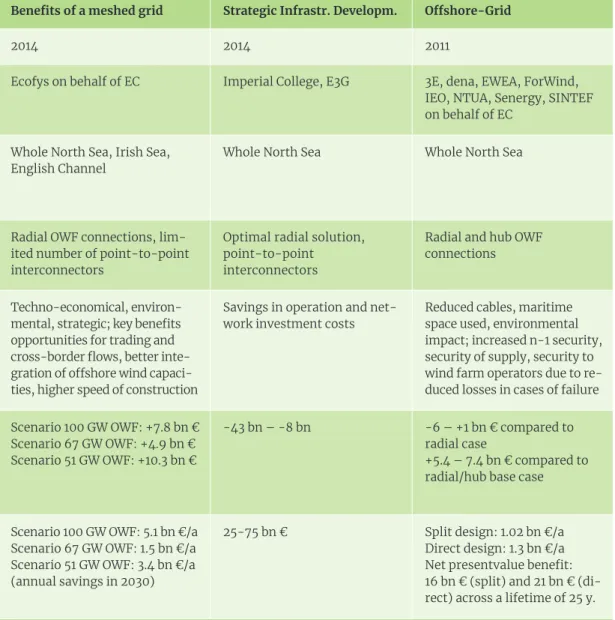
WindConnector NorthSea Grid Benefits of a meshed grid Strategic Infrastr. Developm. Offshore-Grid
Year of publication 2017 2017 2014 2014 2011
Author Pöyry on behalf of Tennet 3E, Deutsche WindGuard, CEPS, DNV GL, ECN, Imperial College on Subject analysed behalf of EC
Ecofys on behalf of EC Imperial College, E3G 3E, dena, EWEA, ForWind, IEO, NTUA, Senergy, SINTEF on behalf of EC
Subject analysed One hub-to-hub case between
Netherlands and UK 3 cases
German Bight: 2 OWF, 3 countries UK-Benelux: 3 OWF, 4 countries UK-Norway: 6 OWF, 2 countries
Whole North Sea, Irish Sea,
English Channel Whole North Sea Whole North Sea
Subject of comparison (base case)
Hub OWF connections Radial and hub OWF connections,
point-to-point interconnectors Radial OWF connections, lim-
ited number of point-to-point interconnectors
Optimal radial solution, point-to-point
interconnectors
Radial and hub OWF connections
Benefits More efficient infrastructure use (trading in less windy pe- riods) – increased occupancy rate, lower consumer energy costs
Greater availability and utilisation of infrastructure, increased level of interconnection, increased network security
Techno-economical, environ- mental, strategic; key benefits opportunities for trading and cross-border flows, better inte- gration of offshore wind capaci- ties, higher speed of construction
Savings in operation and net-
work investment costs Reduced cables, maritime space used, environmental impact; increased n-1 security, security of supply, security to wind farm operators due to re- duced losses in cases of failure Investment cost
behaviour <1.8 bn €
(Value of market- to market flows ‘more than offsets the investment required for the additional infrastructure’)
German Bight: -0.35 bn € UK-Benelux: +0.45 bn € UK-Norway: -0.55 bn € All: -0.45 bn €
Scenario 100 GW OWF: +7.8 bn € Scenario 67 GW OWF: +4.9 bn € Scenario 51 GW OWF: +10.3 bn €
-43 bn – -8 bn -6 – +1 bn € compared to radial case
+5.4 – 7.4 bn € compared to radial/hub base case
Overall benefit compared to base case
1.8 bn € German Bight: 1.2 bn €
UK-Benelux: 0.65 bn € UK-Norway: 0.35 bn € All: 2.3 bn €
Scenario 100 GW OWF: 5.1 bn €/a Scenario 67 GW OWF: 1.5 bn €/a Scenario 51 GW OWF: 3.4 bn €/a (annual savings in 2030)
25-75 bn € Split design: 1.02 bn €/a Direct design: 1.3 bn €/a Net presentvalue benefit: 16 bn € (split) and 21 bn € (di- rect) across a lifetime of 25 y. Conclusion These studies are comparable with regard to the subject of analysis
and comparison. The results tend to be in the same direction/can be explained by different case designs and slightly different methodolo- gies with regard to the details of CBA calculations.
These studies are comparable with regard to the subject of analysis and comparison. The results for the overall benefit tend to be in the same direction. A difference can be observed with regard to the investment cost, which increased in the Ecofys study and decreased in the Imperial College/E3G study, whilst the OffshoreGrid study quoted both options, depending on the type of base case. As the case design plays a significant role here, the differences are explicable.
2.3 Summary of evaluation status
At EU level, the topic of integrated or meshed offshore grids has been of great importance for roughly a decade. The NSCOGI was a major step forward in research on a meshed offshore grid in the North Sea. The EC is currently promoting two large projects to advance it further (PROMOTiON and Baltic InteGrid). In addition, the North Seas Energy Forum brings together representatives from the public, private, and non-governmental sectors in NSR countries to solve challenges related to the implementation of a meshed grid in the North Sea.
Many scientific studies have also examined the potential benefits of an integrated offshore grid. Although the basic assumptions and case selection have varied, the overall evaluation of an integrated offshore grid has tended to be positive. The following table summarises the main assumptions and results of the different studies considered here.
Table 1 Comparison of recent studies on benefits of meshed offshore grids.
WindConnector NorthSea Grid Benefits of a meshed grid Strategic Infrastr. Developm. Offshore-Grid
Year of publication 2017 2017 2014 2014 2011
Author Pöyry on behalf of Tennet 3E, Deutsche WindGuard, CEPS, DNV GL, ECN, Imperial College on Subject analysed behalf of EC
Ecofys on behalf of EC Imperial College, E3G 3E, dena, EWEA, ForWind, IEO, NTUA, Senergy, SINTEF on behalf of EC
Subject analysed One hub-to-hub case between
Netherlands and UK 3 cases
German Bight: 2 OWF, 3 countries UK-Benelux: 3 OWF, 4 countries UK-Norway: 6 OWF, 2 countries
Whole North Sea, Irish Sea,
English Channel Whole North Sea Whole North Sea
Subject of comparison (base case)
Hub OWF connections Radial and hub OWF connections,
point-to-point interconnectors Radial OWF connections, lim-
ited number of point-to-point interconnectors
Optimal radial solution, point-to-point
interconnectors
Radial and hub OWF connections
Benefits More efficient infrastructure use (trading in less windy pe- riods) – increased occupancy rate, lower consumer energy costs
Greater availability and utilisation of infrastructure, increased level of interconnection, increased network security
Techno-economical, environ- mental, strategic; key benefits opportunities for trading and cross-border flows, better inte- gration of offshore wind capaci- ties, higher speed of construction
Savings in operation and net-
work investment costs Reduced cables, maritime space used, environmental impact; increased n-1 security, security of supply, security to wind farm operators due to re- duced losses in cases of failure Investment cost
behaviour <1.8 bn €
(Value of market- to market flows ‘more than offsets the investment required for the additional infrastructure’)
German Bight: -0.35 bn € UK-Benelux: +0.45 bn € UK-Norway: -0.55 bn € All: -0.45 bn €
Scenario 100 GW OWF: +7.8 bn € Scenario 67 GW OWF: +4.9 bn € Scenario 51 GW OWF: +10.3 bn €
-43 bn – -8 bn -6 – +1 bn € compared to radial case
+5.4 – 7.4 bn € compared to radial/hub base case
Overall benefit compared to base case
1.8 bn € German Bight: 1.2 bn €
UK-Benelux: 0.65 bn € UK-Norway: 0.35 bn € All: 2.3 bn €
Scenario 100 GW OWF: 5.1 bn €/a Scenario 67 GW OWF: 1.5 bn €/a Scenario 51 GW OWF: 3.4 bn €/a (annual savings in 2030)
25-75 bn € Split design: 1.02 bn €/a Direct design: 1.3 bn €/a Net presentvalue benefit:
16 bn € (split) and 21 bn € (di- rect) across a lifetime of 25 y.
Conclusion These studies are comparable with regard to the subject of analysis and comparison. The results tend to be in the same direction/can be explained by different case designs and slightly different methodolo- gies with regard to the details of CBA calculations.
These studies are comparable with regard to the subject of analysis and comparison. The results for the overall benefit tend to be in the same direction. A difference can be observed with regard to the investment cost, which increased in the Ecofys study and decreased in the Imperial College/E3G study, whilst the OffshoreGrid study quoted both options, depending on the type of base case. As the case design plays a significant role here, the differences are explicable.
3. CBA Methodology
The following chapter outlines the main objectives and the general methodology for the CBA of an integrated offshore grid in the Baltic Sea.
3.1 Main objectives
This CBA is a comparative analysis that does not evaluate whether a certain scenario is bene- ficial or not. Instead, the analysis compares scenarios with different levels of grid integra- tion to evaluate the costs and benefits associated with an increase in integration. Therefore, one assumption is that increased interconnection is beneficial and desirable. The question is which level of integration should be selected and how this can be assessed for different concrete scenarios.
The objective is to produce the following outputs:
· an overview of the disaggregated costs of integrated offshore grid scenarios
· an overview of the benefit difference between different levels of integration, primarily using system cost as a monetarised indicator
· a comparison of costs and benefits of different levels of integration
· conclusions for use in decision-making on the integration level of meshed offshore grids The following section outlines the CBA methodology, which was developed on the basis of a result-oriented strategy.
3.2 Methodology
The methodology applied in the CBA of an integrated offshore grid in the Baltic Sea is based on the ENTSO-E CBA methodology contained in the July 2016 draft version19, which provides criteria for the assessment of costs and benefits of European transmission projects. The ENTSO-E methodology is used in market and network development as a common frame- work for evaluating Ten-Year Network Development Plans (TYNDP), which in turn serve as the sole basis for the selection of candidate projects of common interest (PCIs).20 The proposed set of indicators has been adapted to accommodate the reduced complexity of a result-oriented CBA.21
ENTSO-E identifies the following main categories for project assessment22: Benefits
· socio-economic welfare (including RES integration and CO2 variation)
· losses
· security of supply (indicators: adequacy and system stability) Residual impacts
· environmental
· social
· other Costs
· total project expendituresw
For simplicity, these categories have been narrowed down to a reduced list of the most rele- vant indicators, as is recommended for a result-oriented CBA analysis.23 The following table presents the criteria used by ENTSO-E and the methodology used in this study. Residual impacts are excluded.
Table 2
Development of a list of key cost and benefit indicators based on ENTSO-E criteria Criterion Evaluation This study Remarks
Benefits
Socio- economic welfare
Central criterion for monetarised benefits
System costs Electricity prices
The socio-economic welfare is analysed on the basis of overall system costs.
The sub-criteria RES integration and CO2 variation are integrated results of the system costs.
The electricity prices as an in- dicator of consumer surplus are analysed for the different cases.
Losses Technical crite- rion, considered within case study development
Not analysed
As similar network projects with comparable technologies are analysed, the losses will not be the limiting criteria to compare.
Security of supply
Important criterion, no complete mone- tisation possible
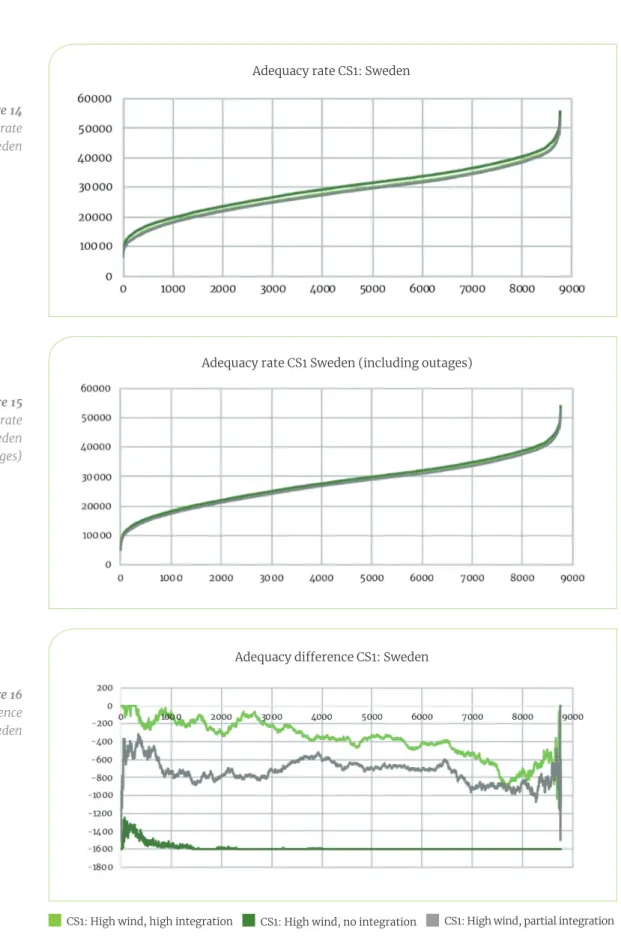
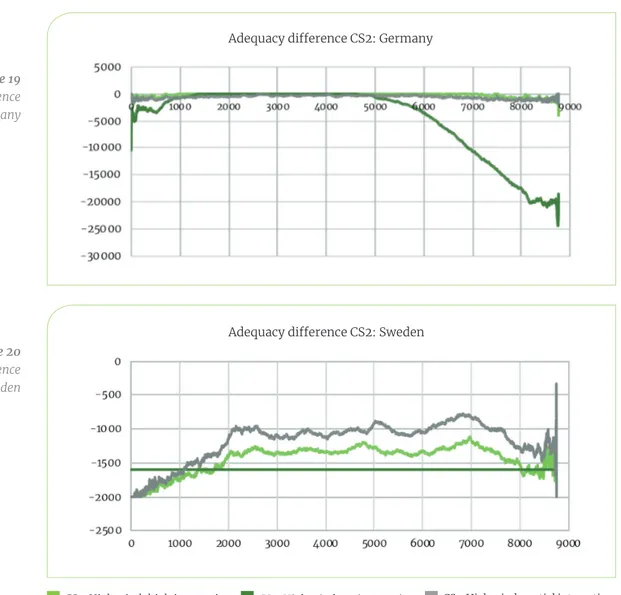
Adequacy rate
Because the base case already includes interconnectors, the security of supply does not change significantly between the cases, as indicated by the adequacy rate.
Because the model does not simu- late local congestion, the security of supply cannot be analysed di- rectly. The model is run including the assumption of DC line failures to analyse the influence on the adequacy rate.
Residual Impacts
Environ- mental, social, etc.
Usually no monetisation possible
Not analysed
The residual impacts are partly analysed within other working packages of the Baltic InteGrid project.
Costs
Total costs
Only the rough total project costs are considered for far-future projects
Disaggre- gated in- vestment costs
To develop profound results the cost assumptions are named in a disaggregated manner. As ENT- SO-E recommends for far-future projects to consider the invest- ment cost plus a complexity factor standing for the other cost param- eters, this study also concentrates on the evaluation of investment cost associated with a component specific factor for O & M and other costs.
Core indicators are the socio-economic welfare and the project expenditures. These indica- tors are fully monetised and weighed against each other. Additional indicators evaluate the security of supply of transmission systems. Costs and benefits are analysed in two separate models: a market model to evaluate the socio-economic welfare of the various scenarios and their individual security of supply, and a linear cost model (LCM) to calculate project capital (CAPEX) and operational expenditures (OPEX). All cash flows are discounted to the base year 2017 with a discount rate of 4 %, as suggested in the ENTSO-E guidelines.
In this CBA, the following measurement indicators are used:
For benefits
• system costs
• electricity prices
• adequacy rate (as an indicator for security of supply) For disaggregated investment costs (HVAC and HVDC)
• cables (material and installation)
• onshore nodes (converters/transformers, installation)
• offshore nodes (converters/transformers, breaker, platform, installation)
The costs and benefits are analysed separately in different models. The following figure pro- vides an overview of the general approach.
Figure 2 Methodology
All benefits are calculated by applying a market model that simulates the European grid and the European energy market. The model uses defined input parameters and optimises the grid to determine the best solution from a socio-economic point of view. The costs are derived from recent scientific publications and market announcements and are analysed using a LCM. The analysis is conducted from a high-level perspective. Technical and financial details are not taken into account because the objective is to obtain a general overview of the preferable level of integration in concrete scenarios. The methodology and models used to calculate the costs and benefits of design options for integrated offshore grid cases in the Baltic Sea are explained in detail in the following chapters.
Benefits Costs
System
Costs Adequacy
rate Electricity
Prices Cable
(AC&DC) Onshore
Nodes Offshore Nodes
Market Model Linear Cost Model
4. Investigation Scope – Pre-feasibility Studies
Two pre-feasibility studies were performed in the context of the Baltic InteGrid (BIG) pro- ject to assess two cases of OWF-interconnector integration.24 The CBA evaluates the costs and benefits of different levels of wind farm integration in these concrete cases. Case study 1 (CS1) assumes a connection between Poland, Sweden and Lithuania; in case study 2 (CS2), a connection between Germany, Sweden, and potentially Denmark (the island of Bornholm) is foreseen.
The two cases used for the pre-feasibility studies are located in the South Baltic Region be- cause, according to the BIG analysis of planned OWF projects, the majority of projects under development are located in this southern part of the basin. Case selection was based on on the following considerations: economic and spatial possibility of locating interconnection, potential OWF projects, projects identified in TYNDP, and consultation with TSOs. The following figure provides an overview of the locations of the two case studies.
Figure 3
Case study locations
Lithuania
Estonia
Latvia
Lithuania
Poland Sweden
Finland
Germany Denmark
2
1
For each case study, a total of six scenarios were developed to test the influence of two variables:
Level of integration and level of OWE development
1. Level of integration is defined as the degree to which the OWF projects are integrated with the relevant interconnections or with each other. The CBA investigates the costs and benefits of different levels of integration. The following integration levels are assumed in both case studies:
• Zero integration/Baseline scenario: no integration of OWFs with the planned intercon- nector; interconnectors are developed independently of the OWF export infrastructure.
• Partial integration: partial integration of OWFs with the interconnector and develop- ment of remaining OWFs in a radial configuration.
• Maximum integration: maximum integration of OWFs with interconnector and / or other OWFs.
2. Level of offshore wind energy development refers to the extent of OWE development in the study area. Due to high uncertainty regarding the level and speed of regional OWE development, the scenario assumes two OWE development rates. For each, a list of projects developed over time (in five-year intervals) was identified. The following scenarios are assumed in both case studies:
• High OWP: assumes rapid development of offshore wind in the region; most of the pro- jects planned and further projects with lower certainty are commenced within the PFS timeframe.
• Low OWP: projects develop at a slower pace, and only projects that have higher certainty and are more advanced stages of the development process are included.
The following table illustrates the systematic approach used to define case-study scenarios.
Table 3 Overview of the six case-study scenarios.
Level of integration
zero partial maximum
Level of offshore wind development High 1a 2a 3a
Low 1b 2b 3b
The pre-feasibility studies deliver expected snapshots of generation capacity by 2025, 2030, 2035, 2040, and 2045 (with greater uncertainty after 2030/2035). For each time step, a sys- tem-wide assessment was conducted for HVAC and HVDC grid components (multi-terminal to onshore connection point) and an inter-OWF component assessment was performed. A list of all components was developed for each case-study scenario and is used as an input for CBA. The list also includes component specifications (e.g. component type, ratings, voltage level, cable lengths).
Because the pre-feasibility studies serve as the main basis for the CBA analysis, it is impor- tant to describe their concrete design and outline the different scenarios included in each of the two case studies.
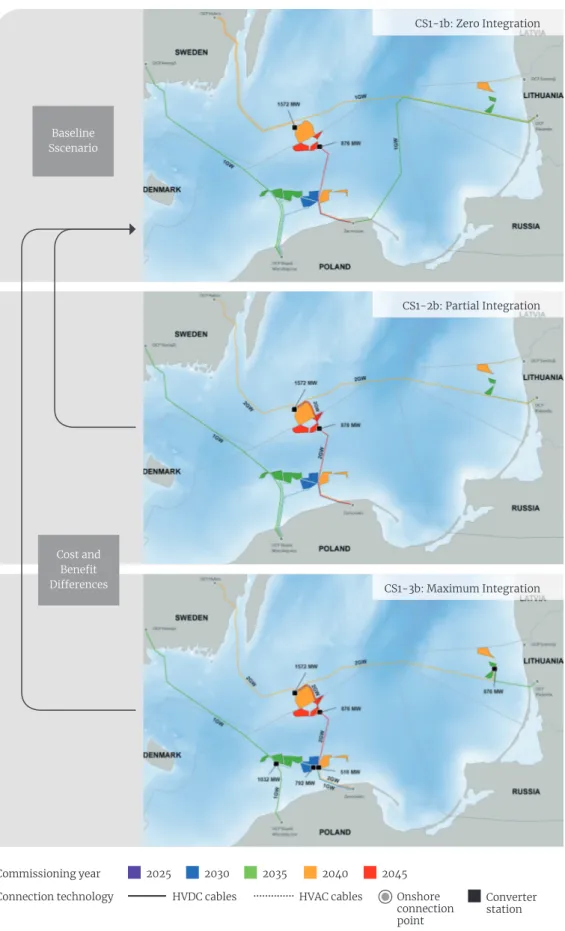
Case study 1: Sweden – Poland – Lithuania
The following fi gure illustrates the general layout and approach used in case study 1 with high off shore wind installation (‘CS1-High’).
Figure 4
Case study 1 with high off shore wind installation
2025
Converter station
2030 2035 2040 2045
HVDC cables HVAC cables Onshore connection point Commissioning year
Connection technology
CS1-3a: Maximum Integration CS1-2a: Partial Integration CS1-1a: Zero Integration
Baseline Sscenario
Cost and Benefi t Diff erences
The following fi gure illustrates the general layout and approach used in CS1 with low off - shore wind installation (referred to as ‘CS1-Low’ in the text that follows).
Figure 5 Case study 1 with low off shore wind installation
CS1-3b: Maximum Integration CS1-2b: Partial Integration
2025
Converter station
2030 2035 2040 2045
HVDC cables HVAC cables Onshore connection point Commissioning year
Connection technology
CS1-1b: Zero Integration
Baseline Sscenario
Cost and Benefi t Diff erences
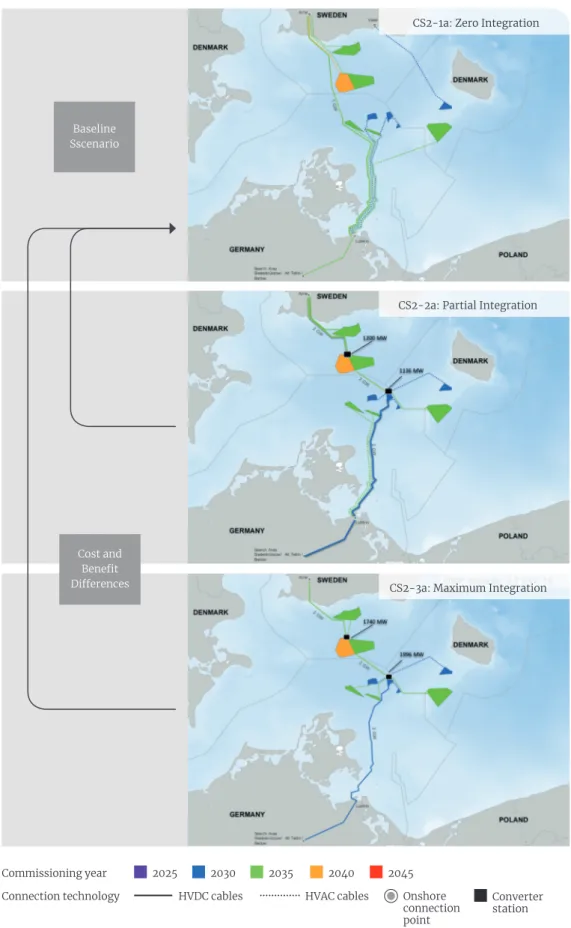
Case Study 2: Germany – Sweden – Denmark
The following fi gure illustrates the general layout and approach for CS2 with high off shore wind installation (‘CS2-High’).
2025
Converter station
2030 2035 2040 2045
HVDC cables HVAC cables Onshore connection point Commissioning year
Connection technology
CS2-3a: Maximum Integration CS2-2a: Partial Integration
CS2-1a: Zero Integration
Figure 6 Case study 2 with high off shore wind installation Baseline
Sscenario
Cost and Benefi t Diff erences
The following fi gure illustrates the general layout and approach used in CS2 with low off - shore wind installation (‘CS2-Low’).
2025
Converter station
2030 2035 2040 2045
HVDC cables HVAC cables Onshore connection point Commissioning year
Connection technology Figure 7
Case study 2 with low off shore wind installation
CS2-3b: Maximum Integration CS2-2b: Partial Integration CS2-1b: Zero Integration
Baseline Sscenario
Cost and Benefi t Diff erences
For each of the four combinations of study region and offshore wind installation, the zero-integration variant is set as the baseline scenario. In the CBA, the scenarios that assume the integration of OWFs with interconnectors are compared to the baseline scenario.
This makes it possible to compare the relative benefits of partial or maximum integration with those of a non-integrated interconnection design and to identify the optimal level of integration.
5. Analysis of Benefits
This chapter analyses the relative benefits of varying levels of integration, primarily using system cost as a monetarised indicator. The sections below describe the market model used, as well as the main input parameters and assumptions. The monetarised and non-monetarised results are presented with regard to potential benefit differences. The analysis of benefits includes the difference in total system costs, which the model shows for different levels of integration. The total system costs includes the costs of generation and investment in gen- eration and transmission capacity in the scenarios, excluding the investment needed for the case-specific infrastructure. The benefit difference for the overall system can therefore be compared between the specific case and the base case; this result can be analysed and later compared to the case-specific cost. A subsidiary result of the model is the case-spe- cific effect on electricity prices in the relevant markets. As non-monetarised results, the case-specific effects on the adequacy rate (indicating security of supply) are analysed, as is the ratio of CO2 emissions reductions in different countries.
5.1 Market Model
The dynamic investment and dispatch model dynELMOD is used to determine the benefits of additional integration between OWFs and the interconnections between market areas.
The model determines cost-effective investments into generation capacities, storages, and interconnectors for Europe through 2050. The model therefore represents the electricity market as a whole, and the resulting system costs reflect the total costs of providing elec- tricity in Europe under given conditions, such as emissions targets. Under the assumption of an efficient market, the objective of a cost-minimising social planner is equivalent to wel- fare maximisation. Given that the merit-order market clearing leaves little potential to exert market power and a generally high level of regulation, this assumption is reasonable for the electricity sector. The socio-economic benefits in the model context mostly relate to effi- cient use of the given resources (e.g. available renewables).
By integrating the generation and investment decision, the model not only dispatches the given infrastructure to cover the electricity demand in a cost-minimising way, but also determines the infrastructure used. This yields the total system costs (including benefits), because each investment or generation decision is taken to minimise system cost. This indicates a cost-efficient infrastructure to provide electricity.
The starting point in the methodology is the current power plant portfolio installed in the European electricity system, which is phased out according to the technical lifetime. Invest- ments in new capacities are made under the restrictions of CO2 emissions pathways and assumptions on investment, emissions, and fuel costs. The modelling approach is intended to integrate this two-step process:
Investment: First, the model determines investments in generation capacity, including storage capacities, and interconnectors. It is important to note that the investments spe- cific to certain cases (grid topology for different integration levels) are excluded from this determination, because the data on investment costs are collected in the cost analysis and later compared to the benefit results. To reduce computational complexity, and thus permit the representation of a large geographic region, a reduced set of hours is used in this step of the investment analysis. Instead of using the full 8760 hours, the model only uses certain hours, depending on model complexity. This time-frame reduction technique is described
in Gerbaulet and Lorenz (2017).25 The methodology ensures that the reduced set of hours ac- counts for the characteristics of seasonal and time-of-day variations in the input parameters.
Dispatch: Using this cost-efficient electricity-generation portfolio, the model is solved again with the entire time set of 8,760 hours, with the investment decisions fixed. This ensures the reliability of the power plant portfolio test for system adequacy in all cases.
Combining both steps generates the model output.
The objective function of the model represents the total system cost, including costs of gen- eration and investment in generation and transmission capacity. The market-area-sharp market clearing then balances local demand with flows to and from the respective market areas. Generation and transport variables are subject to upper bounds that are defined by the model inputs and endogenous calculated investments in capacity extension or new capac- ities. There are also constraints on the general behaviour of power plants (e.g. ramping and CHP constraints), storage-specific constraints (e.g. regarding reservoir level and turbine and pump capacities), and the implementation of European emissions targets. The model is written and solved in the General Algebraic Modeling System (GAMS) using the CPLEX solver, and the full formulation is available and documented in Gerbaulet and Lorenz (2017).
5.2 Main input parameters and assumptions
As for all large-scale electricity sector models, the data set plays a crucial role in the result and transparency of the model. Therefore, we use open-source data or our own calculations where possible, and the full dataset is part of the publicly available model documented in Gerbaulet and Lorenz (2017). The most important assumptions regarding the data set and future developments are listed below.
• Installed capacity: Apart from the offshore capacities in the scenario data, the data for current installed capacity and future generation capacity are drawn from the scenarios in TYNDP 201626 and the Scenario Outlook & Adequacy Forecast 2015.27
• Generation technologies: The model distinguishes between 31 renewable and conventional generation technologies, taking into account the technical and economic parameter assumptions described in Schröder et. al (2013).28
• Fuel prices: Prices for fuels are taken from the European Commission’s Reference Scenario 2016, and projections are based on Schröder et. al (2013).
• Time series: The structure of availability of renewable generation is based on the year 2013. The demand data come from the ENTSO-E transparency platform,29 and both raw and processed meteorological data are drawn from various sources.
• Grid: For the load flow constraints, a country-sharp power transfer distribution factor (PTDF) matrix for the European high voltage grid is used, representing the physical flows. The underlying high-voltage network topology consists of five non-synchronised high-voltage electricity grids (Continental Europe, Scandinavia, Great Britain, Ireland, and the Baltic countries) with operating voltages 150kV, 220kV, 300kV, and 380kV, re- spectively. These data are based on the documentation in Egerer et al. (2014).30
• CO2 pathway: The CO2 emission pathway is based on the scenario ‘Diversified supply technologies’ from the European Commission’s Energy Roadmap 2050 (2011).31 It uses the limits allocated to the electricity sector and is based on a 90 % emission reduction by 2050.
• The data specific to the case studies (i.e. the topology and OWF development (low, high) and the level of integration (zero, partial, maximum/high)) were derived in the course of the project and documented in chapter 4.
5.3 Monetarised Results
To achieve a meaningful comparison between the different scenario dimensions for each of the two case studies described in chapter 4, the model is run for the zero-integration scenario to determine the investments in generation capacities. The resulting investment decisions are then used in the partial- and high-integration scenarios to determine whether a higher level of integration corresponds to lower overall system costs, meaning a more cost-efficient dispatch or investment in interconnector capacity. While each scenario represents a social optimum, comparing the individual topologies yields the additional social benefit of specific topologies and wind farm developments. The results are classified as mon- etarised or non-monetarised to account for all aspects of the ENTSO-E CBA methodology.
The monetarised results refer to those which are in some way quantified in the objective function of the model and therefore a direct result of the optimisation. Non-monetarised results are not quantified in the optimisation and are an indirect result of the model.
5.3.1 Main Results – Total System Cost
The main results are the differences between overall system costs for each scenario. These are shown in Table 4. As stated above, the total system costs reflect the cost-optimal in- vestment and generation decision based on the scenario-specific data. The difference be- tween the zero-integration and higher levels of integration is determined; this result is then used to assess whether variations in topology are associated with different outcomes that have lower total systems costs as a direct result of the specific change in topology and OWF development, therefore directly reflecting additional benefits. The comparison between the base case and a partial- or high-integration case also implies, however, that benefits of the infrastructure available in the base case (e.g. additional interconnector capacities) are not captured. Costs are classified as operation and maintenance costs (O & M); generation costs;
and costs of investment in generation, storage, and grid infrastructure. All graphs show that there is no difference in investment in generation infrastructure. This is because the invest- ment decision in the zero-integration base case is also assumed in the two cases with higher levels of integration.
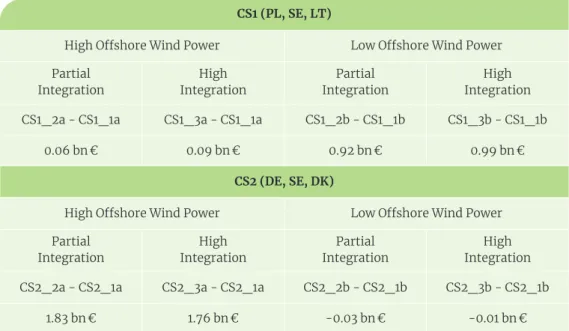
Table 4 Overall system cost differences in 2017 bn €
CS1 (PL, SE, LT)
High Offshore Wind Power Low Offshore Wind Power Partial
Integration High
Integration Partial
Integration High
Integration CS1_2a - CS1_1a CS1_3a - CS1_1a CS1_2b - CS1_1b CS1_3b - CS1_1b
0.06 bn € 0.09 bn € 0.92 bn € 0.99 bn €
CS2 (DE, SE, DK)
High Offshore Wind Power Low Offshore Wind Power Partial
Integration High
Integration Partial
Integration High
Integration CS2_2a - CS2_1a CS2_3a - CS2_1a CS2_2b - CS2_1b CS2_3b - CS2_1b
1.83 bn € 1.76 bn € -0.03 bn € -0.01 bn €
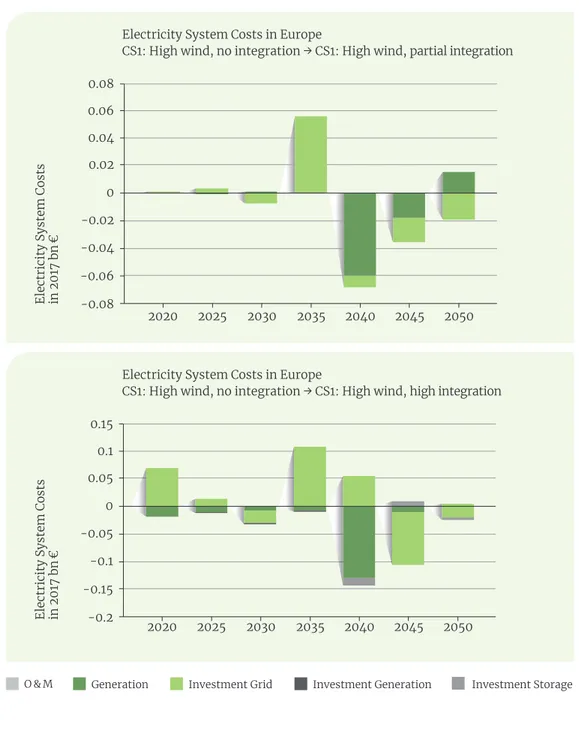
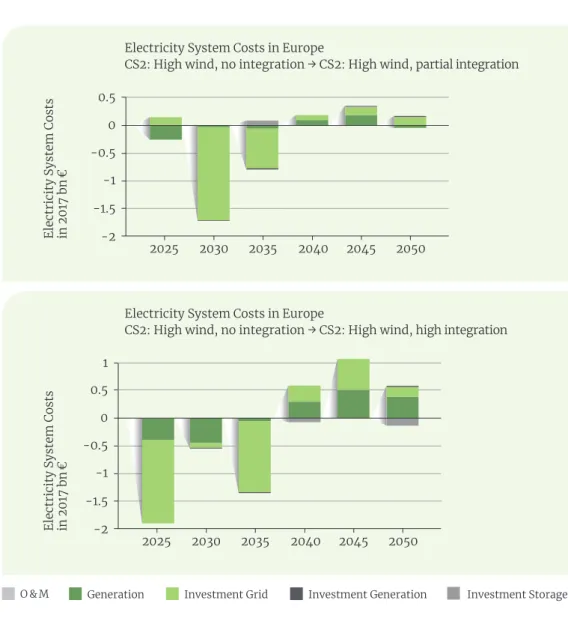
Both case studies show little diff erence between partial and maximum integration scenarios.
There is, however, a cost reduction in the low-wind scenario in case study 1 (CS1); in case study 2 (CS2), the cost diff erence occurs in the high-wind scenario. In CS2, there is even a small benefi t in the low-wind scenario. The fi gures below show the disaggregated costs, allowing for a comparison of no integration and partial integration. A cumulative negative value indicates that the total system costs are lower in the scenario with partial or high in- tegration. For the cases with signifi cant benefi ts (i.e. low wind in CS1 and high wind in CS2), reduced investment in interconnectors leads to the overall cost decrease. The increased inte- gration in those cases allows for greater fl exibility in transport, which is why a lower inter- connector capacity is needed. The scenarios with marginal benefi ts also show cost diff erences, although the overall impact is smaller, and the additional costs equalise the reduced costs.
Figure 8
Total system costs:
case study 1 – low wind 0.4
0.2 0.0 -0.2 -0.4 -0.6
-0.8 2020 2025 2030 2035 2040 2045 2050
0.4 0.2 0 -0.2 -0.4 -0.6 -0.8
-1 2020 2025 2030 2035 2040 2045 2050
Electricity System Costs in Europe
CS1: Low wind, no integration → CS1: Low wind, partial integration
Electricity System Costs in Europe
CS1: Low wind, no integration → CS1: Low wind, high integration
O & M Generation Investment Grid Investment Generation Investment Storage Electricity System Costs in 2017 bn €
Electricity System Costs in 2017 bn €