The response of the
Baltic Sea sponge Halichondria panicea upon challenge with Vibrio bacteria
Masters Thesis submitted by
Theresa Kuhl
September 22nd 2016 - March 27th 2017 at
FB3, Research Unit Marine Molecular Ecology GEOMAR - Helmholtz Centre for Ocean Research Kiel
Supervisor: Dr. Lucía Pita Galán (GEOMAR) First examiner: Prof. Dr. Herwig Stibor (LMU)
Second examiner: Prof. Dr. Ute Hentschel Humeida (GEOMAR)
2
Content
1. Zusammenfassung ... 4
2. Abstract ... 5
3. Introduction ... 6
4. Material and Methods ... 11
4.1. Halichondria panicea ... 11
4.2. Sponge aquaculture ... 12
4.3. DNA and RNA extraction ... 14
4.4. Phylogenetic analysis ... 14
4.5. Experimental set-up for immune response experiment set-up ... 15
4.6. Antimicrobial assay (AM) ... 17
4.7. Candidate genes and primer design for RT-qPCR ... 18
4.8. RT-qPCR optimization ... 20
4.9. RT-qPCR experiments ... 22
5. Results ... 23
5.1. Phylogenetic analysis ... 23
5.2. Sponge aquaculture ... 26
5.3. Immune response experiment ... 27
5.4. Antimicrobial assay ... 28
5.5. RT-qPCR analysis ... 31
6. Discussion ... 33
6.1. Phylogenetic analysis ... 33
6.2. Aquaculture ... 33
6.3. Immune response experiment ... 34
7. References ... 39
8. Acknowledgements ... 45
9. Appendix ... 46
9.1. Additional samples ... 46
9.1.1. Bacterioplankton samples for 16S rRNA analysis ... 46
9.1.2. Sponge material in RNAlater ... 46
9.2. Supplementary Material ... 46
9.2.1. Fluorescein results ... 46
9.2.2. Light intensity and temperature in IR2 experiment (HOBO logger) ... 47
9.2.3. Oxygen, temperature, pH, and salinity in IR and IR2 experiment... 47
9.2.4. Results of antimicrobial assay within treatments ... 48
9.2.5. Genbank ID of species in phylogenetic trees (18s rRNA, ITS-2 and COI mtDNA) ... 49
3
9.2.6. Standard curves for primers used in RT-qPCR ... 51
9.2.6.1. Actin (reference gene) ... 51
9.2.6.2. Hsp70 (target gene) ... 52
9.3. Procedure Protocols ... 53
9.3.1. NUCLEIC ACID EXTRACTION FOR TRANSCRIPTOMICS ... 53
9.3.2. cDNA transcription (iScript™ Select cDNA Synthesis Kit) ... 58
9.3.3. FIXATION FOR FLOW CYTOMETRY OF PHYTOPLANKTON AND BACTERIA IN SEAWATER ... 59
9.3.4. ExperionTM(ExperionTM RNA StdSens Starter Kit) ... 61
10. Declaration of authorship ... 68
4
1. Zusammenfassung
Schwämme (Stamm Porifera) nehmen über ihre filtrierende Ernährungsweise ständig Mikroorganismen auf, darunter auch potentielle Pathogene, während sie zeitgleich spezifische mikrobielle Gemeinschaften beherbergen. Es ist noch nicht bekannt wie Schwämme die unterschiedlichen Mikroorganismen voneinander unterscheiden (Symbionten, Nahrung, Pathogene). Ich stellte die Hypothese auf, dass das „angeborene“ Immunsystem des Schwamms eine Rolle spielen könnte, um eine spezifische Reaktion gegenüber den Mikroorganismen hervorzurufen. Darüber hinaus ist die Rolle des
„angeborenen“ Immunsystems in Bezug auf das Immungedächtnis in Invertebraten aktuell von Interesse, da es hilft, mehr über die Interaktionen von Wirt und Mikroorganismen zu erfahren. Das Immungedächtnis in Invertebraten erfüllt eine ähnliche Funktion wie in Vertebraten, beruht jedoch auf anderen molekularen Mechanismen.
Ich wollte die potentiellen Wege zur Erkennung von Mikroorganismen in Schwämmen untersuchen und entwickelte dazu einen experimentellen Ansatz. Der Schwamm Halichondria panicea konnte erfolgreich in einer Aquakultur gehalten werden. Im Experiment wurde er einem autochthonen Vibrio Stamm aus der Ostsee und einem exogenen Vibrio Stamm aus dem Mittelmeer ausgesetzt. Als Kontrolle diente steriles, künstliches Meerwasser. Die Immunreaktion wurde mit einem antimikrobiellen Assay und mit differentieller Genexpressions-Analyse (z.B., RT-qPCR des Zielgens hsp70) untersucht. Ich erwartete eine differenzierte Immunreaktion des Schwamms gegenüber den zwei unterschiedlichen Bakterienstämmen. Unter der Hypothese des Immungedächtnis, erwartete ich darüber hinaus eine stärkere Immunreaktion in H. panicea gegen den exogenen Vibrio Stamm im Vergleich zu dem autochthonen Vibrio Stamm. Die Schwämme wurden in einem Durchflusssystem mit der Suspensions-Methode nach Barthel & Theede (1986) gehalten. Die Probenentnahme fand nach 6h und 24h statt. Der antimikrobielle Assay zeigte die stärkste Immunreaktion nach 6 Stunden in Form eines größeren Halos. Insgesamt war die Reaktion gegenüber dem Vibrio Stamm aus dem Mittelmeer stärker. Die real-time quantitative PCR (RT-PCR) wurde für actin (Referenzgen) und hsp70 (Zielgen) in H. panicea optimiert. Die Expression des heat shock protein Hsp70 war nach der Injektion mit dem Vibrio aus dem Mittelmeer erhöht. Diese Studie stellt neue Erkenntnisse zur Immunreaktion von Schwämmen, in diesem Fall H.
panicea, gegenüber unterschiedlichen Bakterienstämmen dar und suggeriert Spezifität gegenüber unterschiedlichen Bakterien in diesen basalen Metazoen.
5
2. Abstract
Sponges (phylum Porifera) constantly encounter microbial cells, including potential pathogens, during their pumping activity, while harbour diverse and specific symbiotic microbial communities. However, how sponges detect and distinguish different microbes (e.g., symbionts vs food bacteria vs potential pathogens) remains unknown. I hypothesized that their innate immune system could be involved to provide specific recognition of microbes by ways of immune memory. I aimed to investigate potential pathways of bacteria recognition in sponges by adopting an experimental approach. First, an aquaculture flow-through system for Baltic sponges was optimized. Then, sponges were challenged with either an autochthonous Vibrio strain isolated from the Baltic Sea (VB) or an exogenous Vibrio strain isolated from the Mediterranean Sea (VM). Sterile artificial seawater was used as control. The immune response of the sponge was monitored by ways of antimicrobial assays and differential gene expression analysis (e.g., RT-qPCR of targeted gene hsp70). I expected a differentiated immune reaction of the sponge towards the two different bacteria strains. Moreover, under the hypothesis of immune memory, I expected a stronger immune response in H. panicea against the exogenous Vibrio compared to the autochthonous Vibrio. Sponges were successfully kept in a flow-through system with a suspension method according to Barthel & Theede (1986).
Sampling occurred at two time points (6h and 24h). The antimicrobial assay showed the strongest immune reaction after 6 hours in form of a bigger halo diameter. The overall reaction was higher in the sponges treated with VM. The real-time quantitative PCR (RT- qPCR) was optimized for actin (reference gene) and hsp70 (target gene) in H. panicea. The expression level of the heat shock protein Hsp70 was increased in the VM treatment. This study provides further insights in sponges’ immune reaction to varying bacterial strains suggesting specificity towards different bacteria in these basal metazoans.
6
3. Introduction
Multicellular organisms arouse in a world dominated by microbes and, since then, animal evolution has been strongly influenced by animal-microbe-interactions (Nyholm & Graf 2012). Animals and microbes not only shared the same environment, but also get involved in stable symbiotic associations. The term “symbiosis”, defined by Anton de Bary, is used to describe close interactions of organisms from different species, regardless of the benefits and costs derived from the association. Some microorganisms may be harmful (pathogenic) or beneficial (mutualistic) to the animal host, but in both cases they influence animal biology, ecology and development (Nyholm & Graf 2012). Symbiotic relationships, such as the Hawaiian bobtail squid Euprymna scolopes and the luminous bacterium Vibrio fischeri (Nyholm & McFall-Ngai 2004) or the symbiosis of corals and the dinoflagellate Symbiodinium sp. (Stat et al. 2008) are not just specialized exceptions. Every individual animal can be considered as a community of host and microbes (the so-called holobiont) and this new perspective has deeply impacted the understanding of the natural world (McFall- Ngai et al. 2013).
Animals require mechanisms to control and maintain homeostasis with symbiotic communities while preventing cheating or pathogenic infections (McFall-Ngai et al. 2013).
Animal innate immunity can mediate specific microbial recognition and animal-microbe interactions (Nyholm & Graf 2012). Traditionally, the innate immune system has been considered as the mechanism for anti-pathogenic defense (Owen et al. 2009; Janeway &
Medzhitov 2002). Most recently, evidence arouse that innate immunity is also involved in maintaining the equilibrium of symbiotic host-microbe interactions (Chu & Mazmanian 2013).
The innate immune system can detect efficiently between self and non-self (Schulenburg et al.
2007) and is characterized by a quick response, within minutes to hours (Owen et al. 2009).
The innate immune response to microorganisms relies on the recognition of molecules and molecular patterns associated with microbes. These molecular patterns were first termed PAMPs (Pathogen associated molecular pattern) but now are often named MAMPs (Microbe associated molecular pattern), as they are not restricted to pathogenic microorganisms.
MAMPs are conserved, repeating components on the surfaces of microbes such as carbohydrate structures (peptidoglycan), lipopolysaccharides (LPS) or viral proteins. Pattern recognition receptors (PRRs) of animals recognize MAMPs and activate signal cascades, which lead to the expression of immune response proteins. The best known PRR is the Toll- like receptor (TLR) (Lemaitre et al. 1996) with extracellular leucine-rich repeats (LRRs) for
7 binding of MAMPs. Other PRRs are NLRs (NOD-like receptors), CLRs (C-type lectin receptors), RLRs (retinoic acid-inducible gene-I-like receptors) and SRCR (scavenger receptor cysteine-rich) (Owen et al. 2009; Mukhopadhyay & Gordon 2004; Hanington et al.
2010). Not all metazoan organisms contain the same receptor repertoires. Their structure may differ from the classical PRRs and functions of some receptors can also vary from the known function in vertebrates (degenerated TLR-pathway in Cnidaria: Hemmrich et al. 2007, Porifera: Srivastava et al. 2010; Riesgo et al. 2014; Bosch et al. 2009).
The TLR-signaling cascade seems to be highly conserved in animals and is one of the best described innate immunity pathways. After binding of a MAMP, the TLRs dimerize and the adaptor proteins, such as MyD88 (myeloid differentiation primary response 88 factor), attach to the intracellular TIR domain. This activates a signal cascade which involves several signal proteins, such as the nuclear factor kappa-light-chain-enhancer of activated B cells (NF kB), where at the end yield changes in gene expression, such as synthesis of antimicrobial proteins.
The activated effectors differ depending on the symbiont or pathogen encounter. For example, the pathway of antimicrobial peptides is known to build effective defensive weapons against pathogens (Zasloff 2002), whereas the cnidarian Hydra can express species-specific antimicrobial peptides to shape its commensal microbial community (Franzenburg et al. 2013).
The innate immunity pathways are highly conserved and of early origin (Hemmrich et al.
2007) and the gene classes developed already before porifera and eumetazoa diverged (Larroux et al. 2006).
Invertebrate immunity can be highly specific, with different immune reaction upon different strains (Milutinovic & Kurtz 2016; Kurtz 2004). Specificity in the immune system seems to have primarily developed for adequate self/non-self recognition instead of pathogen defense (Kurtz 2004; Schulenburg et al. 2007). However, specific recognition of microbes would present evolutionary advantages not only to prevent the rejection of the symbiotic microbiota, but also to save the energetic investment of an inflammatory response against non-pathogenic microbes. Actually, mechanisms that combine specificity with immune memory would allow the organism to react faster and more effective on subsequent exposure to the same microbe by storing information about the first encounter. Immune memory was supposed to be restricted to vertebrates, but in recent years, evidences aroused that the concept also exists in invertebrates (ctenophores: Bolte et al. (2013); cnidarian: Brown & Rodriguez-Lanetty (2015)). Immune memory in invertebrates might be similar in function to vertebrate adaptive
8 immunity but based on different molecular mechanisms within innate immunity (Schulenburg 2007). The presence of immune memory in basal metazoan such as Ctenophora and Cnidaria (Bolte et al. 2013; Brown & Rodriguez-Lanetty 2015) suggests an ancient origin of this process and opens question on whether it is also present in other early diverged phyla, such as sponges.
Sponges (Phylum Porifera) belong to the phylogenetic oldest clades within metazoa and developed over 600 million years ago in the precambrian era (Li et al. 1998). Therefore, they are important for addressing evolutionary questions and identify conserved vs novel animal traits throughout animal evolution. Additionally, sponges represent a prominent example of complex animal-microbe interactions. When pumping water through their canal system, sponges encounter many different kinds of microbes, including potential pathogens and food bacteria, while harbor diverse and specific symbiotic microbial communities (Thomas et al.
2016; Taylor et al. 2007; Erwin et al. 2011; Webster & Taylor 2012). However, it is unknown how sponges detect and distinguish different kinds of microbes (e.g., symbionts vs food bacteria vs potential pathogens). Research on this early-diverging metazoan clade may provide insights into conserved mechanism of animal-microbe interaction (Pita et al. 2016;
Thomas et al. 2016).
Sponges are abundant in all temperature zones including polar regions, from shallow water to the deep sea and also in freshwater ecosystems (Taylor et al. 2007). They play a significant role in benthic communities throughout the world. For instance, they influence nutrient cycles and ecosystem productivity by transferring dissolved organic matter to higher trophic levels, the so-called “sponge loop” (de Goeij et al. 2013). Additionally, they attract biotechnological interests for new pharmaceutical compounds produced by sponge and/ or its microbes (Mehbub et al. 2014; Indraningrat et al. 2016; Leal et al. 2012).
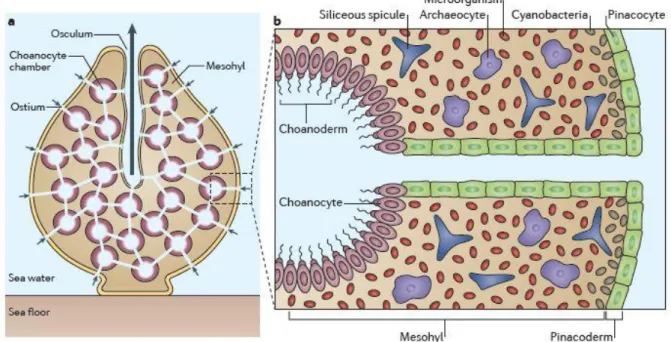
The simple poriferan body plan is unique among metazoans (Riesgo et al. 2014). Sponges do have epithelia, but lack true tissues and organs (Dunn et al. 2015). The pinacoderm separates the sponge from the surrounding seawater and builds the outer layer. Beneath the pinacoderm is the mesohyl, which is the functioning layer of the sponge (Fig.1a), and where metabolism, reproduction, nutrient transfer and cell communication components are located. Inside the mesohyl the totipotent amoeboid archeocytes and symbiotic microbes are distributed (Webster et al. 2007). Sponges are filter feeders and water enters the body via open pores in the
9 pinacoderm passing an aquiferous system of canals inside the sponge and exits the sponge via the osculum. The choanocytes are filtering cells and produce water flow with their continuous beating flagellum. Choanocytes are the cells, which are mainly exposed to the environment (Fig.1b).
Fig. 1: a Scheme of typical demosponge bodyplan. b Section of the internal structures of a demosponge (original figures in Hentschel et al. 2012)
Despite the apparent simple body plan, genomic data suggests a high complexity in sponges (Riesgo, et al. 2014). Genomic information of several sponges, e.g.
Amphimedon queenslandica, Oscarella carmela, Stylissa carteri and Suberites domuncula (Srivastava et al. 2010; Ryu et al. 2016; Riesgo et al. 2014) shows that sponges share an unexpectedly large complement of genes with other metazoans, including genes involved in cell–cell communication, signaling, or immunity. Several putative PRR-encoding genes were found in sponges, such as a TLR related receptor, LPS-binding-protein-like (LBL) proteins, putative NLRs and SRCR proteins. All of the PRRs present conserved domains but different structure to the classical PRRs described in other organisms, e.g. none of the sponge TLR-like receptors contains LRRs, what is normally the typical MAMP-binding site (Hentschel et al. 2012; Webster & Thomas 2016). Components of the immune signaling cascade, such as NF kB or MyD88, were found in sponge transcriptomes.
However, the availability of innate immunity genes in the genome and transcriptome of sponges does not confirm the real function of the expressed molecule in the sponge (Riesgo et al. 2014). For instance, in Caenorhabditis elegans the TLR cascade is not involved in immunity (Couillault et al. 2004). In sponges, the function of MyD88
10 involved in the recognition cascade of gram-negative bacteria has been reported (Wiens et al. 2005), but the overall empirical evidence for gene functions in the innate immunity pathway is still scarce.
In this Master’s thesis, I aimed to unravel the function of potential immune genes in sponges upon encounter with different bacterial strains. The low-microbial-abundance sponge Halichondria panicea of the Baltic Sea was exposed to heat-killed Vibrio bacteria and the immune response of the sponge was monitored by ways of antimicrobial assays and differential gene expression analysis (e.g., RT-qPCR of targeted genes). Heat-killed bacteria strains were successfully used in other invertebrate studies on immune challenge (Roth et al. 2009; Trapani et al. 2016; Zaragoza et al. 2014; Bolte et al. 2013) and Vibrio strains in general are commonly used for immune challenge experiments in marine invertebrates (Wright et al. 2013; Lokmer & Wegner 2015; Bolte et al. 2013). Two Vibrio strains were applied by injection of heat-killed bacteria in the mesohyl of the sponge. The sponge was supposed to be completely naive towards the exogenous Vibrio strain, whereas the autochthonous Vibrio strain might have been encountered before. I expect differential gene expression after Vibrio encounter and stronger response to the exogenous Vibrio strain, consistent with the evolutionary concept of reducing costs and self-damage of specific immune defense. By combining molecular analysis with an experimental approach, this study contributes to current research priorities in sponge microbiology, such as reveal host mechanisms involved in sponge-microbe interactions (Webster & Thomas 2016).
11
4. Material and Methods
4.1. Halichondria panicea
H. panicea (Pallas, 1766), with the common name “breadcrumb sponge” is a marine sponge of the class Demospongiae. It belongs to the family Halichondriidae and the genus Halichondria, with 109 accepted species and more than 200 unconfirmed species (WoRMS, 28.01.2017). H. panicea is widely distributed in the Northern Hemisphere from the Baltic and North Sea to the North Eastern Atlantic, with sister groups in the North Pacific (Erpenbeck et al. 2004). The main habitat is the intertidal zone, but H. panicea can also appear in the sublittoral and down to 500 m depth. Several morphotypes are known for H. panicea:
compact, encrusting and branched forms. Also, their color varies between yellow, grey and greenish.
The specimens investigated in this study belonged to the Baltic Sea population of H. panicea from Kiel Bight, where this species is one of the most abundant species of sponges (Barthel 1986). They live mainly on Red algae of the phylum Phyllophora sp. or Phycodrys sp., but also on hard substrates such as rocks. Growth, reproduction, spermatogenesis, energy budget and biomass production were extensively investigated (Barthel & Detmer 1990; Witte et al.
1994; Barthel 1986). Their lifecycle starts in spring from a planktonic larval stage that transform to the adult sponge after settling on either hard substrate or red algae. Over the summer period the sponge’ body volume increases until it reaches the maximum in August.
With progressing seasons the sponge mass decreases and almost disappears in winter (Barthel, 1985; 1986; 1988). Every few weeks H. panicea sloughs off its outer tissue. The cause is unknown, but is hypothesized that could be a mechanism to prevent sedimentary clogging of its ostia or fouling (Barthel & Wolfrath 1989). Despite the intensive studies on physiology, morphology and ecology, only little genetic information is available on H. panicea and its genome is not sequenced.
Because of their high abundance H. panicea plays an important role in the habitat of the Kieler Bay e.g. by providing nutrients to the surrounding seawater (Barthel 1988). The genus Halichondria is also relevant for biotechnological interests for the production of antimicrobial, antifungal or cytostatic compounds, either produced by the sponge itself or by associated microbes (Blunt et al. 2007; Clark et al. 1992). Finally, due to its amenability to aquaculture, it has become a potential model organism for the study of host-microbe-environment
12 interactions at Geomar (Pita et al. 2016). The morphotypes of H. panicea in this study were yellow and red colored and of branched form.
4.2. Sponge aquaculture
Sponges of the species H. panicea were provided by Claas Hiebenthal (KIMOCC, Geomar Helmholtz Centre for Ocean Research Kiel) and sampled at Kieler Mussel farm (54°
22.558’N, 10° 9.786’E), Baltic Sea at 6 m depth. Cultivation conditions were orientated on the work of Barthel & Theede (1986) and Westphal (1988). The sponges were maintained in an open flow-through system with direct uptake of Baltic Sea water, which will keep biological and physical parameters of the water at similar conditions (temperature; pH;
salinity) as in the field. The water is provided via a header tank to oxygenate the incoming water to the aquaria (Fig. 2).
Fig.2: A, C Sponge aquaculture with a flow-through system. B sponge individuals in the tanks.
H. panicea lives regularly attached to algae and therefore a floating state enhance its maintenance in aquaculture (Barthel & Theede 1986). Sponges were attached to nylon strings on top of the aquarium and to a small stone on the bottom (as weight) with a 0.2 mm nylon string (Fig. 3). PE beads were added under the sponges to prevent them from sliding down.
Handling of sponges occurred always under water to avoid air embolization.
13
Fig.3: Attachment of sponges (here in Experimental aquarium system).
Each aquarium was 25x40x25 cm big and covered outside by black foil to simulate the low light conditions in the red algae zone. The top of the aquaria were covered with Plexiglas lids.
A filter system of three filter stages (50µm, 10µm, 5µm) was tested to reduce sediment intake in aquaria. However, it had to be removed due to quick cloaking of filters (i.e., within hours), which could stop the water flow in the system.
After setting up the system, a cleaning and care protocol was developed and included weekly cleaning, feeding and water physical parameter measurement. Sponges were fed with Chlorella algae powder (2 mg per sponge once per week, as estimated according to Barthel &
Theede 1986). Physical parameters were monitored by HOBBO data loggers (temperature and light; continuous measure) and a multisensory (salinity, pH, oxygen; twice per week).
Moreover, water samples for flow cytometry were collected to estimate the concentration of bacterioplankton in the seawater at aquarium facilities and direct from the Kiel Bight outside of Geomar.
Sponge health was assessed by visual inspection and monitoring of sponge pumping activity.
Pumping activity was tested via the use of fluorescein dye before the experiments. The Fluorescein dye was solved in sterile artificial seawater (15 psu) and added to the water close to the osculum of the sponge. The water stream leaving the osculum was moving the dye front, what indicated active pumping and therefore physiological activity of the sponge (Fig. 4).
14 Six sponges were sampled right after arrival to the Institute, within hours after collection (=
wildtype condition) for phylogenetic analysis and optimization of protocols. Sampling was performed with sterile knives. Samples for gene expression analysis were fixed in RNAlater and stored at -80°C until they were processed. Samples for antimicrobial assays were directly frozen and stored at -80°C.
4.3. DNA and RNA extraction
RNA and DNA of the six wildtype sponges were extracted with the AllPrep DNA/RNA MiniKit (Qiagen). The protocol was optimized for Halichondria (tissue amount, times) (appendix 9.3.1). RNA extracts were treated with an Anti-RNase to protect the RNA from degrading and DNA-nuclease to remove possible DNA contamination. DNA contamination of RNA samples was excluded via PCR with Euk18S primer and agarose gels. Quality of the treatment was quantified with Experion chip (appendix 9.3.3). RNA concentration and quality was assessed with Nanodrop and Qubit. RNA extracts were stored at -80°C. DNA extractions were used for phylogenetic analysis, while RNA samples were used for optimization of RT-qPCR.
4.4. Phylogenetic analysis
A molecular phylogenetic analysis was performed on the two morphotypes of H. panicea. The phylogenetic analysis was performed in the six wildtype samples using four different markers:
COI mtDNA, 18S rRNA, 28S rRNA and ITS-2 genes. The primers used for PCR and sequencing are presented in Table 1. After PCR amplification, cleaned-up PCR products were sent for sequencing. Quality of sequences was estimated with Chromas software and primer sequences were removed. Sequences were blasted in NCBI.
Fig. 4: Fluorescein dye makes sponge pumping activity visible. Red arrow: Dye exits osculum.
15 Phylogenetic trees were designed based on COI mtDNA, 18S rRNA and ITS-2. The phylogenetic trees included the sequences that were generated in this study, other porifera from the NCBI database, cnidarian, ctenophores and Mus musculus, respectively Stichopus monotuberculatus as outgroup. The sequences were aligned with MAFFT or MUSCLE and reduced to the same length. A maximum likelihood tree was prepared in MEGA 6 with 1000 bootstrap.
Table 1: Phylogenetic markers and primers applied to PCR amplification and sequencing.
Gene Primer Primer sequence Reference
18S rRNA SP18aF 5'-CCTGCCAGTAGTCATATGCTT-3 Redmond et al. 2013
SP18gR 5'-CCTTGTTACGACTTTTACTTCCTC -3' Redmond et al. 2013
ITS-2 SP58bF 5’-AATCATCGAGTCTTTGAACG-3’ Thacker & Starnes
2003
SP28cR 5’-CTTTTCACCTTTCCCTCA-3’ Thacker & Starnes
2003 COI
mtDNA
dgLCO 5'-GGTCAACAAATCATAAAGATATTGAYATYGG-3' Meyer et al. 2005
COX1-R1 5'-TGTTGRGGGAAAAARGTTAAATT-3' Rot et al. 2006
28S rRNA Euk28S_26F 5’-ACCCGCYGAAYTTAAGCATA-3’ Stewart et al. 2010
Euk28S_3126R _T7
5’-
AATTATAATACGACTCACTATAGATTCTGRYTTAGAGGC GTTCAG-3’
Stewart et al. 2010
4.5. Experimental set-up for immune response experiment
Three treatments were applied for the immune response experiment by direct injection into the sponge mesohyl (50 µL): control (sterile filtered artificial seawater 15 psu), heat-killed Vibrio from the Mediterranean (VM) and heat-killed Vibrio from the Baltic Sea (VB). Vibrio spp. are abundant in the bacterioplankton communities of coastal waters and some species are pathogens of marine animals, including invertebrates such as sponges, cnidarians and corals (Thompson et al., 2004; Roth et al., 2012). These gram-negative bacteria were already used successfully for other immune challenging studies (Zaragoza et al. 2014; Trapani et al. 2016;
Bolte et al. 2013; Roth et al. 2009). The Vibrio from abroad is from the Mediterranean Sea in Italy kindly provided by Olivia Roth (FB3 EV, Geomar Helmholtz Centre for Ocean Research Kiel). The Vibrio from the Baltic Sea is Vibrio sp. PP-XX7 sampled 2010 in Strande/Baltic
16 Sea from muddy ground in 5 m depth. It was kindly provided by Jutta Wiese and Tanja Rahn (FB3 MI, Geomar Helmholtz Centre for Ocean Research Kiel).
Vibrio strain cultures were reactivated according to Bolte et al., 2013. Vibrio phylotypes were taken from a frozen glycerol stock (40% glycerol) and grown in medium 101 (5 g Peptone and 3 g meat extract per liter) adjusted for marine bacteria by addition of 1.5% NaCl and incubated at 25°C at 180 rpm overnight. Bacteria cultures were transferred into 1.5 ml Eppendorf tubes, heat deactivated at 65°C for 1h, centrifuged at medium speed (2000 rpm) and then the bacterial pellet was resuspended in artificial seawater (AquaMedic, 15psu, sterile filtered 0.22 μm).
The experiment took place in a flow-through system of 18 aquaria kindly provided by Olivia Roth (FB3 EV, Geomar Helmholtz Centre for Ocean Research Kiel). Water samples were taken from the aquaria before the experiments started, on both experimental days and directly from the Kiel Bight before and after the experiments to analyze bacterioplankton concentration in the seawater by flow cytometry. Samples were fixed with Paraformaldehyde and Glutaraldehyde (appendix 9.3.3) to a final concentration of 1% and stored directly at -80°C. Flow cytometry was performed at the flow cytometer FACScalibur (Becton &
Dickinson) of FB3 Research Unit “Marine Food Webs”, access kindly provided by Thomas Hansen. Samples were diluted (1/4) with artificial seawater (16 PSU). Heterotrophic bacteria in the water were stained with SYBRGreen solution (final concentration of 0.025%
(1:20.000)). The amount of bacteria was measured at flow rate 12 µL/min, threshold 2 min and green fluorescence (FL1). Bacterial cells were recorded in log-scale and were identified according to their size and fluorescence (settings: FL1 vs. SSC; FL1 threshold: 144, FSC: E02, SSC: 460). Data analysis was performed with Microsoft® Excel and FlowingSoftware 2.5.1.
For the first immune response experiment (IR), three sponges were divided in three clones and each clone was kept in an individual aquarium and assigned to one treatment. Thus, three replicates per treatment. They were kept in the aquaria for 4 weeks for acclimation. The clones of one sponge died a few days before the experiment started. Therefore, the replicates were reduced to two per treatment. No food was provided during the experiment. In addition the first immune response experiment (IR) was performed simultaneously in three Haliclona sp. with the conditions described above and a second immune response experiment (IR2) was performed with three replicates of H. panicea three months after the first experiment.
17 Sponge material was sampled 6h and 24h after the injection from two different areas (close and distant to the injection zone) to estimate the time of strongest immune response and investigate local or generalized immune response (Table 2). Sampling was performed with sterile knives. Sponge samples for gene expression analysis were fixed in RNAlater and stored at -80°C until they were processed. Sponge samples for antimicrobial assays were directly frozen and stored at -80°C.
Table 2: Experimental design
Sampling time point:
Challenge:
6h 24h
Sterile artificial seawater S (control) 6h S (control) 24h
Vibrio from Baltic Sea VB 6h VB 24h
Vibrio from Mediterranean Sea VM 6h VM 24h
4.6. Antimicrobial assay (AM)
Sponges’ immune reaction of the first immune response experiment (IR) was analyzed via an antimicrobial assay. The assay took place in the S2 laboratory of the FB3 EV group. The protocol of (Roth et al., 2012) was optimized for the sponge material. For implementing the protocol, two wildtype sponges without treatment were tested. Overnight culture of bacteria was transferred to a larger volume and kept in exponential growth for additional 2h. Then, optical density (OD) was measured at 600nm in a Spectrophotometer (Nanodrop). Vibrio from the Mediterranean was grown to an optical density of 0.032 and Vibrio from the Baltic Sea was grown until OD was 0.016. Then, 5mL of medium 101 overlay agar were infused with either 1mL of Vibrio from Italy or 1mL of Vibrio from the Baltic Sea and poured on plates.
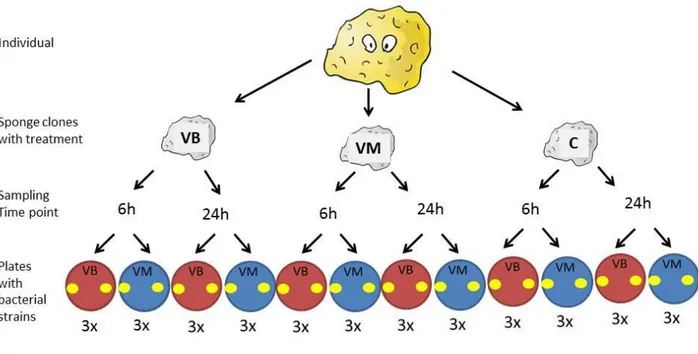
The optimization showed no difference between fresh and frozen sponge tissue, so frozen samples from the experiment were taken. Sponge pieces were placed on medium 101 overlay agar plates. Tetrazycline (1 mg/mL) was used as positive control. MilliQ water was used as a negative control. The experiment was performed in triplets with two pieces of the tissue on each plate, resulting in six technical replicates for each sponge clone and condition (Fig. 5).
18
Fig. 5: The procedure of the antimicrobial assay. The sponge was cut in clones and treatments were applied according to the IR experiment (see section Immune response experiment). Samples were taken on two time points. Each time point sample was places in duplicates on two different bacterial infused plates (VB & VM). All plates were prepared in triplets.
Plates were incubated at 25°C for 16–20h. Diameters of inhibition zones were measured to the nearest 0.1 mm. Plates were photographed with a DSLR camera. Data analysis was performed with RStudio. Halo size was estimated by subtracting the sponge piece diameter from the inhibition zone diameter. For statistical analysis Shapiro-Wilks-test for normality and Bartlett-test for equality of variances were applied. Significant differences were tested with Kruskal-Wallis-test and ANOVA (only complete and Haliclona dataset, not Halichondria dataset, because only two replicates were finally available). Both statistical test were applied because the Kruskal-Wallis-test is robust against non-normal distribution of data, but cannot consider individual error (e.g. it counts every replicate as individual), whereas the ANOVA considers the individual error but is less robust against non-normal distribution.
4.7. Candidate genes and primer design for RT-qPCR
The candidate genes for investigation of the immune reaction and the reference genes were chosen after study of recent literature (Boehm et al., 2000; Boehm et al., 2001; Wiens et al., 2005; Bolte et al., 2013; Redmond et al., 2013; Milutinovic et al., 2016; Rodrigueez-Lanetty et al. 2008) (Table 3). The cytoskeletal structure protein Actin and the glyceraldehyde 3- phosphate dehydrogenase (GAPDH), involved in glycolysis are often used as reference gene
19 in RT-qPCR analysis, also in studies in invertebrates (Bolte et al. 2013). Also, some authors have used 18S rRNA gene as reference gene (Li et al. 2014) . Members of the heat shock protein family are highly conserved and function as molecular chaperones by protecting the organism against thermal or other stress-induced damage (Borchiellini et al. 1998). They are also involved in intracellular protein transport and protein biogenesis (Shimpi et al. 2016) and in immune challenge response (Brown & Rodriguez-Lanetty 2015; Brown et al. 2013).
MyD88, JNK and p38 are interesting as components of the TLR signaling pathway and phenoloxidase and peroxiredoxin as effectors.
As no genome information is available for H. panicea, the primers were designed by using aligned sequences of other sponge species found in NCBI and focused on the most conserved areas. Sequences were aligned by MUSCLE in MEGA6. Degenerated primers were designed with IDT PrimerQuestTool for primer design and evaluated with IDT OligoAnalyzerTool and the TM calculator of Thermofisher. The designed primers were tested on cDNA of the six wildtype samples via touch down PCR and evaluated via agarose gels. After appearance of clear single bands, the PCR product was cleaned up with the DNA, RNA and protein purification Kit (Macherey and Nagel) and send to sequencing. Sequences were analyzed with Chromas for quality of sequence chromatogram and sequences were edited (e.g., removal of primer sequence) in BioEdit v7.2.5. Sequences were blasted against the NCBI database. From the long sequences of the investigated genes, shorter fragments (75-200bp) were designed, which were required for qPCR analysis. Optimal annealing temperature was estimated with gradient PCR. Fragments were sequenced again to guarantee the right target.
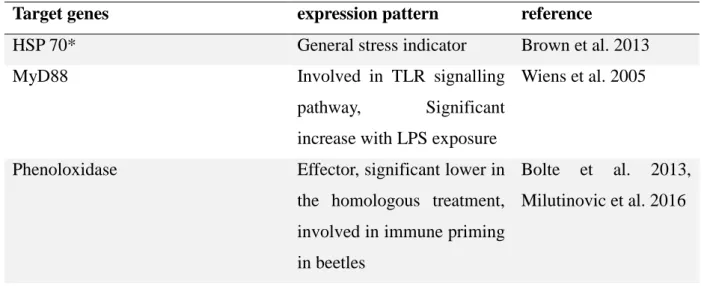
Table 3: Candidate genes (*= optimized genes)
Target genes expression pattern reference
HSP 70* General stress indicator Brown et al. 2013
MyD88 Involved in TLR signalling
pathway, Significant increase with LPS exposure
Wiens et al. 2005
Phenoloxidase Effector, significant lower in the homologous treatment, involved in immune priming in beetles
Bolte et al. 2013, Milutinovic et al. 2016
20
Peroxiredoxin Effector, Antioxidant,
induced by LPS
Bolte et al. 2013
JNK protein kinase Involved in TLR signalling pathway, activated by LPS exposure
Boehm et al. 2001
Protein kinase p38 Involved in TLR signalling pathway, activated by LPS exposure
Boehm et al. 2000
Reference genes
ß-actin* Reference gene Rodriguez-Lanetty et
al. 2008
GADPH Reference gene Bolte et al. 2013
18sRNA Reference gene Redmond et al. 2013
4.8. RT-qPCR optimization
As the results of the antimicrobial assay suggested higher immune reaction after 6h, I chose that time point for the gene expression analysis. RNA and DNA extractions of immune response experiment samples were performed for the 6h time point following the optimized protocol described above. One RNA sample of each experimental clone was reverse- transcribed into cDNA (appendix 9.3.2) and used as template for real-time quantitative PCR (RT-qPCR). Candidate and reference genes were optimized and RT-qPCR design was established to test gene expression level of the samples from the different treatments in H.
panicea. Primers for myeloid differentiation factor 8 (MyD88), involved in the signaling cascade of PRRs, and the reference gene GAPDH were designed for Haliclona sp., but the RT-qPCR assay could not be optimized yet.
RT-qPCR detects and measures the increase or decrease of expressed genes under different conditions. The detection of PCR products is provided by including a fluorescent molecule (her: SYBRgreen) that stains double-stranded DNA. The increase of double-stranded DNA amount is proportional with the increase of the fluorescent signal. Based on a set-up with a target gene (changes expression level under treatment) and a reference gene (does not change expression level under treatment) the results of the treatment can be evaluated. Verification of
21 absolute values and relative quantification is possible. In this study relative quantification was performed.
Important requirements for a comparable set-up are reliable reference genes and primers with similar amplification efficiencies (to guarantee comparability between target and reference genes). For an estimation of primer efficiency a standard curve of DNA samples of known (for absolute quantification) or unknown (for relative quantification) concentration can be performed. The standard curve should be performed in doubles. The replicate reactions should be consistent and the standard curve should be as linear as possible (R²>0.98). The amplification efficiency of the primers should be high (90–105%) and within a range of 5% to each other to perform convenient evaluation methods such as, 2-ΔΔCt (Livak) Method or the ΔCt Method using a Reference Gene. In this study the primer efficiencies differed from each other (see results). Therefore, the Pfaffl-Method was used.
Formula Pfaffl-Method
The above equation assumes that each gene (target and reference) has the same amplification efficiency in test samples and calibrator samples, but it is not necessary that the target and reference genes have the same amplification efficiency as each other (BIO-RAD Laboratories 2006).
The standard curve was performed from a dilution series of wildtype cDNA with 1/5 dilution.
The dilution was prepared in tRNA water (10ng/µl). tRNA is a small oligonucleotide that does not disturb the reaction but keeps the template in solution by flattening uneven tube walls.
This improves the homogenic solution of cDNA template in the tube.
The standard curve was performed in doubles for each gene with wildtypes. Each well of the 96-well plate contained SYBR-Green qPCR buffer (1x), forward and reverse primer (300 nml), 5µl template (cDNA) and molecular H2O. Protocols for RT-qPCR conditions were optimized for each gene. Reagents were ordered at ThermoFisher®Scientific. H2O was used as negative control.
22 4.9. RT-qPCR experiments
Differential gene expression analysis of hsp70 and actin was performed for H. panicea.
Two qPCR experiments (= two plates) were performed with reagents described above. The first plate contained H. panicea sponge samples from the first immune response experiment (IR), which were two biological replicates (clones) per treatment. The second plate contained H. panicea sponge samples from the second immune response experiment (IR2), which were three biological replicates (no clones) per treatment. Three technical replicates per treatment were placed on the plate. Target gene was hsp70 and reference gene was actin. Analysis of Ct ratio was performed with RStudio and Microsoft®Excel 2010 using the Pfaffl-Method. In IR2 the ΔCt of the calibrator (=control sample) was the mean of either HSP70 controls or actin controls to provide more homogeneity to the data, because the biological replicates were not clones in the IR2. For statistical analysis Shapiro-Wilks-test for normality, Bartlett-test for equality of variances and t.test (only complete and IR2 dataset, not IR dataset) were applied.
23
5. Results
5.1. Phylogenetic analysis
For my study, I received two different morphotypes of H. panicea in the Kiel Bight (Fig. 6).
One morphotype was yellow colored with a harder and more brittle tissue. Sponges of this morphotype grew very branchy and attached to the nylon. Most of them were associated with small tubeworms in brown fragile tubes. After three weeks in the aquarium, some of the yellow individuals started to drop pieces, which attached to the glass bottom of the aquarium.
The other morphotype was rose or red with a soft and elastic tissue. The individuals grew also branchy, but appeared to be more compact than the yellow ones. Throughout the experiment they were more covered with sediment than the yellow individuals. The phylogenetic relationship between the sponges was analyzed for three individuals of each morphotype based on four molecular markers: the COI mtDNA gene, the ribosomal 18S rRNA and 28s rRNA gene and the second internal transcribed spacer (ITS-2).
Fig. 6: A & C show the red morphotype of the sponge, B & D show the yellow morphotype of the sponge
24 The sequences (983-1200 bp long) of the COI mtDNA primers identified the yellow morphotype with 99% identity as Halichondria panicea (KC869423.1). The yellow morphotypes were 99.58-99.83% identical. The red morphotype sequences were 99.15-99.66%
identical and showed 98%-99% identity with Haliclona sp. (JN242210.1). In the phylogenetic tree based on COI mtDNA sequences the yellow morphotype clearly (bootstrap 100%) clusters together with H. panicea (KC869423.1). The red morphotype clusters together with Petrosia sp. (JN242220.1) (bootstrap 43%) in short distance to Haliclona sp. (LC126249.1).
The two morphotypes clearly cluster separately (Fig.7).
The sequences of 18S rRNA gene (793bp - 1169bp long) of the yellow morphotype showed 98%-99% identity with Halichondria panicea (KF699110.1). The 18s RNA gene sequences of the red morphotype showed 87% - 95% identity with Oceanapia sp. (DQ927317.1) and 90%- 95% identity with Haliclona sp. (EU095523.1). All three yellow morphotypes are 99%
identical and red morphotype sequences were 94-98% identical. Identity between yellow morphotypes and red morphotypes was 84-90%. The ML tree shows clearly that the two morphotypes do not cluster together (Fig.8). The yellow morphotype clusters together with H.
panicea sequences (KF699110.1) (bootstrap 98%), whereas the red morphotype clusters separated (bootstrap 91%) next to Oceanapia sp. (DQ927317.1), Xestospongia muta (AY621510.1) and Haliclona sp. (AY734444.1). Ctenophore sequences cluster within the sponge sequences. In contrast, the marker ITS-2 (520bp - 580bp long) revealed that all six wildtypes were closely-related to Halichondria sp. (AF062607.1) (99%-100% identity, AF062607.1) and clustered together with Halichondria panicea (AF062607.1) in the ML phylogenetic tree (Fig.9). 28S rRNA sequences (1049 - 1234 bp long) were only successfully amplified for the yellow morphotype. The sequences showed 98-99% identity with H.
panicea (AF062607.1, HQ379242.1).
25
Fig. 7: Maximum likelihood tree based on COI mtDNA sequences (Genebank ID appendix 9.2.5).
Fig. 8: Maximum Likelihood phylogenetic Tree based on 18S rRNA gene sequences (Genbank ID Appendix 9.2.5).
26
Fig. 9: Maximum Likelihood phylogenetic Tree based on ITS-2 gene sequences (Genbank ID Appendix 9.2.5).
5.2. Sponge aquaculture
Both sponge species were kept for several months in the flow-through system. Haliclona sp.
sponges were kept for 12 weeks before the color changed to a pale red. At this state, no pumping activity could be detected anymore and the sponge material finally dissolved in the water. H. panicea sponges were kept for 21 weeks in the aquaculture system. During the whole aquaculture period, H. panicea sponges were shrinking in size and dropping pieces.
These pieces actively attached to the glass bottom of the aquarium and started growing again.
Over the whole aquaculture period, two events occurred were four sponges of H. panicea started molding. Two of them grew in the aquaculture tanks and two of them grew in the experimental tanks (Fig. 10). The incidence occurred over night. The sponge body was covered in a grey biofilm and the inner sponge material was dark grey or black and smelled like rotten eggs. No molding was observed for Haliclona sp.
27
Fig 10: A and B show molding H. panicea sponges in the experimental tanks.
5.3. Immune response experiment
The conditions of water temperature, salinity, pH, oxygen in water and light were controlled throughout the whole experimental period of the immune response experiments. First experiment (IR) was performed in November 2016. The temperature was constant at 13°C.
After this first experiment, the experimental system was kept running and physical parameters were monitored weekly. Water temperature decreased according to seasonality over the aquaculture period from 13°C in November 2016 to 11°C in February 2017, when the second experiment (IR2) was performed. All other conditions remained constant (appendix 9.2.2, 9.2.3).
During the first experiment, the bacterial load was checked and compared to the bacterial load of the water in Kiel Bight (Fig. 11). The overall bacterial load stayed constant throughout the three days of experiment, ranging between 1.96 x 10⁶ to 1.60 x 10⁶ bacteria per mL seawater.
Values around 2x 10⁶ bacteria per mL seawater are normal for seawater from Kiel Bight (Rheinheimer 1996, pers. comm. Thomas Hansen; pers. comm. Carlo Berg). The bacterial composition differed slightly between Kiel Bight water (Fig. 11 probe 1 & 2) and aquarium water (Fig. 11 probe3-6).
28 5.4. Antimicrobial assay
The antimicrobial assay estimated the time point of strongest antimicrobial reaction for later correlation with and indications for bacteria-specific antimicrobial activity. The two Vibrio strains (from Baltic Sea and from Mediterranean Sea) grew in different densities on the 101-medium agar plates. Vibrio from the Baltic (VB) grew less dense than Vibrio from the Mediterranean (VM). The antimicrobial assay was performed against VB and VM plates for each experimental sample (control, exposed to VB, exposed to VM) collected at two time points (6h, 24h). On plates with Vibrio from the Mediterranean, all sponge samples including control showed an antibacterial reaction with clear halos around the sponge pieces. On plates with Vibrio from the Baltic, all sponges showed a biostatic reaction were bacteria were still visible in the halos but in lower density than the surrounding medium (Fig. 12).
Fig. 11: Flow cytometric analysis of surface seawater in Kiel Bight (probe 1-2) and in the experimental aquaria (probe 3-6) after staining with SybrGreen I. Acquired events are displayed in log mode. Each graphs represents green fluorescence (FL1-H) vs 90º light scatter (SSC-H). The gate shows the events that have been counted. Different bacterial subpopulations are distinguished.
29 The complete dataset contained halo size data for both species. It was used to compare the antimicrobial response of samples from each treatment (control, VM, VB) collected 6h vs 24h after treatment in aquaria. The complete dataset showed non-normal distribution (Shapiro- Wilks-test, control: p-value = 9.723e-06*; VM: p-value = 7.686e-05*; VB: p-value = 0.0009515*) but equal variances (Fligner-test (robust against non-normal distribution, non- parametric, p-value = 0.06097)). Each plate contained two technical replicates with one sponge piece on each side. There was no significant difference between them (t.test, p-value = 0.2886). Therefore both technical replicates were considered in the following tests.
Differences between the three treatments are significant at 6h time point, between control and Vibrio from the Mediterranean (ANOVA 6h, F-value = 5.084, p-value= 0.0376 *, ANOVA 24h, F-Value= 4.887, p-value = 0.17, Fig. 13). Treatments are not significantly different from each other at the 24h time point. A trend is visible with an overall stronger reaction towards the Vibrio from the Mediterranean and at the 6h time point. The standard deviation indicates a strong variation in the data set.
Fig. 12: A Vibrio from the Mediterranean plate with antimicrobial halo formation of H. panicea, B Vib- rio from the Baltic plate with biostatic halo formation of H. panicea, C Comparison of density growth of bacteria (left Vibrio from the Baltic, right Vibrio from the Mediterranean), both plates with Haliclona sp.
D Control plate without bacteria and with H. panicea (right) and Haliclona sp. (left).
30 I also analyzed the antimicrobial response of each sponge species separately. H. panicea dataset contained two biological replicates and Haliclona sp. dataset contained three biological replicates per treatment. Both datasets were non-normal distributed (Shapiro- Wilks-test, Halichondria: control: p-value = 0.001235*; VM: p-value = 0.1261; VB: p-value
= 0.02875*; Haliclona: control: p-value = 0.002024*; VM: p-value = 0.0001709*; VB: p- value = 0.009656*). The Halichondria dataset had equal variances (Bartlett test: p-value = 0.7075). The Haliclona dataset had unequal variances (Bartlett test: p-value= 0.0001403*;
Fligner test: p-value = 0.00115*). In both dataset there was no significant difference between the two sides of the plates. Both datasets showed strong variation on halosize, as indicated by the standard deviations. For statistical analysis results from both plate types were considered together to increase sample size.
Between the treatments of the Halichondria dataset a trend was visible towards a bigger halo size against the Vibrio from the Mediterranean, but there is strong variation in the control between 6h and 24h time point (Fig. 14). Two biological replicates were not enough samples for statistical analysis. The Haliclona dataset showed a significant difference at the 6h time point for the control to the Vibrio from the Mediterranean treatment and Vibrio from the Baltic treatment (Kruskal-Wallis 6h: p-value = 0.001073*; ANOVA 6h: p-value = 0.0448*; Fig. 14 B). The variation within the treatments especially in the control of the Halichondria dataset was very strong. The Haliclona dataset was overall more consistent within the treatments (Appendix 9.2.4).
Fig. 13: Results of Antimicrobial assay between treatments with complete data set (both species) considering sampling time points (6h in grey, 24h in black). Halo formation (mm) was higher at 6h time point. Difference was significant between the Mediterranean Vibrio strain and the control (ASW) (a).
(ANOVA 6h, p-value 0.0376 *) at 6h time point. p <.05, N=5.
31 5.5. RT-qPCR analysis
The target gene hsp70 and the reference gene actin were successfully optimized for RT-qPCR analysis. Primer efficiencies of actin and hsp70 were tested before running the experiment.
The results were E=97.7% for actin (R²=0.999) and E=97.1% for hsp70 (R²=0.998), what indicates a high primer efficiency. The primer efficiencies in the first immune response experiment (IR) with two biological replicates of H. panicea were 96.075% for actin (R²=
0.994) and 91.268% for hsp70 (R²= 0.99). The primer efficiencies of the second immune response experiment (IR2) with three biological replicates of H. panicea were 85.585% for actin (R²= 0.995) and 97,303% for hsp70 (R²= 0.997) (appendix 9.2.6).
The samples of H. panicea from both immune experiments (IR and IR2) were combined to get five biological replicates per treatment. The data within each treatment was test for normality with Shapiro-Wilks-test (shapiro: VB: p-value = 0.03742*, VM: p-value = 0.3028).
The QQ-Plot and the histogram indicate a non-normal distribution (Fig. 15). Under normality, the QQ-Plot is expected to be a linear curve with equal distribution of values and the histogram is expected to be a Gauß distribution. Homocedasticity was tested with Fligner-test (more robust against non-normal distribution). The Fligner-test was not significant (fligner: p- value = 0.07391), which indicates similar variances.
Fig.14: A Results of antimicrobial assay in samples from different treatments considering the two differ- ent sampling time points (6h in grey, 24h in black) in Halichondria panicea (A) and Haliclona sp (B). a = significant difference of control (6h) to VB (6h) and VM (6h). p <.05, N=2(A), N=3(B).
32 A trend is visible towards a stronger expression of hsp70 in the VM treatment, but the results were not significant (t.test: p-value = 0.1862, Fig. 16 A). Overall, the hsp70 expression level was higher in the IR2 experiment and also the difference between the treatments was higher, but the results were not significant (t.test p-value = 0.08188, Fig. 16 B). Both plots show high standard deviations. In four of five individuals the treatment with VM showed an increase in the hsp70 expression level compared to the reference gene actin, but the fold change values appear in a broad range (Pfaffl-method, ΔCt-values =1.29-32.72). A ratio of 1 indicates the same amount of expressed genes in the treatment as in the control. If considering the experiments separately, differences were only observed in the second experiment, whereas in the first one (IR) the ratios are very close to 1 (0.76-1.48).
Fig. 15: The QQ-Plot (left) and the histogram (right) of the RT-qPCR dataset show a non-normal distribution.
Fig. 16: Comparison of fold change ratio (by Pfaffl method) of the expression level of hsp70 between treatments VB and VM in the whole dataset (A) and between treatments VB and VM separated by ex- periments (B).p <.05, N=5 (A), N=2 (IR), N=3(IR2) (B).
33
6. Discussion
6.1. Phylogenetic analysis
Based on macroscopic morphological features, I characterized the sponge individuals as “yel- low morphotype” and “red morphotype”. Phylogeny based on morphological features is often not precise enough, as many morphological features are similar between species. Genetic markers are a helpful tool to add to morphological classifications. However, no single ideal marker to classify all sponges exists and even the universal barcode markers COI mtDNA, 18s rRNA, 28s rRNA or the ITS-2 region showed different resolution level depending on the sponges investigated. For instance, 18S rRNA showed varying success for phylogenetic anal- ysis in sponges, ranging from low phylogenetic signal (Szitenberg et al. 2013) to complete sponge classifications in Demospongiae (Redmond et al. 2013). Therefore, the combination of more than one molecular markers with morphological features is recommended (multilocus- based Sponge Identification Protocol (SIP) by Yang et al. (2017); Szitenberg et al. 2013).
The most reliable markers in my study were COI mtDNA and 18S rRNA, as they amplified sequences for both species in sufficient length and identified the two morphotypes as different species. 28S rRNA was reported as one of the most reliable molecular markers in sponge phy- logeny (Szitenberg et al. 2013; Yang et al. 2017), but could not be successfully amplified for the candidate Haliclona sp. in my study. ITS-2 showed the lowest value of identification as both morphotypes were identified as the same species H. panicea, what confirms former stud- ies claiming ITS-2 as insufficient marker especially for Halicona sp. (Yang et al. 2017;
Redmond 2009), but contradicts reports of successful separation of sponge species based on ITS-2 (Erwin et al. 2011). By combining different molecular markers, I was able to identify the yellow morphotype as Halichondria panicea (18S rRNA, 28S rRNA, COI mtDNA) and the red morphotype as Haliclona sp. (18S rRNA, COI mtDNA). A clear identification was crucial, because the two species situation affected the experimental process and the primer design.
6.2. Aquaculture
The aquaculture of H. panicea was successfully performed according to the suspension method of Barthel & Theede (1986) in a flow-through system with only minor losses by molding. Barthel & Theede (1986) also tested a second method where sponge pieces were attached between glass slides, but the method was concluded to be less successful for survival rate. This second method was not actively performed in this study, but broken sponge pieces
34 of H. panicea attached independently to the bottom of the aquaria and were metabolically active. Thus, both growing conditions (suspension and attached to glass) were successful for survival of H. panicea. The suspension method set-up used for H. panicea was also successful for cultivating Haliclona sp. To my knowledge, this study is the first study describing a cultivation method for Haliclona sp. in an aquarium. A cultivation method with sponge transplants in a field aquaculture was performed with moderate success (Rosmiati et al. 2007).
H. panicea survived for 5 months in aquaculture, what is one month more than described in Barthel & Theede (1986) as long-term survival (4 months), but shorter than reported cultivation of H. panicea for one year (Müller 2003). The Haliclona sp. could be successfully kept for 12 weeks. However, compared to H. panicea, the survival rate was lower and therefore Haliclona sp. suits more to short-term maintenance. Based on the cultivation success, H. panicea seems to be a suitable candidate for a potential model organism, as the cultivation method is: easy to carry out and inexpensive (when flow-through system available, e.g. at GEOMAR), provides good long-term survival and cultured individuals suit for physiological and ecological experiments in the laboratory (Barthel & Theede 1986). The flow-through system provides more natural conditions and is highly recommended.
Before the experiment started, two specimen of H. panicea were observed to be covered with a grey biofilm, in its appearance similar to a fungal infection. Origins of the infection can be multiple, such as a pathogen encounter in the aquarium, pre-infected sponge individuals from the field or opportunistic microbes inside the sponge that turned pathogenic under aquaculture conditions. Similar infection events of H. panicea in the field are not described in literature, what could relate the issue to the sponge aquaculture. Infections in aquarium maintenance were observed before for Ircinia sp. and Aplysina aerophoba (Lucía Pita Galán, pers.
comm.).The infection issue might be an interesting topic for further studies.
6.3. Immune response experiment
I hypothesized a differentiated immune reaction of the sponges towards the two different Vibrio strains and an increased immune response to the Vibrio strain from the Mediterranean (VM) (i.e. higher antimicrobial activity and differential gene expression), whereas the response to the Vibrio from the Baltic Sea (VB) stays similar to that in the control. The antimicrobial assay showed a stronger reaction to VM and a higher reaction at the 6h time point. The expression of the heat shock protein Hsp70 was analyzed with RT-qPCR in the
35 different treatments showing an upregulation of Hsp70 in VM treatment. Both analyses, the antimicrobial assay and the RT-qPCR, showed a differentiated reaction towards the Vibrio strains with a higher reaction to the VM, although the reaction was not consistent in all samples.
The antimicrobial activity of H. panicea and Haliclona sp. against both Vibrio strains indicates that the heat-killed Vibrio strains injected were taken as microbial challenge. Results suggested a trend towards a stronger reaction at the 6h time point in form of a wider halo formation. The time point corresponds with the study on immune priming in Mnemiopsis leidyi (Bolte et al. 2013). Other immunological studies in invertebrates confirm a high immune reaction within the first 24h hours (Pham et al. 2007; Sadd & Schmid-Hempel 2006;
Zhang et al. 2011). Sampling time points can only reflect a snapshot of the physiological, molecular and behavioral changes after microbial encounter. Therefore, they affect the results of gene expression studies and should be carefully chosen. A stronger reaction at 6h time point may correspond with a higher gene expression level. Therefore, the 6h time point samples suited best for me to plan the proceedings of the experiment (RNA and DNA extraction and qPCR optimization). However, more than one sampling time point can help to provide a baseline for expressed genes and a time series on the reaction, e.g. monitoring of wound healing in cnidarians (Stewart et al. 2017). Thus, samples of the 24h sampling time point were stored for further analysis (appendix 9.1.2).
The antimicrobial assay and the RT-qPCR showed both strong variations in the dataset and may be related to small amount of replicates (2-3 biological replicates in Halichondria experiments, three biological replicates in Haliclona dataset). The antimicrobial activity in the control of the Halichondria dataset was also variable and suggests a general antimicrobial activity of the sponge by e.g. frequently expressed secondary metabolites or by compounds released by either microbes growing on the sponge surface or sponge-associated microbes inside the sponge (Schneemann et al. 2010; Kelman et al. 2001; Helber 2016). For future experiments it is recommended to run the experiments with more replicates per treatment or, if this is not possible because of logistics, analyze more samples of the same biological replicate.
Primer design for RT-qPCR analysis in the absence of a sequenced genome turned out to be a difficult challenge. It was not possible to optimize primers that worked for both sponge