Policy Research Working Paper 7085
Does Land Fragmentation Increase the Cost of Cultivation?
Evidence from India
Klaus Deininger Daniel Monchuk Hari K Nagarajan
Sudhir K Singh
Development Research Group
Agriculture and Rural Development Team November 2014
WPS7085
Public Disclosure Authorized Public Disclosure Authorized Public Disclosure Authorized Public Disclosure Authorized
Produced by the Research Support Team
Abstract
The Policy Research Working Paper Series disseminates the findings of work in progress to encourage the exchange of ideas about development issues. An objective of the series is to get the findings out quickly, even if the presentations are less than fully polished. The papers carry the names of the authors and should be cited accordingly. The findings, interpretations, and conclusions expressed in this paper are entirely those of the authors. They do not necessarily represent the views of the International Bank for Reconstruction and Development/World Bank and its affiliated organizations, or those of the Executive Directors of the World Bank or the governments they represent.
Policy Research Working Paper 7085
This paper is a product of the Agriculture and Rural Development Team, Development Research Group. It is part of a larger effort by the World Bank to provide open access to its research and make a contribution to development policy discussions around the world. Policy Research Working Papers are also posted on the Web at http://econ.worldbank.org.
The authors may be contacted at kdeininger@worldbank.org.
Although a large literature discusses the productivity effects of land fragmentation, measurement and potential endogeneity issues are often overlooked. This paper uses several measures of fragmentation and controls for endo- geneity and crop choice by looking at inherited paddy and wheat plots to show that these issues matter empirically.
While crop choice can mitigate effects, fragmentation
as measured by the Simpson index increases produc-
tion cost and fosters substitution of labor for machinery,
especially for small and medium farmers. Greater dis-
tances between fragments have a smaller effect. Creating
opportunities for market-based consolidation could be
one step to limit fragmentation-induced cost increases.
Does Land Fragmentation Increase the Cost of Cultivation?
Evidence from India
Klaus Deininger, * 1 Daniel Monchuk, ** , Hari K Nagarajan, *** Sudhir K Singh *
* World Bank, Washington DC
** Cloudburst Consulting Group, Washington DC
*** Institute for Rural Management Anand, India
Key Words: Fragmentation, Inheritance, Cost, Production, Land, Endogeneity JEL : Q1, Q10, Q12, Q15
1 1818 H St. NW, Washington DC, 20433; Tel 202 4730430, fax 202 522 1151, email kdeininger@worldbank.org . We thank D. Ali, S. Jin,
Madhur Gautam and Hans Binswanger for very useful feedback and comments.
Does Land Fragmentation Increase the Cost of Cultivation?
Evidence from India 1. Introduction
Concerns about land fragmentation as a constraint to agricultural productivity have long been raised in the policy debate. Many studies find that, irrespective of the potential risk diversification benefits it may bring, having a cultivator’s land distributed among many small fragments, often at large distances from each other, increases production cost by requiring more time to move between fragments and set up equipment or by making use of machinery entirely impossible. Efforts to quantify associated effects face two challenges. First, the number of fragments (or average fragment size) and the distance between them are two distinctly different dimensions of land fragmentation that are not necessarily highly correlated and thus cannot be used interchangeably or as substitutes for each other. Second, producers may try to mitigate negative fragmentation-induced impacts via land market participation or crop choice. Failure to take such behavior into account may bias empirical results. Finally, the impact of fragmentation may not be homogenous across producers and differentiating impacts, for example across farm size classes, could be important to understand the underlying mechanisms.
This paper contributes to the literature by using a national level data set from India to estimate the impact of fragmentation on cost of production in ways that account for these challenges. By focusing on inherited land, an unbiased estimate of fragmentation on input costs is derived. We estimate a translog cost function and associated share equations with measures of fragmentation on the right hand side to recover the elasticity of total production cost and key factor shares with respect to fragmentation as distinct from total land area. To distinguish size- and distance-related effects of fragmentation, we use the Simpson index (as a measure of fragment numbers) as well as mean distances between fragments or fragments and the homestead. To eliminate the scope for endogenous adjustments to fragmented holding structures via land market participation or crop choice, we restrict the sample to households who cultivate only inherited fragments and, within these, conduct analysis only for fragments planted with paddy or wheat. Finally, to allow inferences on the channels through which production cost may be affected and account for the possibility of heterogeneity across farm size groups, we compute the elasticity of different inputs’ cost share with respect to fragmentation and estimate regressions by farm size class.
We find that the effects of fragmentation vary with farm size and that fragmentation-induced increases in the unit cost of production are largest for marginal farmers. A one standard deviation increase in the level of fragmentation as measured by the Simpson index is estimated to raise cost of production by 9.8% on
2
average. Distances between fragments seem less of a problem with an increase in distance of a similar magnitude contributing to a 0.67% increase in costs.
With ill-functioning land markets, farmers may try to offset adverse effects of fragmentation in several ways. Substitution between inputs, in particular replacing machinery and to a lesser extent seeds and chemicals with bullocks and labor, is found to be an important mechanism for doing so. Differentiating by farm size group also illustrates that addressing different dimensions of fragmentation separately is important: Increases in the number of fragments have limited effect on unit costs by large farms while the opposite is true for fragment-fragment distances. With a cost elasticity of total cost with respect to the Simpson index of 0.63 for small farmers, 0.41 for medium sized, and insignificant effects for large farmers, the cost associated with more fragmented holding structures falls disproportionately on the smallest farm size group. By comparison, estimated cost elasticities with respect to distances between fragments are, with 0.107 for large, 0.68 for medium and zero for small farms, more modest.
Our findings suggest that moves towards a more consolidated structure of operational holdings could disproportionately benefit small farms. But policies to address this phenomenon will be warranted only if they reinforce rather than run counter to market forces, cost less than the benefits they bring, and can be sustained over time. The restrictions on leasing and other forms of land transfer prevailing in most Indian states undermine producers’ ability to use market mechanisms to move closer towards their optimum holding structure. Eliminating the restrictions in ways that recognize the rights of tenants and landlords can potentially deliver high benefits. Unambiguous land records, together with mechanisms to keep them current over time, will be essential to underpin any market transactions. By comparison, one-off efforts to consolidate holdings are less attractive in terms of costs and sustainability and, if deemed to be needed, should be combined with elimination of restrictions on functioning of market and clarification records.
The paper is structured as follows. Section two reviews the literature to lay out the conceptual framework and measurement issues and introduce the econometric approach. Section three describes the data, provides descriptive statistics at holding and fragment level, and explores to what extent fragmentation is voluntary. Section four presents the results regarding cost functions and factor shares. Section five concludes by drawing out implications for policy in India and beyond.
2. Measurement, conceptual framework, and econometric approach
Drawing on existing studies, we argue that, because they may affect the cost of production quite differently, dimensions of fragmentation that relate to fragment size and distance between fragments should be considered separately from each other. This provides a basis for introducing the cost function
3
framework used to estimate the elasticity of cost as well as the cost share of specific inputs with respect to different measures of fragmentation.
2.1 Conceptual issues and measurement
With continued high levels of population growth and barriers that may prevent rural households from moving out of agriculture, increasing levels of fragmentation are often viewed as a key impediment to increased agricultural production. It has been argued that, historically, productivity losses from land fragmentation have been modest, benefits due to risk diversification substantial (Heston and Kumar 1983), and impacts of efforts at land consolidation undertaken by some states at various times during the post- independence period (Mearns 1999) short-lived as high population would soon let fragmented holding re- emerge after consolidation efforts. If there is net migration out of the agricultural sector, fragmentation can lead to serious constraints. And as cost of labor relative to machinery increases and plots become too small for mechanization (Foster and Rosenzweig 2010), the cost of fragmentation may further increase.
The literature suggests that fragmented land holding structures may be exogenously imposed by factors such as inheritance rules (Baker and Miceli 2005; Platteau and Baland 2001) or the modalities of parcel individualization in the transition from centrally planned economies (Tanaka 2007). Alternatively, they may be chosen by producers trading off costs against associated benefits. A key benefit of cultivating many different plots is considered to be producers’ ability to diversify their parcel portfolio to include plots with different attributes (altitude, moisture patterns, cropland, pastures, orchards, vineyards), reduce exposure to price or production risk in the form of flood, drought, or pests (McCloskey 1975), or smooth out seasonal variability in labor demands (Fenoaltea 1976). But having plots in dispersed locations also increases the time required to move between them (Bentley 1987). It may increase costs and reduce efficiency to the extent that small plots require more time to set up mechanical equipment and that, below a certain threshold, their size may preclude the use of machinery altogether.
The most widely used measure of fragmentation in the literature is the Simpson index, defined as SI=1- Σa
i2/ (Σ a
i)
2where a is the fragment size. This index will vary between 0 for a completely consolidated operation and 1 for a completely fragmented one. But focusing only on fragment size may lead to biased results; in fact if the above is correct, properly measuring the effects of fragmentation will require a measure of distance between fragments or fragments and the homestead.
Studies that include only the number of fragments cultivated or the Simpson index often find negative effects of fragmentation. In five Chinese provinces (Jilin, Shandong, Jiangxi, Sichuan, Guangdong), a production function for a sample of approximately 1,000 farmers with five key crops (maize, early and
4
late rice, wheat, and tubers) in 1994 suggests a significant negative impact: exogenous addition of one fragment is estimated to reduce output by 2 to 10 percentage points depending on the crop (Wan and Cheng 2001).
1In Bangladesh, a frontier production for 298 farm households with 4.4 fragments per holding in 2000 points towards negative productivity and efficiency effects from fragmentation (Rahman and Rahman 2008). A yield function on a small panel in North Vietnam for 200 farmers on very fragmented holdings (mean and median fragment numbers of 6.84 and 6 and Simpson index of 0.59 and 0.68, respectively) in 2000/1 similarly suggests that a greater number of plots reduces productivity (Hung et al. 2007). On the other hand, in a small sample (227 households) from Hubei province in China, the number of plots had no significant effect on crop production as measured by a production function.
Moreover, a program to reduce land fragmentation did not achieve its main goal, possibly because with relatively abundant labor, the scope to use any labor savings in other tasks was limited and low levels of technology implied significant fragmentation-related benefits in terms of risk-reduction (Wu et al. 2005).
2Measuring the costs of moving between plots explicitly suggests that distance is highly relevant in many contexts but also that it is often only weakly correlated with more traditional measures of fragmentation.
A cost function for 331 rice farmers on highly fragmented holdings (more than 7 plots on average with a Simpson index of 0.73 and a mean homestead-fragment distance of 16 min.) in three villages of Jiangxi Province in China suggests that the cost of production is little affected by the Simpson index, increases with mean homestead-fragment distance, and falls somewhat with farm size (Tan et al. 2008).
3A stochastic frontier production function using these data suggests that mean plot-homestead distance reduces technical efficiency whereas the number of plots and mean fragment size are associated with higher levels of technical efficiency (Tan et al. 2008).
In Africa, data for a small sample (150 and 80 households per region) from three regions in Ghana suggest little, if any, correlation between the level of fragmentation and mean plot-homestead distances.
4Moreover, yield equations provide little evidence of land fragmentation having adverse effects on land productivity (Blarel 1992). For example, while Rwanda was characterized by greater fragmentation (6 fragments and a median household-level Simpson index of 0.66), no significant relationship between yield and levels of fragmentation is found, with or without efforts to control for endogeneity. Also, while
1
The magnitude of these effects is used to argue that efforts to eliminate fragmentation, either by improving functioning of factor markets or by programs aimed specifically at land consolidation, would be worthwhile (Chen et al. 2009).
2
This mirrors evidence from Albania where fragmentation does not seem to negatively affect output and crop abandonment due to ill-functioning land market institutions, in particular the registry seems to be a more potent factor in reducing land use efficiency (Deininger et al. 2012).
3
The Simpson index was found to increases labor cost but reduces costs of fertilizer, seed, and oxen or tractors costs.
4
Two regions (Analoga and Wassa) are highly fragmented (median no. of 5 fragments and Simpson index of 0.77 and 0.66, respectively). On the other hand, fragmentation is very low in the third region (Ejura), with a median fragment number of one and a mean Simpson index of 0.23.
However, the correlation between average fragment distance and fragmentation in consistently low and average distance between homestead and fragments is greater in the latter than the former (3.5 km vs. 1.8 km).
5
pointing towards risk reduction as a potential reason for persistence of fragmentation, links between fragmentation and variability of output remained tentative at best (Blarel 1992).
A study of impacts of fragmentation on cost and variability for a 1995-2006 panel of 18,000 Japanese rice farms that cultivated a mean of 4 fragments with a Simpson index of 0.8 supports this: Fragment number and Simpson index increased average cost but reduced variance of output per hectare. In the case of Japan, high wages and well-functioning insurance markets implied that fragmentation costs outweighed the benefits but this may be different in other settings (Kawasaki 2010).
5The size of fragmentation- induced costs and benefits will thus depend on wage levels, the scope for mechanization, and availability of other options to reduce risk or insure against it. If labor costs are high and mechanization widely practiced, the costs imposed by small or highly fragmented plots can easily outweigh potential benefits. This could explain why returns of programs to consolidate holdings, often with land use planning, in developed countries are reported to have been high (Simons 1987).
From a methodological perspective, this implies that accounting for potential endogeneity of plot sizes will be important, though this has been difficult to achieve in practice (Blarel 1992). We address this is by limiting our sample to households who cultivate only inherited land.
6This still leaves the option that farmers adapt to their holdings’ level of fragmentation by choosing different types of crops. Access to data on input cost and output at the fragment level, together with the fact that virtually all farmers grow either rice or wheat, allows us to restricting the analysis to fragments with rice or wheat only to estimate the impact of a more fragmented holding structure at the farm level (i.e. including all fragments) in this context.
2.2 Analytical approach
To explore if fragmentation affects production cost, we follow the literature (Berndt and Christensen 1973; Binswanger 1974), measure fragmentation by the number of plots and the Simpson index, and estimate a trans-log cost function of the form
5
In Bulgaria, fragmentation (as measured by the Simpson index) was found to reduce farm profitability but to boost richness of species as measured by a biodiversity index (Di Falco et al. 2010 van Rensburg 2010).
6
While land transfers do occur, a large share (72 %) of those in our survey is between members of the same family (Foster and Rosenzweig 2010). If experience elsewhere is any guide, the productivity gains that can be achieved from such transactions are below those that could be realized from a more formal land rental market (Deininger and Jin 2008).
6
ln 𝐶𝐶(𝑦𝑦, 𝑤𝑤, 𝑧𝑧) =∝ 1 ln 𝑦𝑦 + 𝛼𝛼 11 1
2 (ln 𝑦𝑦) 2 + � 𝛽𝛽 𝑗𝑗 ln 𝑤𝑤 𝑗𝑗
𝑗𝑗
+ 1
2 � � 𝛽𝛽 𝑗𝑗𝑗𝑗 �ln 𝑤𝑤 𝑗𝑗 �(ln 𝑤𝑤 𝑗𝑗 )
𝑗𝑗 𝑗𝑗
+ � 𝛾𝛾 𝑙𝑙 ln 𝑧𝑧 𝑙𝑙
𝑙𝑙
+ 1
2 � � 𝛾𝛾 𝑙𝑙𝑙𝑙 (ln 𝑧𝑧 l )(ln 𝑧𝑧 𝑙𝑙 )
𝑙𝑙 𝑙𝑙
+ � 𝜏𝜏 𝑗𝑗 (ln 𝑦𝑦)�ln 𝑤𝑤 𝑗𝑗 �
𝑗𝑗
+ � 𝜙𝜙 𝑙𝑙 (ln y)(ln 𝑧𝑧 𝑙𝑙 )
𝑙𝑙
+ � � 𝜃𝜃 𝑗𝑗𝑙𝑙 �ln 𝑤𝑤 𝑗𝑗 �(ln 𝑧𝑧 𝑙𝑙 )
𝑙𝑙 𝑗𝑗
where C(.) is the total cost and of production associated with the household production of a particular crop on a fragment, y denotes output value, w
jis the per-unit price of input j, and z
lis a measure of fragmentation at the holding level. Based on Shephard’s Lemma, factor demands can be retrieved as the first partial derivative of the cost function with respect to input price 𝜕𝜕𝜕𝜕(.) 𝜕𝜕𝑤𝑤
𝑗𝑗
= 𝑥𝑥 𝑗𝑗 (𝑦𝑦, 𝑤𝑤, 𝑧𝑧). Partial derivatives of the (log) cost function with respect to (log) input price yield input shares, s
i. That is,
𝜕𝜕 ln 𝐶𝐶(. )
𝜕𝜕 ln 𝑤𝑤 𝑗𝑗 = 𝑠𝑠 𝑗𝑗 = 𝑥𝑥 𝑗𝑗 𝑤𝑤 𝑗𝑗
𝐶𝐶(. ) = 𝛽𝛽 𝑗𝑗 + 𝜏𝜏 𝑗𝑗 ln 𝑦𝑦 + � 𝛽𝛽 𝑗𝑗𝑗𝑗 ln 𝑤𝑤 𝑗𝑗
𝑗𝑗
+ � 𝜃𝜃 𝑗𝑗𝑙𝑙 ln 𝑧𝑧 𝑙𝑙
𝑙𝑙
In line with theory, the cost function and system of input demands need to satisfy a number of conditions.
For the cost function, homogeneity of degree one in input prices is satisfied by ∑ 𝛽𝛽 𝑗𝑗 𝑗𝑗 = 1, ∑ 𝜏𝜏 𝑗𝑗 𝑗𝑗 = 0, and
∑ 𝜃𝜃 𝑗𝑗 𝑗𝑗𝑙𝑙 = 0. Furthermore, homogeneity of degree zero in input prices for input demand is implied by
∑ 𝛽𝛽 𝑗𝑗 𝑗𝑗𝑙𝑙 = 0, and symmetry conditions satisfied by 𝛽𝛽 𝑗𝑗𝑙𝑙 = 𝛽𝛽 𝑙𝑙𝑗𝑗 . To obtain relevant parameter estimates, cost function and input shares are estimated simultaneously subject to these restrictions. While not very informative by themselves, these parameters allow us to derive relevant elasticities. In particular, for input shares, own price elasticity of demand for input j is given by 𝜂𝜂 𝑗𝑗𝑗𝑗 = 𝛽𝛽 𝑠𝑠
𝑗𝑗𝑗𝑗𝑗𝑗
+ 𝑠𝑠 𝑗𝑗 − 1 and the cross-price elasticity of input j with price of input k is given by 𝜂𝜂 𝑗𝑗𝑗𝑗 = 𝛽𝛽 𝑠𝑠
𝑗𝑗𝑗𝑗𝑗𝑗
+ 𝑠𝑠 𝑗𝑗 . The Allen own- and cross-factor elasticity of substitution can be computed as 𝜎𝜎 𝑗𝑗𝑗𝑗 = 𝑠𝑠 1
𝑗𝑗2
�𝛽𝛽 𝑗𝑗𝑗𝑗 + 𝑠𝑠 𝑗𝑗 2 − 𝑠𝑠 𝑗𝑗 � and 𝜎𝜎 𝑗𝑗𝑗𝑗 = 𝑠𝑠 𝛽𝛽
𝑗𝑗𝑗𝑗𝑗𝑗
𝑠𝑠
𝑗𝑗+ 1.
A key question from our perspective is how an exogenous level of land fragmentation will affect overall costs. To answer this, we compute the elasticity of total cost with respect to land fragmentation as
𝜕𝜕 ln 𝐶𝐶(. )
𝜕𝜕 ln 𝑧𝑧 𝑙𝑙 = 𝛾𝛾 𝑙𝑙 + � 𝛾𝛾 𝑙𝑙𝑙𝑙 ln 𝑧𝑧 𝑙𝑙 𝑙𝑙
+ 𝜙𝜙 𝑙𝑙 ln 𝑦𝑦 + � 𝜃𝜃 𝑗𝑗𝑙𝑙 ln 𝑤𝑤 𝑗𝑗 𝑗𝑗
Finally, it is of interest to know how the share of any particular input ( ∂ s
*j∂ z
j) will be affected by land fragmentation. This can be computed using the following relationship:
7
𝜕𝜕𝑠𝑠 𝑗𝑗
𝜕𝜕𝑧𝑧 𝑙𝑙 = 1 𝑧𝑧 𝑙𝑙 𝜃𝜃 𝑗𝑗𝑙𝑙 which can also be represented as elasticity
𝜌𝜌 𝑗𝑗𝑙𝑙 = 𝑧𝑧 𝑙𝑙 𝑠𝑠 𝑗𝑗
𝜕𝜕𝑠𝑠 𝑗𝑗
𝜕𝜕𝑧𝑧 𝑙𝑙 = 1 𝑠𝑠 𝑗𝑗 𝜃𝜃 𝑗𝑗𝑙𝑙
We can use this framework to identify how fragmentation will affect the total unit cost of production, test if specific fragmentation measures will affect the total cost of production differently, and explore if higher levels of fragmentation increase all cost items equally or alter the relative cost structure.
7Moreover, while inclusion of total farm size or cultivated area allows us to retrieve the aggregate elasticity of cost with respect to farm size, we can estimate the cost function for individual farm size groups and thus test if fragmentation differentially affects small, medium, and large farmers’ total cost or cost structure.
3. Data and descriptive evidence
Detailed fragment-level data on agricultural production from 17 Indian states that cover a wide range of conditions in terms of production structure and levels of fragmentation allow us to estimate impacts of fragmentation on production cost for inherited fragments only. The data illustrate that fragment or farm size, the Simpson index, and mean fragment-fragment or homestead distances are different measures that are only weakly correlated.
3.1 Data and variable construction
To explore impacts of fragmentation on cost of production, we use the Rural Economic and Demographic Survey (REDS) conducted by India’s National Council for Applied Economic Research (NCAER) in 2007/8 on a sample of 240 villages in 17 states with production information on 4,790 farm households who cultivate a total of 17,821 parcels. Beyond its national coverage and detail on parcel and household characteristics, this survey, which forms part of a long-running panel, has three desirable features.
First, the interview included a sketch depicting all parcels cultivated by a household, cross-checked with official cadastral maps maintained by the village administration. This allowed elaboration and cross- checking of a matrix that identified distances and travel times between each fragment and all the other ones cultivated by a household
8as well as the cultivator’s homestead which we use to compute a measure of proximity and the travel time between fragments and/or fragments and the homestead.
7
As prices are controlled for, such changes will mean that certain inputs are used more intensively than others.
8
As no GPS measurements were available, it is impossible to use a digital elevation model to cross-check self-reported distances and travel times as done elsewhere (Ali and Deininger 2014). As most of our sample is located in flat high-potential irrigable terrain, this may be less relevant.
8
Second, we have information on each parcel’s mode of acquisition (inherited, purchased, or leased). As land markets are very inactive, the majority (3,814) of households cultivate only land they inherited. In addition to estimating relevant equations for the entire sample, we can thus restrict our sample to include only these households for whom levels of fragmentation are exogenous and not affected by household decisions, to avoid concerns about endogeneity.
Finally, we have detailed information on inputs, including hired and family labor and machinery as well as outputs by parcel in each season. Amounts of own and hired male, female, and child labor are reported by activity, i.e. for land preparation, sowing/transplanting, weeding, fertilizer application, pest control, irrigation, harvesting separately. We value them using wage rates from the village survey. Cost of own or hired machinery and bullocks is computed using the village level rental rate. Home produced seed is valued using market or village-level prices. Irrigation charges include water and non-labor operating cost i.e. electricity and fuel for canal or bore wells. Total output value is calculated by aggregating the value across the parcels and crops for each household.
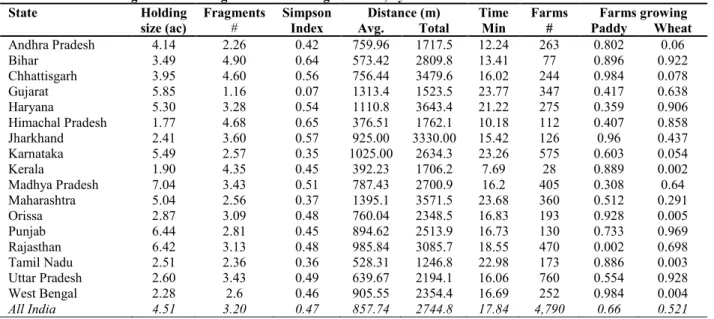
Table 1 illustrates that average holding size in the sample is 4.5 acres in 3.2 parcels (1.7 ac./parcel), with a Simpson index of 0.47 and an average parcel-parcel distance of 858 m that takes some 18 min to traverse.
These measures vary across states but are only weakly correlated with each other. For example, relatively large holdings are not necessarily more fragmented, as indicated by the example of Gujarat where holding size is about 6 ac. but, with an average of 1.16 parcels and a Simpson index of 0.07, fragmentation is low.
With 1.3 km on average, mean parcel-homestead distances are nevertheless quite large. By comparison, Himachal Pradesh has a holding size of 1.77 ac. in 4.7 parcels, a Simpson of 0.65 or Bihar with a holding size of 3.49 in 4.9 parcels and a Simpson of 0.64. The total distance to be covered between plots and home can be quite different; with 1.76 km it is rather low in Himachal but high in Bihar (2.81 km) or Maharashtra (3.57 km). The number of parcels is lowest in Gujarat and Andhra Pradesh (1.16 and 2.28) and highest in Bihar and Himachal Pradesh (4.90 and 4,68) and mean distance to be covered is lowest in Kerala and Himachal Pradesh (392 and 377m) and highest in Maharashtra and Gujarat (1,395 and 1,314 m). We also note that two-thirds of farmers grow paddy and more than half grow wheat with only 10.3%
of farmers, mainly in Kerala and Tamil Nadu, growing neither of these.
3.2 Household characteristics and agricultural production
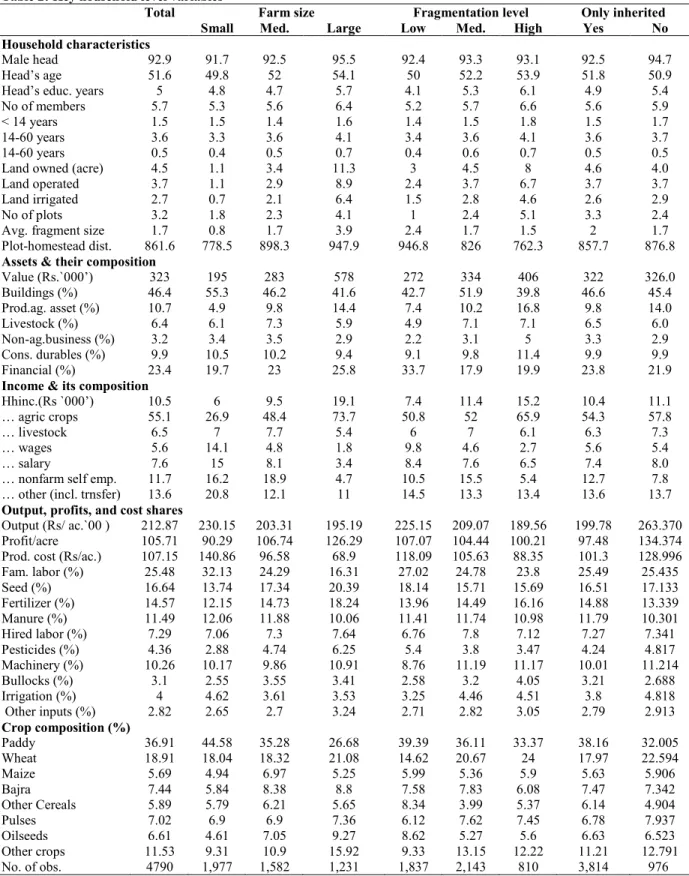
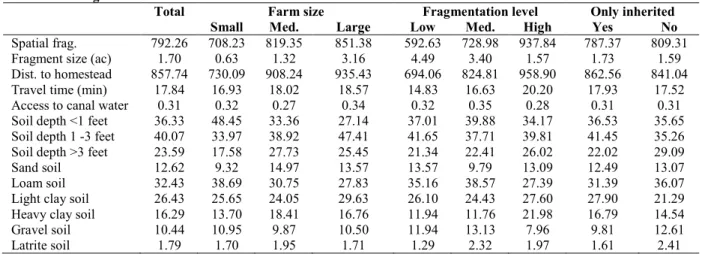
Key statistics on household characteristics and agricultural production in table 2 are reported for the entire sample, by farm size group, level of fragmentation, and by mode of land acquisition.
9With 5.7 members
9
Small, medium, and large farms are defined as less than 2 acres, 2 to 5 acres and greater than 5 acres, comprising 41%, 33%, and 26% of the sample, respectively. Low, medium, and high levels of fragmentation are defined as having less than 2, between 2 and 5 and more than 5 parcels, with 38%, 45%, and 17% of farms falling into the relevant categories. While only 4,286 farms have information on the mode of acquisition for all
9
on average, 93% of sample households are male-headed, with a head 52 years old. Most land (71%) is under irrigation and the mean value of non-land assets is Rs 323,000, equivalent to some USD 7,100 at the exchange rate prevailing then. Key categories of non-land assets are buildings (46%), financial assets (23%), agricultural implements and producer durables (11% and 10%, respectively), and livestock as well as non-agricultural business for the remainder. Mean total household income is Rs. 105,862, equal to US$
2,341, equivalent to per capita income of US$ 410. Major income sources are crops (55%), transfers (14%), non-farm self-employment (12%), salary and wages (13%), and livestock (7%).
A number of further observations are noteworthy. With a Gini for per capita assets of 0.650 and for income of 0.579, inequality remains high. Small farmers’ income is very low, not because their income sources are insufficiently diversified or they are unproductive but because their land endowment is small.
The share of income from crops is highly (ρ=0.7269) and significantly correlated with farm size; crop income comprises only about one-fourth (27%) of the total for small farmers compared to about three- fourths (74%) for large ones. Legal prohibitions on land leasing together with outdated land ownership records in most states also imply that land markets are very inactive: the Gini for owned land (0.543) is almost equal to that for operated land (0.537). Finally, the correlation between levels of fragmentation and mean distances between parcels is weak (ρ=0.0725) and insignificant.
With total output per household at Rs. 21,240 (US$ 469.83), about half of which goes to variable inputs including labor, net profit amounts to some Rs. 10,500/ac. At a cost share of about one-third, labor is a main cost component, followed by seed (17%), inorganic and organic fertilizers (15 and 11%), machinery (10%), and minor categories such as pesticides (4%), irrigation (4%), bullocks (3%) and miscellaneous others (3%). With 37% of area planted, paddy is the main crop, followed by wheat (19%), bajra, pulses, and oilseeds (7% each), other cereals (6%), and any others such as fruits and vegetables (12%).
Productivity, in terms of output per acre decreases with farm size from Rs. 23,000 for small to Rs. 19,500 for large farms. This is in line with the inverse relationship between output and farm size long observed by Indian scholars. But if family labor is valued at market wages, a positive relationship emerges between farm size and profits per acre (Rs. 9.029; 10,674, and 12,629) suggesting that labor market imperfections could underlie some of the observed relationship, similar to what is observed in Rwanda (Ali and Deininger 2013).
10Cost shares for key inputs differ by farm size: while all size groups devote some 7% of cost to hired labor, small farms’ spending on labor is about double that of large farms (32% vs. 16%), suggesting more labor-intensive ways of cultivation. At the same time, large farms spend 45% of the total on seed, fertilizer,
of the parcels they cultivate, the majority of the remainder (3,814 farms or 80% of the entire sample) and values for most of the variables are not significantly different from those for the total sample.
10
Note that gross margins, i.e. output net of variable inputs excluding labor is, with Rs. 13,527, 12,997, and 13,802, almost identical across the three farm size groups.
10
and pesticides vs. 29% for small farms. Output composition also varies by farm size: while small farmers devote 45% of their land to paddy, this figure is only 27% for large farmers who instead have higher shares of wheat (21 vs. 18%) oilseeds (9.3 vs. 4.1%), bajra, (8.8 vs. 5.8%), pulses (7.4 vs. 6.9%), and other crops (15,9 vs. 9.3). The last column of table 2 illustrates that, while households who also lease or purchased land in the past are slightly larger and more focused on agriculture than those who cultivate only inherited land, differences are small.
114. Econometric results
We find that an increase in fragmentation as measured by the Simpson index has more significant impact on cost of production than greater distances between them. Beyond increasing total cost, fragmentation affects the input mix: more fragmented holdings substitute labor for machinery, possibly because fragment sizes are too small to permit mechanization. Impacts are not uniform across the farm size distribution and small farms’ level and structure of costs is more affected by spatial fragmentation than that of large farms, consistent with threshold effects that may be linked to mechanization potential.
4.1 Results for the entire sample
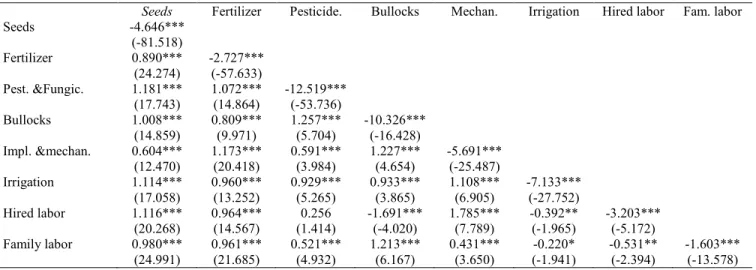
Table 3 illustrates that all own price elasticities are negative and strongly significant and that most cross- price elasticities suggest complementary relationships between the relevant inputs, with the exception of hired and family labor as well as bullocks and to certain extent irrigation.
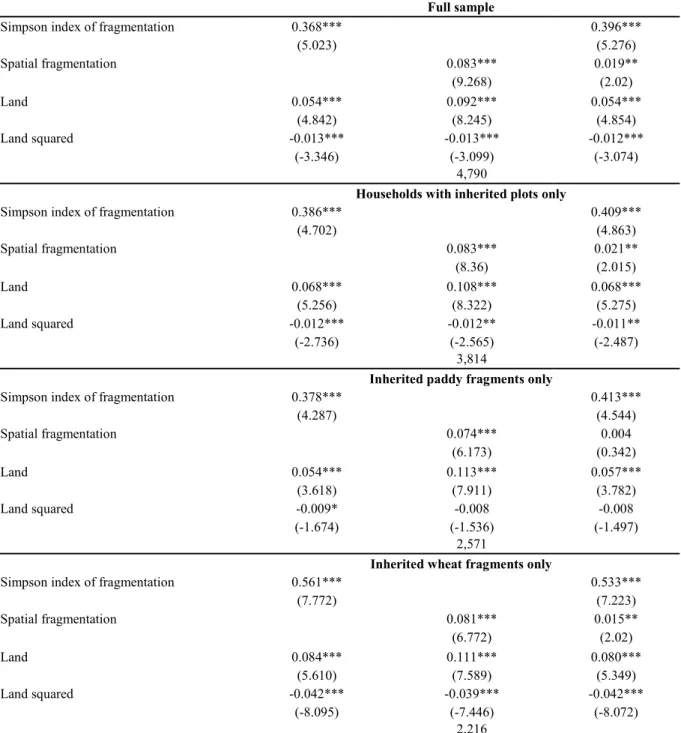
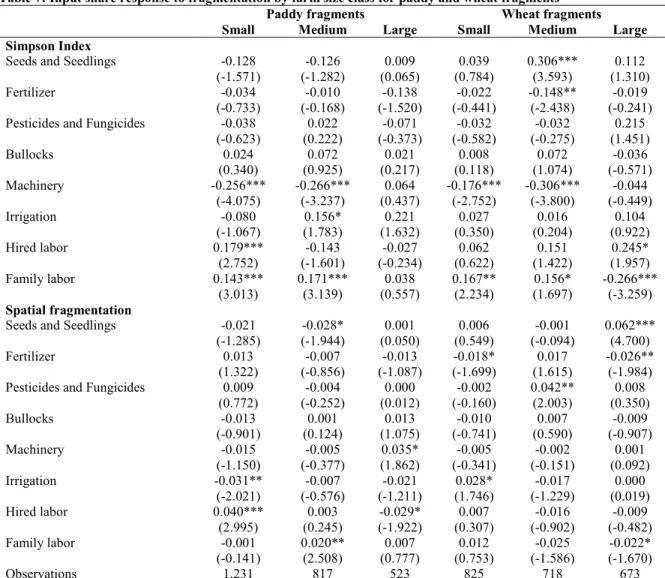
Inclusion of measures of fragmentation on the right hand side of the cost function allows us to compute elasticities of cost with respect to our fragmentation measures. Table 4 reports results from specifications for the full sample, those with inherited land only, and, for the latter, only paddy and wheat fragments.
While coefficients are quite consistent across different samples, we find that fragmentation-induced increases in costs are larger for wheat than other crops and that the impact of spatial fragmentation is consistently lower than that of the Simpson index; in fact if latter is controlled for, the coefficient is insignificantly different from zero for rice. To illustrate magnitudes involved, note that a one standard deviation change in the Simpson and the fragment-fragment distance would be predicted to change costs for the overall sample by 9.8 and0.67 percentage points, respectively.
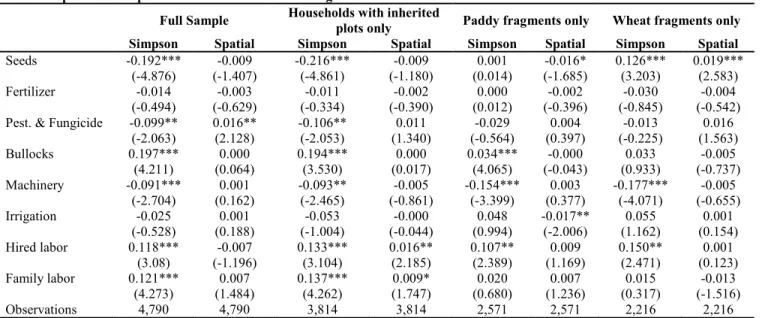
12Computing inputs’ marginal elasticity with respect to fragmentation (table 5) suggests that in addition to affecting total unit cost, fragmentation affects producers’ cost structure: for the overall sample, a higher Simpson index is predicted to significantly increase the cost share of labor (family and hired) and
11
While we report estimation results for farms who inherited land only, all estimations are also conducted for the entire sample. Results, which are not substantively different from those reported here, are available on request.
12