OFFSHORE GRID:
CONNECTING ELECTRICITY MARKETS
THROUGH OFFSHORE WIND FARMS
Towards a Baltic Offshore Grid:
connecting electricity markets through offshore wind farms
PreFeasibility Studies report for Polish-Swedish-Lithuanian
and German-Swedish-Danish interconnectors integrated with offshore wind farms Edited by:
Mariusz Wójcik
Authors (in alphabetical order):
Nerijus Blazauskas Rasmus Borrmann Elizabeth Côté Łukasz Gajewski Clemens Gerbaulet Anna-Kathrin Wallasch Natalia Kaczmarek Thilo Krupp Marija Lazić Joanna Makowska Anna Marczak Bénédicte Martin Andreas Möser Joanna Pardus
Joanna Przedrzymirska Maciej Stryjecki Jörgen Svensson Łukasz Szydłowski Magda Trzaska Richard Weinhold Mariusz Wójcik
Graphic design:
Magdalena Batko
Copyright:
Reproduction of this publication in whole or in part must include the customary biblio- graphic citation, including author attribution, report title, etc.
Cover photo:
Detlef Gehring, Eon-Netz Published by:
Baltic InteGrid Disclaimer:
This report is part of a project that has received funding form the European Union’s Interreg Baltic Sea Region. The report reflects the author’s view and the EU is not liable for any use made of the information therein.
www.baltic-integrid.eu
Content
1. EXECUTIVE SUMMARY 3
2. INTRODUCTION 11
2.1. Goal and structure of the PreFeasibility Studies 11
2.2. Description of the Case studies 11
2.3. About the Baltic InteGrid project 12
3. BACKGROUND 15
3.1. European context 15
3.1.1. Policy and regulation 15
3.1.2. Internal Energy market 16
3.1.3. Maritime spatial planning 19
3.1.4. Supply chain 20
3.1.5. Environment 22
3.2. Country context 25
3.2.1. Denmark 25
3.2.2. Germany 27
3.2.3. Lithuania 29
3.2.4. Poland 31
3.2.5. Sweden 33
4. METHODOLOGY 35
4.1. Assumptions 35
4.2. Step 1: Analysis of existing and planned OWF projects and infrastructure 35
4.3. Step 2: Scenario development 36
4.3.1. Level of integration 37
4.3.2. OWF development 37
4.4. Step 3: Technical design 38
4.5. Step 4: Spatial analysis 39
4.6. Step 5: Environmental analysis 40
2
5. CASE STUDY 1 – POLAND-SWEDEN-LITHUANIA 43
5.1. Case study description 43
5.1.1. Geographic area with interfaces 43
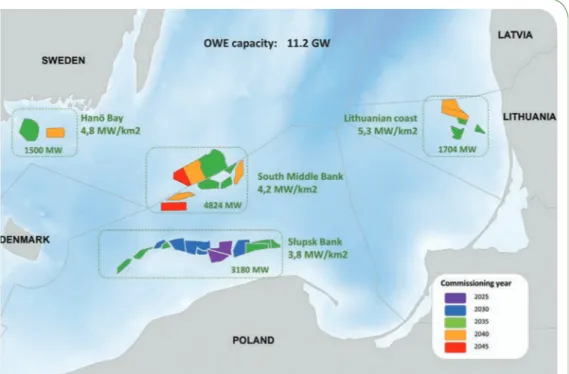
5.1.2. High and Low OWP development, including power densities 43
5.1.3. Onshore connection points 45
5.2. Scenario presentation 46
5.2.1. Scenario 1a – Zero integration Scenario – High OWP development 46 5.2.2. Scenario 1b – Zero integration – Low OWP development 48 5.2.3. Scenario 2a – Partial integration – High OWP development 50 5.2.4. Scenario 2b – Partial integration – Low OWP development 52 5.2.5. Scenario 3a – Maximum integration – High OWP development 54 5.2.6. Scenario 3b – Maximum integration – Low OWP development 56
5.3. Conclusions 58
5.3.1. Comparison of Scenarios 58
5.3.2. Technical design 58
5.3.3. Spatial analysis 60
5.3.4. Environmental analysis 61
5.3.5. Cost-Benefit analysis 62
6. CASE STUDY 2 – GERMANY-SWEDEN-DENMARK 67
6.1. Case study 2 description 67
6.1.1. Geographic area with interfaces 67
6.1.2. High and Low OWP development including power densities 68
6.2. Scenario presentation 72
6.2.1. Scenario 1a – Zero integration Scenario – High OWP development 72 6.2.2. Scenario 1b – Zero integration – Low OWP development 74 6.2.3. Scenario 2a – Partial integration – High OWP development 76 6.2.4. Scenario 2b – Partial integration – Low OWP development 78 6.2.5. Scenario 3a – Maximum integration – High OWP development 80 6.2.6. Scenario 3b – Maximum integration – LOW OWP development 82
6.3. Conclusions 84
6.3.1. Comparison of Scenarios 84
6.3.2. Technical design 84
6.3.3. Spatial analysis 85
6.3.4. Environmental analysis 86
6.3.5. Cost-Benefit analysis 87
REFERENCES 91
ABBREVIATIONS 99
1. Executive Summary
This report was developed within the Baltic InteGrid project (www.baltic-integrid.eu) co-financed through the INTERREG Programme for the Baltic Sea Region in the financial perspective 2014-2020.
It summarises the results of extensive PreFeasibility Studies performed for 2 cases:
• The Case Study 1 assumes an electrical connection between Poland, Sweden and Lithuania integrated with planned offshore wind farms in these countries. Choice for such setup was dic- tated by several conditions:
• significant number of OWF projects planned in the Polish Exclusive Economic Zone (EEZ),
• some OWF projects, both in Polish and Swedish waters are planned just at the Polish-Swe- dish border, at the South Middle Bank,
• potential connection to Lithuania was indicated by the Polish Transmission System Operator (TSO) in connection to the potential synchronisation of the Baltics,
• there is an existing Polish-Swedish interconnector, SwePol Link, (established infrastructural corridor),
• there is also an existing Swedish-Lithuanian interconnector, Nordbalt, (established infra- structural corridor).
• The Case Study 2 assumes a connection between Sweden, Germany, and – for the High Offshore Wind Power (High OWP) build-out scenarios – Denmark. Reasons behind such choice were the following:
• significant number of OWF projects have been realized and are planned in the German Baltic Sea (territorial waters and EEZ),
• both Swedish and Danish OWF projects close to the German border are under consideration by several developers,
• the Swedish and German TSOs, Svenska Kraftnät (SvK) and 50Hertz, are realizing an inter- connector, called Hansa PowerBridge (planned commissioning 2025 or 2026). Furthermore, an additional interconnector between Sweden and Germany might have significant market potential and is according to the TYNDP already under consideration by the corresponding TSOs (Hanse PowerBridge II).
The analytical work conducted for the study included the following steps:
• Analysis of existing and planned OWF projects and infrastructure,
• Scenario development (6 scenarios per case study),
• Technical design,
Towards a Baltic Offshore Grid: connecting electricity markets through offshore wind farms
4
• Spatial analysis,
• Environmental analysis,
• Cost-benefit analysis (CBA) – based on the ENTSO-E CBA methodology.
General conclusions:
• In general, the integration of wind farms and interconnectors with a high level of offshore wind deployment in a given area brings more benefits than costs. With low wind deployment the results are not unambiguous.
• The CBA for an integrated solution has to be performed on a case-by-case basis and is very much dependent on the level of offshore wind deployment in the analysed area and the level of integration. This applies especially to complex setups where protection systems, such as HVDC breakers, are required.
• In the case studies the system complexity increases from zero integration, over partial, to ma- ximum integration. A higher transmission capacity and integration might bring higher flexibility in terms of avoiding OWP curtailment and higher maximum cross-border energy trade. Further- more, a higher level of interconnection might open up new possibilities, like selling the generated electricity towards both markets and price zones. However, it requires a stronger cooperation between all involved parties and a longer development phase for the needed components, sys- tems, codes and operations, not to mention the stakeholder co-operation.
• In the integrated scenarios one challenge is to deal with more sophisticated and costly security measures (DC breakers). Furthermore, the lack of commercial implementations significantly incre ases the uncertainty and thus costs for the highly-integrated solutions.
• The adequacy analysis for both cases proved that in all scenarios the system has enough capa- city available, but higher integration provides the system with more flexibility with regard to the adequacy rate. The conclusions are true for all countries included in the case studies.
• In integrated systems (or the part of the system that is integrated) the DC cables have higher utilisation rates, since the capacity of the cable not used for exporting electricity from wind farms can be used for Cross-Border Energy Trade (CBET). However, the scenario of near-maxi- mum infrastructure utilisation rate would require that one of the interconnected countries would always have a sufficiently high power demand and electricity price in relation to the other inter- connected country(s).
• Spatial analysis shows that the number of landfalls may become a limiting factor for offshore wind development in some of the case study areas. Depending on the case study, the zero inte- gration (radial connection of OWFs) scenarios assumes 6 times more landfall cables then in the corresponding maximum integration case. The potential conflicts may include onshore environ- mental protection areas but also dispersed and sometimes congested settlements and tourist activity in the seaside.
Case-specific conclusions:
• Case Study 1 – there is an immense potential for introducing a grid solution integrated with OWFs for Poland, Sweden and Lithuania both for High and Low Offshore Wind Power (High/ Low OWP) scenarios.
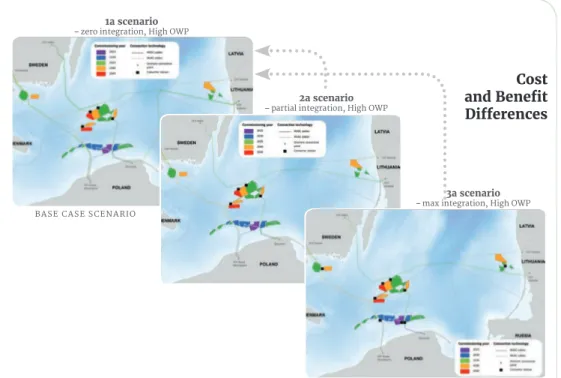
• For the High OWP build-out (assuming 11,2 GW for the whole study area) the partial inte- gration scenario (Scenario 2a) is the most favourable. The design logic of this scenario is to connect OWFs close to shore (Slupsk Bank, Lithuanian and Swedish projects near the coast) radially with AC technology, and the wind farms far offshore (South Middle Bank on the Polish and Swedish side) would be integrated with the HVDC interconnectors.
This type of design would need a fair level of cooperation for all projects and stakeholders There is an immense
potential for introducing a grid solution integrated with OWFs for Poland, Sweden and Lithuania Executive Summary
using the VSC-HVDC system. In return, the solution could provide higher flexibility, utilisation rates and cost sharing opportunities. The grid costs are lowest for the partial integration scenario – 2.96 billion EUR. The costs for the zero integration and the maximum integration scenarios are: 3.27 billion EUR and 3.50 billion EUR respectively. Based on CBA analysis, compared to the base-case scenario (zero integration), the partial integration brings addi- tional benefits of 0,36 billion EUR.
Figure 1
Case Study 1 Area
Figure 2
Case Study 1 – Scenario of High OWP/partial integra- tion – schematic build-out
Towards a Baltic Offshore Grid: connecting electricity markets through offshore wind farms
6
The partial integration scenario could depict the development of OWE in Poland and Sweden, where the most developed projects in Poland are planned to be connected radially. However, projects farther from shore, at Southern Middle Bank (both in Swedish and Polish waters), will be developed most likely after 2030 and could be connected in a more coordinated approach.
• For the Low OWP build-out (assuming 5,7 GW in the whole study area) the maximum inte- gration scenario (Scenario 3b) is the most favourable. The key characteristic of this scenario can be summarised as high cooperation and planning requirement, technically challenging, flexible power flow routing, possibility for high utilisation rates, shorter total cable lengths and possibility to share costs. The grid costs are lowest for zero integration scenario – 1.40 billion EUR. The costs for the partial integration and the maximum integration scenarios are:
1.50 billion EUR and 1.47 billion EUR respectively. Even though the costs for the maximum inte gration scenario are higher, the benefits surpass the costs and compared to the base- case scenario (zero integration), the additional benefits amount to 0.91 billion EUR.
Analysis shows, that the grid solution integrated with OWFs is favourable provided that a critical mass of wind power is installed and integrated into the grid
Executive Summary
0,65 0,40 0,58
0,26
0,16
0,36 0,35
0,39
1,44 1,22
1,22 0,02 0,35
0,02 0,77 0,00
0,77
0,77
0,00 0,50 1,00 1,50 2,00 2,50 3,00 3,50 4,00
CS1_1a
Zero Integration CS1_2a
Partial Integration CS1_3a Max Integration bn €
0,34 0,47
0,32 0,14
0,11
0,19 0,09
0,09 0,51 0,54
0,51 0,01 0,11
0,01 0,00
0,31
0,31 0,31
0,00 0,20 0,40 0,60 0,80 1,00 1,20 1,40 1,60
CS1_1b
Zero Integration CS1_2b
Partial Integration CS1_3b Max Integration bn €
HVDC Cables HVDC Onshore Nodes HVDC Offshore Nodes HVAC Cables HVAC Onshore Nodes HVAC Offshore Nodes
Cost for CS1 with High OWP Cost for CS1 with Low OWP
Figure 4 Cost structure for the Case Study 1 scenarios
Figure 3 Case Study 1 – Scenario of Low OWP/maximum integration – schematic build-out
gration scenario is the most favourable due to reduced costs. This approach however, requires large efforts to coordinate inter-
national energy infrastructure and sea use planning, extensive technological know-how regar- ding multi-terminal systems. The benefits of such a system could be high infrastructure utilisation rates and cost sharing opportuni- ties. The grid costs are lowest for the maximum integration scena- rio – 1.32 billion EUR. The costs for the zero integration and the maximum integration scenarios are: 1.37 billion EUR and 1.75 billi- on EUR respectively. Based on the CBA analysis, compared to the base-case scenario (zero inte- gration), the additional benefits of the maximum integration amount
to 1.81 billion EUR. Figure 5
Case Study 2 Area
Figure 6
Case Study 2 – Scenario of High OWP/maximum integration – schematic build-out
Towards a Baltic Offshore Grid: connecting electricity markets through offshore wind farms
8
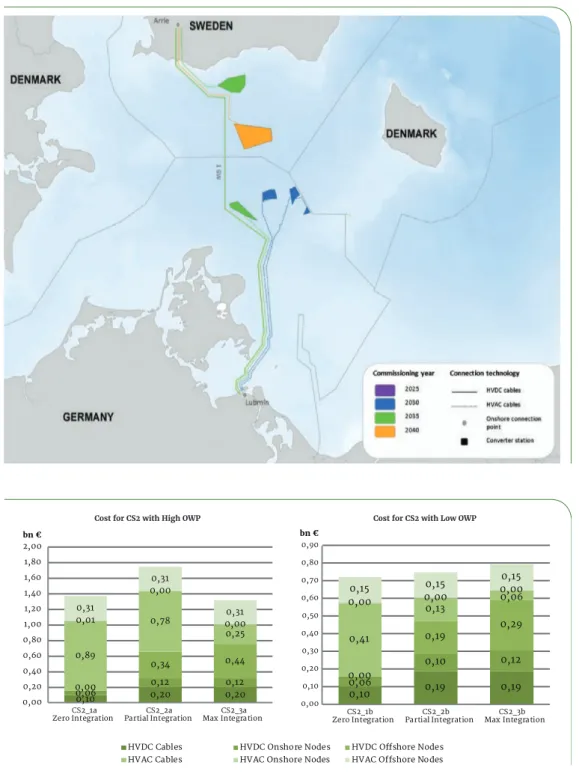
• For the Low OWP build-out (assuming 1.9 GW) no extra benefit and no cost reduction can be observed for wind farm integration. The costs for each of the scenarios are: zero integration – 0.72 billion EUR; partial integration 0.76 billion EUR; maximum integration – 0.81 billion EUR. Here, the zero integration scenario should be favoured. This means that all projects are connected radially to shore.
Table 1 sums up which level of integration has been evaluated to be the most economic for each scenario. Within the case studies a higher level of integration is favorable together with a high utili- zation of offshore wind power.
Figure 8 Cost structure for the Case Study 2 scenarios
0,10 0,20 0,20
0,06 0,12 0,12
0,00
0,34 0,44
0,89
0,78
0,25 0,01
0,00
0,00 0,31
0,31
0,31
0,00 0,20 0,40 0,60 0,80 1,00 1,20 1,40 1,60 1,80 2,00 bn €
CS2_1a
Zero Integration CS2_2a
Partial Integration CS2_3a Max Integration
0,10 0,19 0,19
0,06
0,10 0,12
0,00
0,19 0,29
0,41
0,13 0,06
0,000,15 0,000,15 0,000,15
0,00 0,10 0,20 0,30 0,40 0,50 0,60 0,70 0,80 0,90
CS2_1b
Zero Integration CS2_2b
Partial Integration CS2_3b Max Integration bn €
HVDC Cables HVDC Onshore Nodes HVDC Offshore Nodes HVAC Cables HVAC Onshore Nodes HVAC Offshore Nodes
Cost for CS2 with High OWP Cost for CS2 with Low OWP
Figure 7 Case Study 2 – Scenario of Low OWP/zero integration – schematic build-out
High OWP Partial
Integration Maximum Integration
Low OWP Maximum Integration Zero
Integration
However, there is no clear trend visible and extensive analysis (including a CBA and Cross-Border Cost Allocation) should be done for each project under consideration.
undacja na rzecz Energetyki Zrównoważonej
Photo: Fährhafen Sassnitz
2.1. Goal and structure of the PreFeasibility Studies
This document includes the results of PreFeasibility Studies for two cases of interconnectors integra ted with offshore wind farms (OWF):.
• Case study 1 includes a Polish-Swedish-Lithuanian Interconnector and
• Case Study 2 includes a German-Swedish interconnection with the possibility to connect offshore wind farms located in Denmark (off the coast of Bornholm).
The principal goal of the study is to answer the question whether an integrated approach in which offshore wind farms are connected to an interconnector, is feasible from technical, market, environ- mental and economic points of view. In order to fulfil this goal, the aims of the PreFeasibility Studies are to:
• Compare a meshed grid approach and a radial approach for planned OWFs and interconnectors,
• Provide potential technical designs with general costs for different alternatives (the scenarios considered in the study),
• Facilitate flexible development of the transmission grid,
• Provide general spatial alternatives,
• Provide a comparison of the costs and benefits of different scenarios.
The following are NOT the purpose of the study:
• Provide final solutions – those will have to be the subject of a full feasibility study and design process,
• Provide a prognosis for offshore wind development in the region – the PreFeasibility Studies rather focus on how to connect projects already in the pipeline. Nevertheless, for each case study, 2 different development roadmaps are presented for comparative reasons,
• Propose final corridors and layouts – these are also subject to detailed analysis.
The document is structured in the following manner:
1. Background information on the countries involved in both case studies providing the general background situation and context for the study,
2. Methodology of the study (analogical for both case studies), 3. Case Study 1 description, including results and conclusions, 4. Case Study 2 description, including results and conclusions.
2.2. Description of the Case studies
The geographical scope of the case studies, as well as the choice of potential interconnection, was decided after performing an analysis of existing conditions:
• Areas with highest potential of offshore wind energy development and an existing pipeline of projects,
• Energy price differences in the region and potential electricity interconnections,
• Ten Year Network Development Plans,
• Potential synchronisation of the Baltics (requiring additional transboundary infrastructure).
The choice of potential connections was discussed with transmission system operators.
The principal goal of the study is to answer the question whether an integrated approach in which offshore wind farms are connected to an interconnector, is feasible from technical, market, environmental and economic points of view
Towards a Baltic Offshore Grid: connecting electricity markets through offshore wind farms
12
An analysis of planned OWF projects showed that the majority of projects under development are located in this southern part of the basin. Therefore, both case studies involve areas in the South Baltic Region. The choice of suitable case studies had to take into account potential OWFs that could be connected to an interconnector.
Case Study 1 assumes a connection between Poland, Sweden and Lithuania which was dictated by several conditions:
• A significant number of OWF projects planned in the Polish Exclusive Economic Zone,
• Some OWF projects, both in Polish and Swedish waters are planned just at the Polish-Swedish border, at the South Middle Bank,
• A potential connection to Lithuania was indicated by the Polish Transmission System Operator (TSO) in connection to the potential synchronisation of the Baltics,
• There is an existing Polish-Swedish interconnector: SwePol Link (established infrastructural corridor),
• There is also an existing Swedish-Lithuanian connection: Nordbalt (established infrastructural corridor).
Although a second Polish-Swedish connection was not directly included in the Ten Year Network Development Plan (TYNDP) 2016 as a project candidate, it has been described as having significant market potential due to price difference. Instead, in the TYNDP 2016, there is a Polish-Danish inter- connection. However, due to the significant expected development of offshore wind farms in Poland and Sweden, and at a later stage in Lithuania, a Polish-Swedish-Lithuanian interconnection was eventually chosen for the Case Study.
Case Study 2 assumes a connection between Sweden, Germany, and – for the High Offshore Wind Power (High OWP) build-out scenarios – Denmark. Reasons behind such choice were the following:
• Significant number of OWF projects have been realized and are planned in the German Baltic Sea (territorial waters and EEZ),
• Swedish and Danish OWF projects close to the German border are under consideration by several project developers,
• The Swedish and German TSOs, Svenska Kraftnät (SvK) and 50Hertz, are realizing an inter- connector, called Hansa PowerBridge (planned commissioning 2025 or 2026). Furthermore, an additional interconnector between Sweden and Germany might have significant market poten- tial and is according to the TYNDP already under consideration by the corresponding TSOs (Hanse PowerBridge II).
2.3. About the Baltic InteGrid project
Baltic InteGrid “Integrated Baltic Offshore Wind Electricity Grid Development” is co-financed through the INTERREG Programme for the Baltic Sea Region in the financial perspective 2014-2020.
The project’s duration is fixed at 2016-2019.
The Baltic InteGrid project aims at contributing to sustainable electricity generation, the further integ- ration of regional electricity markets, and security of the supply of electricity in the Baltic Sea Region by applying an integrated grid approach to optimise the potential and efficiency of offshore wind energy.
The Baltic InteGrid project contributes to the EU Strategy of the Baltic Sea Region and fits into this strategy, as the development of a Baltic Offshore Grid concept is a step towards the creation of a fully interconnected and integrated regional energy market, the implementation of a Baltic Energy Market Interconnection Plan (BEMIP) and the demonstration of coordinated OWF connection solutions.
Introduction
The project pursues the objective of:
• Interconnection and integration of the regional market,
• Development and integration of energy markets,
• Improving the security of electricity supply,
• Fostering the diversification of energy sources, and therefore helping to reduce the emission of greenhouse gases,
• Contributing to considerable economic growth due to new business activities in the renewable energy and grid sectors.
During the project lifetime, the project partners from all eight EU Member States in the Baltic Sea Region are working in close cooperation with key stakeholders towards the following main outputs:
• The Baltic Offshore Grid Forum: The conference and communication platform of the project,
• A high-level concept for the Baltic Offshore Grid: A summary of the interdisciplinary research component of the project,
• Detailed case studies for two interconnection scenarios serving as components of the Baltic Grid Concept (the purpose of this document),
• Strategic recommendations.
The Ministry of Economics of the Republic of Latvia, acting as the Policy Area Coordinator for the Policy Area Energy (PA Energy) of the EU Strategy for the Baltic Sea Region (EUSBSR), accepted the project Baltic InteGrid as a Flagship Project under the EUSBSR.
The Baltic InteGrid project is executed in a consortium of 14 project partners (PP) from all 8 EU Member States in the Baltic Sea Region:
PP 1 – Project Leader – Institute for Climate Protection, Energy and Mobility (Germany) PP 2 – Foundation for Sustainable Energy (Poland)
PP 3 – Rostock Business and Technology Development (Germany) PP 4 – Technical University of Denmark (Denmark)
PP 5 – Energy Agency for Southeast Sweden (Sweden) PP 6 – Deutsche WindGuard GmbH (Germany) PP 7 – Maritime Institute in Gdańsk (Poland)
PP 8 – German Offshore Wind Energy Foundation (Germany)
PP 9 – Latvian Association of Local and Regional Governments (Latvia) PP 10 – Aalto University (Finland)
PP 11 – University of Tartu (Estonia)
PP 12 – Public Institution Coastal Research and Planning Institute (Lithuania) PP 13 – Lund University (Sweden)
PP 14 – Aarhus University (Denmark)
In addition, the project consortium is supported by 35 Associated Organisations, which include, among others, Transmission System Operators from Poland, Lithuania, Germany, Denmark and Estonia, investors in the OWFs, enterprises, representatives of administrations from Germany, Lithuania and Latvia, as well as research and development agencies and institutions.
More information about the project and the consortium can be found at: www.baltic-integrid.eu.
Photo: EnBW
3.1. European context
3.1.1. Policy and regulation
At the EU level, the Energy Union as a political strategy aims at:
• Achieving security of supply,
• Achieving an integrated EU energy market,
• Improving energy efficiency,
• Decarbonising the economy,
• Supporting breakthroughs in low-carbon and clean energy technologies.1
To this end, the EU is pursuing a strategy building on its 2030 Framework for Climate and Energy2. In November 2016, the Commission proposed the Winter Package, a new legisla tive package which, among other things, recasts legislation from the EU’s 3rd energy package3 and sets new rules for Agency for the Cooperation of Energy Regulators (ACER), the European energy regulator4. Among other factors, strengthening cross-border cooperation and enhancing interconnection between elec- tricity systems is of great importance.5
Furthermore, in order to bring the EU internal energy market in the Baltic Sea Region forward and end energy isolation in this area, all partner countries and the Commission signed a Memorandum of Understanding for a Baltic Energy Market Interconnection Plan (BEMIP) initiative in 2009, which was updated in 2015.6 The BEMIP aims at designing an integrated electricity and gas market in the Baltic Sea Region, among other ways, through the development of renewable energy infrastructure projects and interconnectors.7 The BEMIP action plan 2015 defined concrete actions in the field of energy infrastructure, electricity markets, power generation, security of supply, energy efficiency and renewable energy and encompasses measures for the period until 2020.8
In this context, the Baltic InteGrid project aims at assessing the optimised potential of offshore wind energy in the Baltic Sea region by applying an approach in which OWFs are integrated with interconnectors. Baltic InteGrid is directly in line with the Energy Union’s objectives, as it promotes not only the reinforcement and interconnection of electricity networks, but also fosters regional cooperation and regional energy security.
1 European Commission, ”Energy union and climate,” Accessed August 8th, 2018. https://ec.europa.eu/commission/
priorities/energy-union-and-climate_en.
2 European Commission, ”Building the Energy Union” Accessed August 8th, 2018. https://ec.europa.eu/energy/en/
topics/energy-strategy-and-energy-union/building-energy-union.
3 European Commission, ”Commission proposes new rules for consumer centred clean energy transition” Accessed August 8th, 2018. https://ec.europa.eu/energy/en/news/commission-proposes-new-rules-consumer-centred- clean- energy-transition.
4 European Commission, ”Clean Energy for All Europeans” Accessed August 8th, 2018. https://ec.europa.eu/energy/en/
topics/energy-strategy-and-energy-union/clean-energy-all-europeans.
5 Recast of Directive 2009/72/EC as proposed by COM(2016) 864 final/2, p. 7.
6 European Commission, ”Baltic Energy Market Interconnection Plan” Accessed August 8th, 2018. https://ec.europa.eu/
energy/en/topics/infrastructure/trans-european-networks-energy/baltic-energy-market-interconnection-plan.
7 European Commission, ”Memorandum of Understanding on the Baltic Market Interconnection Plan. Brussels”, 2009 Accessed August 8th, 2018. https://ec.europa.eu/energy/sites/ener/files/documents/2009_bemip_mou_signed.pdf.
8 European Commission, ”PA Energy – BEMIP Action Plan (for competitive, secure and sustainable energy)” Accessed August 8th, 2018. https://ec.europa.eu/energy/sites/ener/files/documents/BEMIP_Action_Plan_2015.pdf.
Policy &
Regulation
Towards a Baltic Offshore Grid: connecting electricity markets through offshore wind farms
16
3.1.2. Internal Energy market
Development of a fully integrated internal energy market is one of the five key goals of the EU Energy Union. This chapter describes the general background of the electricity markets in the Baltic Sea Region. Within the region, there are three separate synchronous systems: the Nordic system, the Continental system, and the Baltic power system; the latter is synchronous with the IPS/UPS system (i.e. Russia and Belarus).
The BEMIP allowed the Baltic States to reach an interconnection level of 23%, making the region among the best interconnected in Europe.9 Synchronising the Baltic electricity grid with the EU remains a challenge however. Currently, the Baltic States are still part of the Belarus-Russia-Esto- nia-Latvia-Lithuania ring (BRELL), and are aiming at synchronising with the European network by 2025.10 As a result, the NordBalt link (connecting Sweden and Lithuania) and LitPol link (connecting Poland and Lithuania) were constructed. The synchronous areas are illustrated in Figure 9 below, notably Denmark is divided between two synchronous areas: Denmark-East, which is part of the Nordic system, and Denmark-West, which is part of the continental system.11
Total annual electricity consumption in the Baltic Sea Region amounts to 1100 TWh, and half of it is consumed by Germany. The Nordic power system is dominated by hydropower with the additio- nal sources being nuclear, Combined Heat and Power (CHP) (a large portion being based on wood waste), wind power, and a small but increasing share of solar. The hydropower sources are mainly located in Norway and northern Sweden whereas the nuclear power plants are located in southern Sweden and Finland (additional one is under construction). The international trade is usually leaning 9 European Commission, ”Baltic Energy Market Interconnection Plan” Accessed August 8th, 2018. https://ec.europa.eu/
energy/en/topics/infrastructure/trans-european-networks-energy/baltic-energy-market-interconnection-plan.
10 European Commission, ”Country Report Lithuania 2018”, Brussels: European Commission, 2018. Accessed August 8th, 2018. https://ec.europa.eu/info/sites/info/files/2018-european-semester-country-report-lithuania-en.pdf.
11 ENTSO-E, ”Regional Investment Plan 2017. Regional Group Baltic Sea”. Brussels: ENTSO-E, 2017.
HVDC interconnections
Existing
1. Skagerrak 1-4 1600 MW
2. Norned 700 MW
3. Konti-Skan 1-2 680/740 MW
4. Kontek 600 MW
5. Baltic Cable 600 MW 6. SwePol Link 600 MW 7. Fenno-Skan 1-2 1200 MW
8. NordBalt 700 MW
9. Estlink 1-2 1000 MW 10. Vyborg Link 350/1400 MW 11. Storebaelt 600 MW 12. LitPol Link 500 MW Under Construction
13. Cobra (2018) 700 MW 14. Kriegers Flak Combined
Grid Solution (2019) 400 MW 15. Nord Link (2020) 1400 MW 16. Nord Sea Link (2021) 1400 MW Synchronous area
Nordic
Continental Europe IPS/UPS
UK
Figure 9 Synchronous Areas and HVDC interconnections of Baltic Sea Region [Source: ENTSO-E]
Internal Energy Market
towards energy export from the Nordic region in a normal year, however it is highly weather depen- dent. Sweden and Norway have a surplus of energy whereas Finland is a net electricity importer.
The continental part of the Baltic Sea is different. Thermal power dominates, except for Denmark which is dominated by wind power and other renewable energy sources (RES).
From the Baltic Sea Region countries, Denmark, Poland, Estonia and Latvia have a neutral annual power balance and Germany is a net exporter of electricity. Lithuania is currently operating with a large energy deficit. The trend for Lithuania and Denmark is towards dependency on imports in peak load situations.12
Energy prices
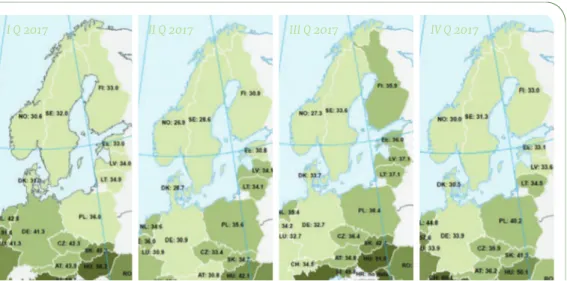
The energy prices in the Baltic Sea Region differ markedly with differences reaching over 10 EUR per MWh in comparison with continental Europe and Nordic countries (see Figure 11). The wholesale baseload prices for each quarter of 2017 are shown in the figure below. In general, the highest energy prices are found in Poland, although energy prices in Germany fluctuate significantly. The lowest energy prices are found in the Nordic region: Norway and Sweden.
12 ENTSO-E, ”Regional Investment Plan 2017. Regional Group Baltic Sea”. Brussels: ENTSO-E, 2017.
Sum of imports1 Sum
of exports1 Balance (imp-exp)
AT 28 156 19 434 8 722
BA 3 086 6 841 -3 755
BE 14 654 8 451 6 203
BG 4 570 10 930 -6 360
CH 33 477 29 052 4 425
CZ 13 815 24 787 -10 972 DE 27 023 80 767 -53 744
DK 15 130 9 839 5 291
EE 3 580 5 620 -2 040
ES 21 845 14 175 7 670
FI 22 473 3 459 19 014
FR 19 959 60 939 -40 980 GB2 21 187 2 275 18 912
GR 9 836 1 039 8 797
HR 12 398 6 057 6 341
HU 17 971 5 240 12 731
IE 835 1 527 -692
IT 43 133 6 236 36 897
LT 11 107 2 834 8 273
LU 7 728 1 414 6 314
LV 4 828 3 791 1 037
ME 2 909 2 609 300
MK 5 201 3 154 2 047
NL 24 195 19 009 5 186
NO 5 611 21 537 -15 926
PL 14 018 12 016 2 002
PT 4 616 9 702 -5 086
RO 2 296 7 311 -5 015
RS 5 559 7 880 -2 321
SE 17 045 29 080 -12035
SI 8 360 9 415 -1 055
SK 13 249 10 598 2 651
TR3 6 413 1 444 4 969
ENTSO-E 446 263 438 462 7 801 Physical flow values in GWh
ENTSO-E areas
Continental European area (CE) Nordic Area
Baltic Area (synchronously connected to BY and RU) Ireland & Northern Ireland area
British area Isolated areas Other areas
Other areas synchronous with CE
Figure 10
Cross border physical ener- gy flows (GWh) in the Baltic Sea Region in year 2016 [Source: ENTSO-E]
Towards a Baltic Offshore Grid: connecting electricity markets through offshore wind farms
18
Interconnection capacity
Building a well-functioning integrated energy market requires a well-integrated electricity grid.
To this end, the EU set out electricity interconnection targets between countries for 2020 and 2030 which are 10% and 15% respectively.
Table 2 Member States’ interconnection levels in 2017 and 202013 Country Interconnection levels
in 2017 Expected interconnection levels in 2020*
DE 9% 13%
DK 51% 59%
EE 63% 76%
FI 29% 19%
LT 88% 79%
LV 45% 75%
PL 4%** 9%
SE 26% 28%
The implementation of Projects of Common Interest (PCI) has led to increasing interconnection levels over the recent years. In order for a project to obtain a status of PCI it should be included in a Ten Year Network Development Plan (TYNDP) which is revised every two years. At the moment of writing of this report, the TYNDP 2018 was under preparation. TYNDP 2016 projects map is available below in Figure 12.
13 European Commission, ”Communication from the commission to the european parliament, the council, the european economic and social committee and the committee of the regions. COM(2017) 718 final”. Brussels: European Com- mission, 2017.
I Q 2017 II Q 2017 III Q 2017 IV Q 2017
Figure 11 Wholesale baseload electricity prices in I – IV Quarters of 2017 [Source: European wholesale power exchange; EC DG Energy Quarterly Report on European Electricity Markets]
* As assessed by TYNDP 2016 and ENTSO-E Vision 2020.
** The low interconnection level is caused in the major part by the uncontrolled flow of energy (loop-flows) which hinders the possibility of transnational exchange through existing interconnectors.
Background
14
It has to be noted that a second Polish-Swedish connection was considered but not included in the TYNDP 2016, as it showed potential benefits. However, the decision by SvK and PSE was not to nomi- nate it as a new project candidate for inclusion in the TYNDP 2016. There are several reasons for this decision, and the most important is that there are already two new interconnectors between Sweden and Germany included in this Regional Investment Plan as well as one from Poland to Lithuania.15
The consultation of the TYNDP 2018 will be conducted between June and September 2018.
3.1.3. Maritime spatial planning
In 2014, Directive 2014/89/EU of the European Parliament and of the Council establishing a frame- work for maritime spatial planning was adopted. It sets out the requirement of Member States to establish their Maritime Spatial Plans (MSPs) by 31st of March 2021.
Currently, the MSPs are at varying stages of development and implementation in the Baltic coun- tries. So far, only Germany has adopted a Marine plan targeting intensive offshore wind development and marine environmental protection goals, as well as traditional maritime uses such as shipping and fisheries. However, for many coastal countries, an additional driver for a MSP is the rapid increase in interest in the development of offshore renewable energy projects. Questions still remain whether MSPs can fulfil their anticipated benefits, including the ability to reduce spatial conflicts among tra- ditional resource uses (e.g. fishing, shipping, tourism) and new ocean uses (e.g. OWE projects)16. 14 ENTSO-E, ”Project map” Accessed June 5th, 2018. http://tyndp.entsoe.eu/map/.
15 ENTSO-E, ”Regional Investment Plan 2015 Baltic Sea Region”. Brussels: ENTSO-E, 2015. Accessed June 5th, 2018.
https://docstore.entsoe.eu/Documents/TYNDP%20documents/TYNDP%202016/rgips/Regional%20Investment%20 Plan%202015%20-%20RG%20BS%20-%20Final.pdf.
16 Gopnik M. Et al, ”Coming to the table: Early stakeholder engagement in marine spatial planning.” Marine Policy 36, No.
5 (2012): p. 1139 – 1149.
Figure 12
TYNDP Projects map14
Spatial Planning under construction
in permitting planned but not yet in permitting under consideration commissioned
Towards a Baltic Offshore Grid: connecting electricity markets through offshore wind farms
20
Table 3 Overview of MSP status in countries included in the study1718192021
Case study country
MSP status
MSP legal power
MSP role
in terms of OWF Allowed
OWF areas
Sweden17 In the consul- tation stage (by October 2018)*
Non binding regional plans
OWF areas are not stric- tly defined by the plan.
Project developer decide on the location of OWF
On a case by case basis
Germany18 In place Binding MSP
Importance for the federal plan (EEZ), and guiding role for state waters
OWF areas are proposed in the MSP for EEZ. Yet, no strict exclusion of possibility for claiming other areas according to the EIA and avoiding conflicts with other uses
Denmark19
In development (1st draft by mid 2019. Final MSP plan 31.03.2021)
Non binding regional plans
MSP coordinates all marine uses, while plan- ning and management of OWF is the responsibility of the Danish Energy Agency
Location depends on the size of the OWF; 4-20 km from the shore for smal- ler and beyond 15 km for large scale OWF
Poland20
In the consul- tation stage (1st draft released in June 2018)*
Currently availa- ble only non-bin- ding pilot plans
MSP indicates suitable
areas for OWF Only in EEZ
Lithuania21
In place under the “Compre- hensive Plan of the Republic of Lithuania”, adop ted in 2015
Binding MSP
MSP propose suitable areas, while the Ministry is responsible for detailed management
Beyond 20 m isoline
3.1.4. Supply chain
A detailed overview of the supply chain issues related to the grid development in the Baltic Sea is included in the publications developed under the Market & Supply Chain Working Group in the scope of Baltic InteGrid project22:
17 More information – Swedish Agency for Marine and Water Management (SWAM): www.havochvatten.se.
18 More information – EEZ MSP: Bundesamt für Seeschifffahrt und Hydrographie (BSH): www.bsh.de; territorial waters:
www.ikzm-strategie.de.
19 More information – Danish Maritime Authority, Ministry of Business and Growth: www.dma.dk.
20 More information – Ministry of Maritime Economy and Inland Navigation: www.mgm.gov.pl, Maritime Office in Gdynia:
www.umgdy.gov.pl.
21 More information – Ministry of the Environment: www.am.lt.
22 Publications developed within the Baltic InteGrid project will be published and availaible on the www.baltic-integrid.eu.
*[NOTE]: Countries where MSP is in the process of being developed keep 2021 as the final deadline for releasing their final plans.
Background
Market &
Supply Chain
• Supply Chain Analysis, Overview for the Baltic Sea Region23,
• “Assessment of Baltic hubs for offshore grid development”24,
• “Baltic offshore grid SME business cases”25.
Based on those publications a general state of the transmission system supply chain in the Baltic Sea Region is presented, including its adequacy and opportunities for new entrants.
There are just a few well established OWE transmission component suppliers in Europe, espe- cially in the case of export cables. An increasing demand for export cables is forecast in the coming years; and interviews with major European cable suppliers26 suggested that manufacturers stand ready to adjust their production capacities so that no bottlenecks occur. However, other interviewed companies stated that export cable production lines could become a bottleneck in the future since their capacities are restricted, particularly in the case of HVDC technology, which is increasingly in demand. Still, other, larger companies, e.g. from Asia, could enter the European market.
The market for subsea cables is dominated by a few multinational corporations. All of the compa- nies that produced inter-array and export cables for the European market in 2016 have been in busi- ness for many years and are often large and well established multinational corporations. New market entrants would face extremely high costs in building a manufacturing plant, hiring skilled workers, buying specialised cable laying vessels and developing subsea cable expertise. Subsea cables are produced in extreme lengths to avoid large numbers of joints; thus, the production process differs greatly from onshore cables. Only specialised manufacturing plants can perform the necessary pro- duction steps.
The production of HVDC cables in particular comes (currently) with a larger number of risks than the production of HVAC cables. The HVDC technology is still a younger and less established tech- nology. Thus potential setbacks – including financial loss – are more likely. The production of HVDC cables is therefore not a business case for small and medium sized companies.
The research and development of converters, transformers, cables and protection equipment is extre mely cost-intensive and many additional factors such as employee training and education must be considered. Like the subsea cable market, the development and manufacturing of the components requires specialised facilities and a large worldwide network of experts and know-how. The market for VSC-HVDC is rather new and the technology is quite expensive. And the new technology has its risks that, for the most part, only large corporations can absorb.27, 28 Offshore challenges such as extremely deep water, hostile weather conditions and a lack of shore-side infrastructure create further barriers to entry.29
The barriers to entry for companies entering the market for offshore substation foundations are different to the barriers to entry for the previously described products. The technology for foundations is less complex. New market entrants need to have a facility available where they can manufacture
23 Rostock Business, ”Supply Chain Analysis, Overview for the Baltic Sea Region” A report for the Baltic InteGrid project (2018), Baltic InteGrid.
24 BVG Associates, ”Assessment of Baltic hubs for offshore grid development.” A report for the Baltic InteGrid project (2018). Baltic InteGrid.
25 BVG Associates, ”Baltic offshore grid SME business cases”. A report for the Baltic InteGrid project (2018). Baltic Inte- Grid.
26 Interviews by Elizabeth Côté and Julia Sandén. WindEurope Conference & Exhibition, Amsterdam, November 28-30, 2017.
27 Manager Magazin, ”Deutschlands schwimmende Steckdose” Accessed August 8th, 2018 http://www.manager-magazin.
de/unternehmen/energie/general-electric-jagt-siemens-bei-offshoe-windkraft-a-1158523-2.html.
28 Inwl, “Evaluation of active converters “.
29 The High Wind Challenge, “Reducing weather downtime in offshore wind turbine installation” http://www.highwind- challenge.com/2016/06/13/reducing-weather-downtime-in-offshore-wind-turbine-installation/.
Towards a Baltic Offshore Grid: connecting electricity markets through offshore wind farms
22
very large and very heavy products. Additionally, they need direct water access to transport their products since road transport would be nearly impossible due to the high costs.30 Larger companies might consider entering the market by creating a subsidiary and draw from expertise already existing in the field. An example is Steelwind Nordenham, which is part of the Dillinger Group, an established steel producer.31
Maintenance and repair service is the combination of all technical and administrative measures including management measures during the lifetime of a unit to maintain its safe and proper fun- ctioning. In offshore projects especially, the machines and equipment face extremely challenging environmental conditions. It is in the manufacturers’ interest to have as little maintenance and repair work (especially in the early years of the project) as possible needed. Because of that, for offshore substations, most of the manufacturing companies offer maintenance and servicing solutions them- selves, although it is quite common for these large companies to hire subcontractors for some of the maintenance and service tasks.
Figure 13 shows an exemplary grid connection timeline for the case of an 80 km export cable, status 2017. The durations for the different tasks include design, production, transportation and in- stallation.
3.1.5. Environment
The general characteristics of the Baltic Sea environment was presented in the chapter 6 of the Impact Mitigation Strategy for the Baltic Offshore Grid (IMS)32,which is one of the publications deve loped within the Baltic InteGrid project. The characteristics mentioned above concern the whole of the Baltic Sea (including the parts covered by both case studies) and referred to the following aspects:
• Bathymetry, hydrography and water quality,
• Geological structure, surface sediments and contaminants,
• Climate and air quality,
• Benthic and pelagic habitats,
30 NWZ Online, ”Nordenham: Steelwind-Ansiedlung versetzt Blexer in Hochstimmung” (2011) Accessed August 8th, 2018.
https://mobil.nwzonline.de/wesermarsch/wirtschaft/nordenham-steelwind-ansiedlung-versetzt-blexer-in-hoch- stimmung_a_1,0,583171070.html
31 Steelwind Nordenham, “About us “ Accessed August 8th, 2018. http://www.steelwind-nordenham.de/steelwind/unter- nehmen/wersindwir/index.shtml.en
32 J. Makowska; A. Marczak; M. Karlikowska; M.Wójcik; M. Trzaska, ”Impact Mitigation Strategy for the Baltic Offshore Grid”. Developed under Baltic InteGrid project, (2018). Baltic InteGrid.
2018 2019 2020 2021 2022 2023 2024
Offshore Converter
01.01.2018 – 06.11.2021
Onshore Converter
01.01.2018 – 10.23.2019
Export Cable 10.23.2019 – 11.26.2020
Offshore Transformer
06.11.2021 – 03.14.2024 Figure 13
Overview of the erection timeline of an offshore transmission system [Source: Baltic InteGrid – Supply Chain Analysis Overview for the Baltic Sea Region]
Background
Environment &
Society
• Fish,
• Marine mammals,
• Birds,
• Protected areas and Natura 2000 sites,
• Eutrophication,
• Underwater noise,
• Shipping and shipping lanes,
• Marine fisheries,
• Conventional weapons and chemical warfare,
• Mining areas.
For the description of the status of the Baltic Sea please refer to the IMS.
Photo: Arno Nym
Denmark
3.2. Country context
3.2.1. Denmark
Political goals for renewable energy and offshore wind
• Current target assumes at least 50% renewable energy for all supply by 2030.33
• ‘Our Future Energy’ strategy introduced in 2011, sets a target of 100% of renewable energy by 2050 in the electricity, heat, industry and transport sectors.
• The Danish government plans a coal phase-out from plants and private boilers by 2030, as well as 100% of electricity and heat from renewable energy sources by 2035.
• The 2012 Energy Agreement provides a roadmap for the development of energy demand and supply between 2012 and 2020, with a focus on the expansion of offshore wind so that rene- wables reach 70% of Danish electricity production by 2020 (of which 50% would come from wind)34. The Agreement notably implies that Kriegers Flak (600 MW) and Horns Rev (400 MW) would both be built before 2020, as well as an additional 500 MW of offshore wind near-coast and 1,800 MW onshore.35
Energy numbers
Gas 7%
Oil 1%
Coal 29%
Biofuels & Waste 18%
Solar 2%
Wind 43%
Renewables 63%
2016
Electricity generation: 30.1 TWh (2016)
RES share (electricity): 63%
(2016)
Electricity consumption per capita: 5,81 MWh/cap/annum (2016)
Offshore wind capacity installed
At the end of 2017, Denmark had 12 grid-connected offshore wind farms with 506 grid-connected turbines that had a total installed capacity of 1,266 MW.36
OWF grid connection and cost allocation
Connection costs are borne by the plant operator up to a near onshore connection point; additional costs are borne by the TSO. In those cases, charges are calculated to a theoretical point that might be closer than the physical connection point. In tendered, far-shore projects such as Kriegers Flak, the plant operator bears the costs only up to the offshore connection point at the AC transformer station.
Transmission System Operator
In Denmark the grid is operated by the company Energinet (www.energinet.dk)
33 Danish Energy Agency, ”Denmark’s Energy and Climate Outlook 2017”. Copenhagen: DEA, 2017. Accessed August 8th, 2018. https://ens.dk/sites/ens.dk/files/Analyser/denmarks_energy_and_climate_outlook_2017.pdf p. 21.
34 IRENA, ”Denmark. Market overview”. Accessed April 24th, 2018. https://www.irena.org/documentdownloads/publica- tions/gwec_denmark.pdf.
35 IEA, ”Danish Energy Agreement for 2012-2020”. Accessed April 24th, 2018. https://www.iea.org/policiesandmeasures/
pams/denmark/name-42441-en.php.
36 WindEurope, ”The European offshore wind industry. Key trends and statistics 2017”. WindEurope (2018). Accessed August 8th, 2018. https://windeurope.org/wp-content/uploads/files/about-wind/statistics/Wind Europe-Annual- Offshore-Statistics-2017.pdf, p. 18.
[NOTE]: none of the case studies includes a connection to Denmark or Bornholm, however one of the scenarios inclu- des offshore wind farms located in Danish waters, which are connected to other countries.
Figure 14
2016 Gross electricity generation in Denmark [Source: International Energy Agency]
Germany
3.2.2. Germany
Political goals for renewable energy and offshore wind
• Development of renewable energy sources is at the heart of the German’s energy transition strategy, the so called Energiewende.37
• The Renewable Energies Act38 (EEG) sets targets for a share of renewable energy in the electrici- ty mix of 40-45% by 2025, 55-60% by 2035 and at least 80% by 2050.39 In order to achieve these targets, Germany aims at developing its offshore wind sector.
• Germany envisages an offshore wind installed capacity of 15 GW by 203040, of which 3.3 GW will expectedly be installed in the Baltic Sea41. Offshore wind energy production amounted to 17.9 TWh in 201742.
Energy numbers
Offshore wind capacity installed
At the end of 2017, Germany had 5.4 GW of installed offshore wind capacity feeding into the grid – of which 692.3 MW were installed in the Baltic Sea.43
OWF grid connection
In Germany, the transmission system operator covers the connection costs from the offshore sub- station to the onshore grid connection point. The costs are financed through grid tariffs.
Transmission System Operator
In Germany, there are four transmission system operators, the one responsible for the Baltic Sea is the company 50Hertz Transmission GmbH (www.50hertz.com).
37 European Commission, ”National action plans” Accessed April 24th, 2018. https://ec.europa.eu/energy/en/topics/
renewable-energy/national-action-plans.
38 Erneuerbare-Energien-Gesetz vom 21. Juli 2014 (BGBl. I S. 1066), das zuletzt durch Artikel 1 des Gesetzes vom 17. Juli 2017 (BGBl. I S. 2532) geändert worden ist (EEG).
39 Sec. 1 par. 2 EEG.
40 Sec. 1 par. 2 (1) WindSeeG.
41 German Offshore Network Development Plan 2030 (O-NEP).
42 AGEB, ”Wytwarzanie energii elektrycznej brutto w Niemczech od 1990 r.”. Accessed August 8th, 2018. https://ag-energie- bilanzen.de/index.php?article_id=29&fileName=20171221_brd_stromerzeugung1990-2017.pdf.
43 Deutsche WindGuard, ”Status Des Offshore-Windenergieausbaus in Deutschland”. Varel: Deutsche WindGuard.
Accessed August 8th, 2018 http://www.windguard.de/veroeffentlichungen.html?file=files/cto_layout/img/unterneh- men/veroeffentlichungen/2018/Status%20des%20Offshore-Windenergieausbaus%20in%20Deutschland%2C%20Ge- samtjahr%202017.pdf.
Gas 13%
Oil 1%
Nuclear 13%
Coal 43% Biofuels & Waste 9%
Solar 6%
Wind 12%
Hydro 3%
Renewables 30%
2016 Gross electricity generation:
654.8 TWh (2017) of which 17.9 TWh (2.8%) is generated by offshore wind energy RES share (gross electricity generation): 33.3% (2017) Electricity consumption per capita: 6.92 MWh/cap/annum (2016)
Figure 15
2016 Gross electricity generation
in Germany [Source: 2016 data International Energy Agency / 2017 data AG Energiebilanzen e.V.]
Lithuania
3.2.3. Lithuania
Political goals
• In recent years, Lithuania has diversified its energy mix and connected with other Member States in the region to strengthen its energy independence and security of supply. NordBalt, Estlink, and LitPol have led to a significant increase of the interconnection level, from 4% (2014) to 22% (2017), allowing the country to reach the EU interconnection target of 10%. Moreover, Lithuania achieved its renewable energy target of 23% for 2020 in 2014.
• On 13 June 2018, the Lithuanian Parliament officially adopted an ambitious National Energy Strategy which for a 45% renewables share of its electricity mix by 2030 and 100% by 2050.51 Energy numbers
Gas 16%
Mixed fuels
& Other non renewables
60%
Biofuels & Waste 3%
Wind 15%
Hydro 4%
Solar 2%
Renewables 24%
2016
Electricity generation: 4.3TWh (2016)
Electricity demand: 12.5 TWh (2016)
Electricity consumption per capita: 4.11 MWh/cap/annum (2016)
RES share (electricity):
49% (2016)
Offshore wind capacity installed
Several offshore wind farms are planned in Lithuanian waters, however no offshore wind farms have been installed yet.
OWF grid connection
The plant operator bears 40% of the connection costs. This also includes the costs incurred from reinforcing the onshore transmission grid (up to a threshold of 10% of the incurred costs).
Transmission System Operator
In Lithuania, the company responsible for the transmission grid is Litgrid (www.litgrid.eu).
51 Ministry of Energy of the Republic of Lithuania, ”National energy independence strategy, executive summary – energy for competitive lithuania”. 2018. Accessed August 8th, 2018. http://enmin.lrv.lt/uploads/enmin/documents/files/
Natio nal_energy_independence_strategy_2018.pdf.
Figure 16
2016 Gross electricity generation in Lithuania [Source: International Energy Agency]

![Figure 20 Map of existing and planned OWFs and interconnection projects in the Baltic Sea – status as of June 2018 [Source: Baltic InteGrid project – Maritime Institute in Gdańsk]](https://thumb-eu.123doks.com/thumbv2/1library_info/4585031.1601892/38.892.227.801.155.868/figure-existing-interconnection-projects-integrid-maritime-institute-gdańsk.webp)

![Figure 23 Map presenting constraints for linear infrastructure [source: Baltic InteGrid project – Maritime Institute in Gdańsk]](https://thumb-eu.123doks.com/thumbv2/1library_info/4585031.1601892/41.892.99.675.721.1118/figure-presenting-constraints-infrastructure-integrid-maritime-institute-gdańsk.webp)
![Figure 24 Map presenting constraints for offshore substations [Source: Baltic InteGrid project – Maritime Institute in Gdańsk]](https://thumb-eu.123doks.com/thumbv2/1library_info/4585031.1601892/42.892.227.795.143.553/presenting-constraints-offshore-substations-integrid-maritime-institute-gdańsk.webp)