Market Analysis of the Offshore Wind Energy Transmission
Industry
Overview for the Baltic Sea Region
October 2018
2
Copyright:
Reproduction of this publication in whole or in part must include the customary bibliographic citation, including author attribution, report title, etc.
Cover photo: ENBW
Published by: Baltic InteGrid
Disclaimer:
The content of the report reflects the author’s/partner’s views and the EU Commission and the MA/JS are not liable for any use that may be made of the information contained therein. All images are copyrighted and property of their respective owners.
www.baltic-integrid.eu
Market Analysis of the Offshore Wind Energy Transmission Industry
Overview for the Baltic Sea Region
By Elizabeth Côté (IKEM), Michael Holton (IKEM), Anika Nicolaas Ponder (IKEM), Julia Sandén (IKEM), and Anna-Kathrin Wallasch (Deutsche WindGuard)
I
Content
LIST OF ABBREVIATIONS ... V
1. INTRODUCTION ... 9
2. OFFSHORE WIND ENERGY IN THE EUROPEAN UNION ... 10
2.1 Regulatory regimes for offshore wind connections ... 11
2.2 Grid connection technology ... 11
2.3 OWE in the BSR ... 12
3. METHODS ... 15
3.1 Component-specific descriptions... 15
3.2 Baltic InteGrid offshore wind development scenarios ... 15
3.3 Component-specific demand calculations assumptions ... 16
3.4 Semi-structured interviews and literature review ... 17
4. OVERVIEW AND ANALYSIS OF HVAC CABLES MARKET ... 18
4.1 Component description ... 18
4.1.1 Cross-linked polyethylene cables ... 18
4.1.2 High-temperature superconducting cables ... 19
4.2 Current demand ... 19
4.3 Market characteristics ... 20
4.3.1 Competitive landscape ... 20
4.3.2 Manufacturing bottlenecks ... 22
4.3.3 Price trends ... 22
4.4 Technological trends... 23
4.5 Barriers to entry ... 24
5. OVERVIEW AND ANALYSIS OF HVDC CABLES MARKET ... 25
5.1 Component description ... 25
5.1.1 Self-contained fluid-filled cables ... 25
5.1.2 Mass-impregnated cables ... 25
5.1.3 Cross-linked polyethylene cables ... 26
5.2 Current demand ... 26
5.3 Market characteristics ... 27
5.3.1 Competitive landscape ... 27
5.3.2 Manufacturing bottlenecks ... 29
5.3.3 Price trends ... 29
5.4 Technological trends... 30
5.5 Barriers to entry ... 31
6. OVERVIEW AND ANALYSIS OF AC-DC CONVERTER MARKET ... 32
6.1 Component description ... 32
6.2 Line-commutated converters ... 32
6.2.1 Voltage-source converters ... 32
6.3 Current demand ... 33
6.4 Market characteristics ... 35
II
6.4.1 Competitiveness landscape ... 35
6.4.2 Manufacturing bottlenecks ... 35
6.4.3 Price trends ... 35
6.5 Technological trends... 36
6.6 Barriers to entry ... 36
7. OVERVIEW AND ANALYSIS OF TRANSFORMER MARKET ... 37
7.1 Common description... 37
7.2 Current demand ... 38
7.3 Market characteristics ... 38
7.3.1 Competitiveness landscape ... 39
7.3.2 Manufacturing bottlenecks ... 39
7.3.3 Price trends ... 39
7.4 Technological trends... 40
7.5 Barriers to entry ... 40
8. OVERVIEW AND ANALYSIS OF OFFSHORE SUBSTATION FOUNDATION MARKET ... 41
8.1 Component description ... 41
8.1.1 Monopile foundations ... 41
8.1.2 Jacket foundations ... 42
8.1.3 Gravity foundations ... 42
8.1.4 Tripod foundations ... 42
8.1.5 Floating foundations ... 43
8.2 Current demand ... 43
8.3 Market characteristics ... 45
8.3.1 Competitive landscape ... 45
8.3.2 Manufacturing bottlenecks ... 47
8.3.3 Price trends ... 47
8.4 Technological trends... 47
8.5 Barriers to entry ... 48
9. OVERVIEW AND ANALYSIS OF OPERATION, MAINTENANCE, AND SERVICE MARKET . 50 9.1 Activities description ... 50
9.1.1 Contract management ... 50
9.1.2 Operations management ... 51
9.1.3 Onshore facilities ... 51
9.1.4 Balance-of-plant OMS... 51
9.1.5 Offshore logistics ... 52
9.2 Current demand ... 52
9.3 Market characteristics ... 53
9.3.1 Competitive landscape ... 53
9.3.2 Price trends ... 53
9.4 Technological trends... 54
9.4.1 Weather forecasting and analysing ... 54
9.4.2 Remote monitoring, inspections, and repairs ... 55
9.4.3 Condition-monitoring ... 56
9.4.4 Improvements in offshore logistics for far-offshore farms ... 57
III 9.5 OMS strategies ... 58 10. CONCLUSION ... 59 APPENDIX A MAPS OF HIGH AND LOW DEVELOPMENT SCENARIOS ... 66 APPENDIX B DETAILED DEVELOPMENT SCENARIOS FOR MEMBER STATES IN THE BSR ... 68 APPENDIX C WORK PACKAGE 4: CASE STUDY 1 AND 2, PARTIAL INTEGRATION, HIGH/LOW SCENARIOS 69
APPENDIX D INDEX OF SEMI-STRUCTURED INTERVIEWS ... 1
IV
List of figures
FIGURE 1.WATER DEPTH AND DISTANCE TO SHORE OF OWFS FULLY OR PARTIALLY COMPLETED AS OF 2017. ... 10
FIGURE 2.SHARE OF CUMULATIVE CAPACITY, INSTALLATIONS IN 2017, AND CONSENTED CAPACITY PER SEA REGION. ... 12
FIGURE 3.AVERAGE NATIONAL WIND FARM CAPACITIES IN BSR COUNTRIES. ... 13
FIGURE 4.PROJECTED OFFSHORE WIND INSTALLED CAPACITY, LOW AND HIGH SCENARIOS THROUGH TO 2030. ... 14
FIGURE 5.LOW AND HIGH SCENARIOS FOR OFFSHORE WIND DEVELOPMENT IN THE BALTIC SEA. ... 16
FIGURE 6.EXAMPLE OF XLPE CABLE DESIGN. ... 19
FIGURE 7.CUMULATIVE DEMAND FOR HVAC EXPORT CABLES IN THE BALTIC SEA. ... 20
FIGURE 8.MARKET SHARES FOR HIGH VOLTAGE SUBSEA CABLES MANUFACTURED IN 2016. ... 21
FIGURE 9.CUMULATIVE DEMAND FORECAST FOR HVDC EXPORT CABLES IN THE BALTIC SEA. ... 27
FIGURE 10.COST RELATIONSHIP BETWEEN AC AND DC TRANSMISSION. ... 30
FIGURE 11.CUMULATIVE DEMAND FORECAST FOR OFFSHORE CONVERTER STATIONS IN THE BALTIC SEA. ... 34
FIGURE 12.CUMULATIVE DEMAND FORECAST FOR OFFSHORE TRANSFORMER STATIONS IN THE BALTIC SEA. ... 38
FIGURE 13.OFFSHORE WIND FOUNDATION TYPES. ... 41
FIGURE 14.CUMULATIVE DEMAND FORECAST FOR SUBSTATION FOUNDATIONS IN THE BALTIC SEA. ... 44
FIGURE 15.SHARE OF FOUNDATION TYPES FOR GRID-CONNECTED TURBINES IN 2016. ... 44
FIGURE 16.OFFSHORE WIND FOUNDATIONS: MAIN MANUFACTURERS AND MARKET SHARES AS OF THE END OF 2016. ... 46
FIGURE 17.HIGH DEVELOPMENT SCENARIO FOR OFFSHORE WIND DEVELOPMENT IN THE BSR UNTIL 2030. ... 66
FIGURE 18.LOW DEVELOPMENT SCENARIO FOR OFFSHORE WIND DEVELOPMENT IN THE BSR UNTIL 2030. ... 67
FIGURE 19.DETAILED DEVELOPMENT SCENARIOS FOR ALL BSRMEMBER STATES. ... 68
FIGURE 20.CASE STUDY 1, PARTIAL INTEGRATION – HIGH SCENARIO., ... 69
FIGURE 21.CASE STUDY 1, PARTIAL INTEGRATION – LOW SCENARIO., ... 70
FIGURE 22.CASE STUDY 2, PARTIAL INTEGRATION – HIGH SCENARIO., ... 71
FIGURE 23.CASE STUDY 2, PARTIAL INTEGRATION – LOW SCENARIO., ... 72
List of tables
TABLE 1.DATA ON HVDC SUBSEA CABLES CONNECTING OFFSHORE WIND FARMS IN EUROPE. ... 28TABLE 2.COMPARISON OF LCC AND VSC. ... 33
TABLE 3.EUROPEAN OFFSHORE CONVERTERS. ... 35
TABLE 4. EVENTS INTERVIEWS INDEX... 1
TABLE 5. INDEX OF TELEPHONE INTERVIEWS... 2
V
List of Abbreviations
Al Aluminium
AC Alternating current
AUV Autonomous underwater vehicle B2B Back-to-back
BOP Balance of plant BSR Baltic Sea Region
Cu Copper
CAPEX Capital expenditure CGS Combined grid solution CSC Current-source Converter DC Direct current
ENTSO-E European Network of Transmission System Operators EPC Engineering, procurement, and construction
EPR Ethylene propylene rubber EWEA European Wind Energy Agency GGOWL Greater Gabbard Offshore Winds Ltd.
GW Gigawatts
GSU Generator step-up transformers HTS High-temperature superconductor HV High voltage
HVAC High-voltage alternating current HVDC High-voltage direct current
IKTS Fraunhofer Institute for Ceramic Technologies and Systems IRENA International Renewable Energy Agency
kA Kiloampere kV Kilovolt
LCC Line-commutated converter LCOE Levelized cost of electricity
MW Megawatts
VI
MI Mass-impregnated MTDC Multi-terminal HVDC MVA Megavolt-ampere
MVAC Medium-voltage alternating current OFTO Offshore transmission owner OLTC On-load tap-changer
O&M Operation and management
OMS Operations and maintenance services
O-NEP Offshore network development plan [Netzentwicklungsplan]
OPEX Operating expenses
OTM Offshore transformer module OWE Offshore wind energy
OWF Offshore wind farms PE Polyethylene
PST Phase-shifting transformer PTV Personnel transfer vessel PVC Polyvinyl chloride
R&D Research and development
RD&D Research, development, and demonstration ROV Remotely operated vehicle
SCADA Supervisory Control and Data Acquisition SHM Structural health monitoring
SME Small and medium-sized enterprises SOV Service operation vessel
T&D Transmission and distribution TSO Transmission system operator UUV Unmanned underwater vehicle VSC Voltage-source converter WPP Wind power plant
WTG Wind turbine generator
XLPE Cross-linked polyethylene
7
Summary
The Baltic InteGrid project is an interdisciplinary research initiative designed to facilitate transnational cooperation and optimise offshore wind development in the Baltic Sea Region (BSR). The following analysis provides project stakeholders with up-to-date information on current market conditions for the development of a regional meshed grid.
The report highlights relevant findings from the market analysis of the offshore wind energy transmission industry, with a particular focus on Europe and the Baltic Sea. It first provides a general overview of the European offshore wind energy industry, including information on relevant regulatory regimes, installed capacity, and technology trends. It then presents component-specific market overviews for high-voltage alternating current (HVAC) cables, high-voltage direct current cables (HVDC), converters, transformers, and substation foundations, as well as for the main operation, maintenance, and service (OMS) activities.
The offshore HVAC subsea-cable market is mature, with most of the supply provided by three main actors. European manufacturers are dominant, but new players are likely to enter the market as demand grows. New suppliers face barriers to entry, including high capital intensity, the need for high-level expertise, and the increasing importance of delivering turnkey solutions. Manufacturers have thus far expanded their production capacity to meet the increasing demand. There are no major bottlenecks in the supply chain for HVAC subsea cables, although the availability of installation vessels could prove problematic as demand rises.
HVDC technology has emerged as a solution to the limitations of HVAC technology. The European market for HVDC cables is growing due to increased demand for long-distance transmission. In the long run, the use of HVDC technology is likely to increase and become more common in the offshore wind energy (OWE) industry, provided that prices reduce to competitive levels. For now, however, uncertainty and risk associated with the technology make it difficult to forecast demand.
OWE converter demand in Europe is mainly driven by the deployment of HVDC technology. For now, the market is concentrated in the German part of the North Sea. As farms are built farther from shore, demand for HVDC technology is expected to grow if prices decrease to competitive levels. No major bottlenecks are foreseen at this point.
OWE transformer efficiency, rating, weight, and dimensions have improved significantly, driven by increased offshore wind farm (OWF) capacity and changing requirements. As the market continues to grow, further moderate innovations are expected. The competitive landscape for OWE power transformers is characterised by the dominance of a few well-established suppliers. Tap changers supply is a potential bottleneck in the future supply chain, along with copper windings. Further improvements in power density
8
are expected, but no significant reduction in capital expenditure is anticipated.
There is a high level of competition among OWE substation foundation manufacturers.
Thus far, most suppliers on the European market have been locally based, with significant players in the BSR. Some industry experts predict an increase in non-European supply.
Segments like engineering, installation, logistics, and subcomponents are examples of potentially competitive areas for SMEs. No major bottlenecks are anticipated.
The operations and maintenance service (OMS) sector is still relatively immature because OWFs have been operating for less than two decades and activities are still being adapted to changing parameters. Condition monitoring, forecast improvements, and technological innovations have allowed OMS to transition from a reactive to a more proactive approach, reducing costs and increasing energy generation. There is space in the OMS market for new companies to compete, provided that they offer cost reduction solutions (e.g. underwater drones).
9
1. Introduction
Offshore wind energy (OWE) is expected to play an important role in the future European energy mix. The European Union currently has 86 per cent of the total global OWE installed capacity in its waters, making it the world leader in offshore wind deployment.1 Although most of the installed capacity is located in the North Sea, the Baltic Sea Region (BSR) offers good conditions for offshore wind development. This report supports the objectives of the transnational Baltic InteGrid project by offering stakeholders up-to-date information on relevant conditions for the development of a regional meshed grid.
Specifically, it highlights relevant findings from the market analysis of the OWE transmission industry, with a particular focus on the European and BSR markets.
The first section of the report provides an overview of OWE in Europe by identifying the installed capacity, regulatory regimes, and technologies currently in place in the Member States of the BSR that are part of the European Union (EU). Section 2 outlines the methodology and assumptions used in creating the market development scenarios and market demand forecasts. Sections 3–8 present component-specific market overviews of the following offshore wind transmission components: high-voltage alternating current (HVAC) cables, high-voltage direct current (HVDC) cables, converters, transformers, and substation foundations; the main operation, maintenance, and service (OMS) activities are also described.
In this report, market analyses for offshore wind transmission components are based on information gathered from the technology catalogue,2 relevant literature, and semi- structured interviews. Each section briefly describes the function of each component in offshore wind transmission infrastructure; estimates component-specific demand through 2030 on the basis of market scenarios, outlines market characteristics (e.g., with regard to the competitive landscape, manufacturing bottlenecks, and price trends); highlights major technological developments; and identifies the main barriers to market entry for new manufacturing entities.
1 WindEurope (2017): Local impact, global leadership, The impact of wind energy on jobs and the EU economy, p. 17
2 Kaushik Das and Nicolaos Antonios Cutululis, Technology catalogue: components of wind power plants, AC collection systems, and HVDC systems, DTU, prepared for the Baltic InteGrid project, Work Package 3
10
2. Offshore Wind Energy in the European Union
In 2017, the net additional offshore wind installed capacity in Europe increased by a record of 3,148 megawatts (MW). This capacity corresponds to 560 new offshore wind turbines across 17 offshore wind farms (OWFs). The same year, the European total installed capacity reached 15,780 MW, which corresponds to 4,149 grid-connected wind turbines across 11 countries. Currently, 11 OWFs are under construction. Once commissioned, those projects will increase the total grid-connected capacity by 2.9 gigawatts (GW), bringing the cumulative European installed capacity to 18.7 GW. By 2020, WindEurope expects the total European capacity to grow to 25 GW.3
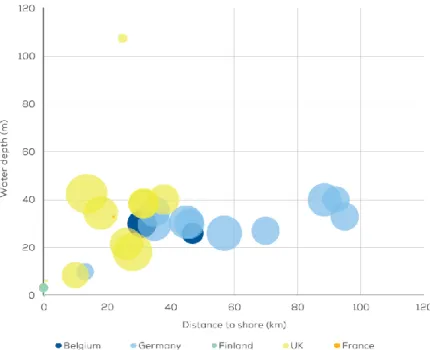
The average size of installed offshore wind turbines in 2017 was 5.9 MW, which corresponds to a 23 per cent increase compared to 2016. The average capacity of OWF was 493 MW in 2017, which is 34 per cent higher than the previous year. WindEurope expects the wind farm capacities to rise to up to 900 MW in the upcoming years.4 Figure 1 indicates the water depth and distance to shore of OWF completed or partially completed in 2017, where averages of 27.5 m and 41 km respectively are observed.5
Figure 1. Water depth and distance to shore of OWFs fully or partially completed as of 2017.6
3WindEurope (2018): Offshore Wind in Europe, Key trends and statistics 2017
4 Ibid.
5 Ibid.
6 Ibid.
11
2.1 Regulatory regimes for offshore wind connections
The choice of a grid investment model is important because it determines grid development responsibilities (e.g. the wind farm connection), which ultimately distributes costs and risks. There are currently three main regulatory regimes for connecting OWFs to the onshore grids in Europe: the transmission system operator (TSO) model, the OWF generator model, and the offshore transmission owners (OFTO) model. For offshore interconnectors, the investor can be private investors or the national TSOs for the interconnected countries.
The TSO model is dominant in most European countries developing offshore wind. Here, the responsibility for the connection of the OWF to the onshore grid falls to the national TSOs. Because the grid connection requires substantial CAPEX, this model lowers costs for OWF investors. In addition, when the TSO is responsible for the grid connection, an early and more holistic connection planning can be created, such as the offshore grid development plan (Offshore Netzentwicklungspläne, O-NEP) in Germany.
In some countries and under certain conditions, the OWF generator model is used for OWF grid connections (see section 1.3). Under this model, generators (e.g. OWF owners, including utility companies) are responsible for the financing and/or development of OWF grid connections to the shore.
Under the OFTO model, which is applied in the UK, offshore wind transmission operates under a third-party. OFTO systems function separately from the onshore transmission system, although they are regulated by the same entity (Ofgem) and paid for by the national TSO. The current UK regulatory regime, known as the Enduring Regime, provides tenders for both generator-build and OFTO-build projects. Generators decide between these two options.7
2.2 Grid connection technology
Most existing OWF are connected via single lines using HVAC technology. This solution favours wind farms close to shore, because the technology has proven to be reliable and generally lowers costs. Due to the increase in OWF capacities, distance to shore, and the number of OWFs under development, the concept of OWF clusters has emerged to facilitate connections. These cluster connections link several OWFs via a transformer station, using HVDC technology for the connection to the mainland. HVDC technology offers many advantages but requires converter stations both offshore and onshore, which significantly increases the grid connection cost. HVDC is therefore used in cases in which OWF or clusters are located far offshore. The ‘break-even’ distance to shore decreases
7 OFGEM (2011): UK’s Offshore Transmission Regime: A case study for financing a low carbon future
12
with technological advancements, leading to a corresponding decrease in cost.
2.3 OWE in the BSR
According to WindEurope, 12 per cent of Europe’s total installed capacity was located in the BSR as of 2017. The same year, a total of 405 MW was added in the region, corresponding to the commissioning of the Wikinger (Germany) and Tahkuoloto (Finland) wind farms. The North Sea Region dominates OWE development and accounts for 71 per cent of the total European offshore wind capacity (see Figure 2).8
Figure 2. Share of cumulative capacity, installations in 2017, and consented capacity per sea region.9
Most of the installed capacity in the BSR is in Denmark (880 MW) and Germany (693 MW).
Only two other BSR Member States, Sweden and Finland, have initiated offshore developments thus far. Figure 3 shows the average wind farm sizes in BSR countries with offshore wind infrastructure (only wind farms with more than 3 MW of capacity). The largest wind farms were constructed in Germany, where the average size is 230 MW, followed by Denmark, where the average is 100 MW.
8 WindEurope (2018): Offshore Wind in Europe, Key trends and statistics 2017
9 Own figure based on data from WindEurope (2018): Offshore Wind in Europe, Key trends and statistics 2017
0 10.000 20.000 30.000
Atlantic Ocean and Mediterranean Sea Irish Sea Baltic Sea North Sea
Capacity [MW]
Cumulative Capacity Installations 2017 Consented
13 Figure 3. Average national wind farm capacities in BSR countries.10
Figure 4 shows the installed capacity projections through 2030 for all BSR Member States, based on high and low development scenarios developed in the Baltic InteGrid project.11 Based on the high scenario calculated in the context of the Baltic InteGrid, the total offshore wind installed capacity could reach up to 9.5 GW by 2030.
In both high and low scenarios, installed capacity in the Baltic Sea near the German coast is expected to increase significantly in 2025 and 2030. The high scenario indicates that three new offshore wind markets could emerge by 2030 (i.e. Poland, Estonia, and Lithuania). Figure 17 and Figure 18 (Appendix A) present maps of expected offshore wind development in the BSR through 2030 based on the high and low scenarios, respectively.
More details on the assumptions and calculations for the high and low scenarios can be found in section 2 of this report (‘Methods’).
10 Ibid.
11 The Baltic InteGrid project uses a different definition of the BSR than does WindEurope. While the WindEurope definition encompasses offshore wind projects located along Denmark’s eastern coast, the Baltic InteGrid follows maritime spatial planning boundaries and thus excludes wind farms located in the Kattegat area. As a result, the offshore wind status quo capacity presented in figure 4 is lower than that reported by WindEurope for 2017 (i.e. 1.4GW and 1.8GW, respectively).
0 50 100 150 200 250
Denmark Germany Finland Sweden
Average Wind Farm Capacity [MW]
14
Figure 4. Projected offshore wind installed capacity, low and high scenarios through to 2030.12
Regarding the regulatory regimes for offshore wind connections in the BSR, the TSO model is the main grid connection regime in the Member States with the greatest offshore wind capacity (i.e. Germany and Denmark). However, even in these countries, the OWF generator model can sometimes be observed. For instance, for nearshore wind farms in Denmark, generators finance the grid connection to the shore. In Sweden and Finland, developers are responsible for the design, financing, and development of the grid connection to shore. Alternative connection models are however currently under consideration in Sweden. With regard to grid connection technology, all Baltic Sea wind farms in operation have been connected via AC lines. Germany plans to use cluster grid connections with DC technology for parts of future grid connection projects.
12 WindEurope estimates for offshore wind capacity in the BSR include wind farms located along the eastern coast of Denmark. In this report, the BSR is defined on the basis of maritime spatial planning and excludes wind farms located in the Kattegat area. Due to the variance in these definitions, the offshore wind status quo capacity shown in figure 4 is thus lower than that reported by WindEurope (1.8 GW versus 1.4GW, respectively).
0 500 1.000 1.500 2.000 2.500 3.000 3.500
Denmark Germany Sweden Finland Poland Estonia Lithuania Latvia
Projected Installed Capacity [MW]
High and Low Scenarios for the BSR
Status Quo 2025 - High 2030 - High 2025 - Low 2030 - Low
15
3. Methods
The component-specific market analyses presented below provide a brief description of the component in the context of offshore wind transmission infrastructure; forecast component-specific demand in the BSR through 2030, based on offshore wind scenarios developed for the Baltic InteGrid project; describe market characteristics, including the competitive landscape, manufacturing bottlenecks, and price trends; outline major technological trends; and identify any barriers to entry for new manufacturing entities.
Information used in this report was collected using multiple methods, which are described in this section.
3.1 Component-specific descriptions
Offshore wind transmission systems are technically complex endeavours. They often involve a large number of components at varying levels of technological maturity. This prompted the creation of a ‘technology catalogue’, which covers all of the main components needed for OWE and transmission projects. The technology catalogue was produced in the context of Work Package 3 of the Baltic InteGrid project and published as Technology Catalogue: components of wind power plants, AC collection systems, and HVDC systems.13 Its main purpose is thus to serve as a common source for the techno-economic assessments performed in the project. The component-specific descriptions presented in the following chapters are derived from this catalogue.
3.2 Baltic InteGrid offshore wind development scenarios
The Baltic InteGrid project developed scenarios estimating potential offshore wind deployment through year 2030. Existing OWE development scenarios were used as a baseline for comparison and analysis. Deployment scenarios developed by the European Wind Energy Agency (EWEA) in 2015, WindEurope in 2017, as well as the European Network of Transmission System Operators (ENTSO-E) in 2017 were considered.14 Some of these scenarios do not differentiate between North and Baltic Sea coastlines of Member States that border both seas; in these cases, capacity assumptions are based on the
historical development and actual political frameworks of the respective countries.
Baseline capacities were also compared to a project database created as part of the Baltic InteGrid project.
13 Kaushik Das and Nicolaos Antonios Cutululis, Technology catalogue: components of wind power plants, AC collection systems, and HVDC systems, DTU, prepared for the Baltic InteGrid project, Work Package 3
14 EWEA (2015): Wind energy scenarios for 2030; WindEurope (2017): Unleashing Europes Offshore Wind Energy Potential;
WindEurope (2018): WindEurope: Offshore Wind in Europe, Key trends and statistics 2017
16
The Baltic InteGrid scenarios also incorporate the offshore wind deployment forecast through to 2030 in the Case Studies developed in Work Package 4. The objective of Work Package 4 is to conduct two pre-feasibility studies for two cases involving Polish-Swedish- Lithuanian and German-Swedish interconnections to planned OWFs. For portions of the sea and Member States that are not included in the case studies, additional capacity assumptions have been made by comparing the existing scenarios, findings from a literature review, and the project database.15 Figure 5 provides an overview of the high and low scenarios for the entire Baltic Sea alongside other forecasts from industry representatives. Detailed scenarios for each BSR Member State can be found in the Appendix B (Figure 19).
Figure 5. Low and high scenarios for offshore wind development in the Baltic Sea.16
3.3 Component-specific demand calculations assumptions
The Baltic InteGrid offshore wind development scenarios were the basis for estimations of future offshore component-specific demands for HVAC and HVDC export cables, transformer stations, converter stations, and substation foundations in the Baltic Sea through to 2030. The same clustering of wind farms presented in Work Package 4 is
15 The alignment with the offshore wind development scenarios used within the Case Studies was necessary to ensure consistent results throughout the project. However, the Case Study scenarios were designed to meet other requirements and adopted a long- term meshed grid development perspective, not necessarily in line with current development scenarios.
16 EWEA (2015): Wind energy scenarios for 2030; WindEurope (2017): Unleashing Europe’s Offshore Wind Energy Potential;
WindEurope (2018): WindEurope: Offshore Wind in Europe, Key trends and statistics 2017 0
5.000 10.000 15.000 20.000 25.000 30.000
Baltic Sea - EWEA 2030 (2015)
Baltic Sea - WindEurope 2030
(2017)
Baltic Sea - ENTSO-E (2017)
Baltic Sea - Baltic InteGrid (2017)
Capacity in 2030 [MW]
EWEA/WindEurope 2030 - high EWEA/WindEurope 2030 - low ENTSO-E - Distributed Generation 2030 ENTSO-E - European Commission 2030 Baltic InteGrid 2030 - high
Baltic InteGrid 2030 - low
17
applied, using partial integration scenarios. (See Appendix C for further details on the forecasted cluster locations.)
In the case studies, the Kriegers Flak OWF is assumed to be connected to both the Danish shore and the Baltic 2 substation. For the other wind farms forecast, no clustering has been assumed through 2030 because very few to none of these wind farms are considered suitable for clustering, i.e. their installed capacity and distance to shore are limited, with large distances between farms. Radial connections are assumed for the OWFs outside Work Package 4 case study areas; Kriegers Flak is the only exception. Further details on the assumptions made in the design of the case studies of clusters can be found in Work Package 4 deliverables.
The cumulative substation rating in megavolt ampere (MVA) was calculated considering an additional ten per cent of total installed capacity to account for the potential reactive power produced in the electrical equipment between the wind turbine generator (WTG) and the transformer(s). Where the cumulative substation rating exceeded 500 MVA, two transformers were included, with the rating divided equally between them. All values for the distance to shore used in calculations were extracted from the 4C Offshore database.
When the distance to shore were less than 9 km, the wind farm was assumed to be connected via MVAC17 cables; in this case, no substation was considered.
The approximate export cable length was calculated by multiplying the estimated distance to shore by a predefined template value. The template value refers to the relationship between the distance from the centre of the wind farms to shore (extracted from 4C Offshore), using the designed cable route lengths defined in Case Study 1 of Working Package 4. The cable route design was mapped in GIS, accounting for general maritime spatial planning obstacles. The same export link voltage was assumed for all high HVAC export cables. The cross-sectional area of export cables was determined based on the amount of power transferred by the cable(s). The conductor material was assumed to be aluminium; copper could also be used, though ideally with smaller cross sections.
3.4 Semi-structured interviews and literature review
A review of relevant literature and semi-structured interviews with various industry actors were conducted to examine additional aspects, such as market characteristics (e.g.
competitive landscape, manufacturing bottlenecks, and price trends), technological trends, and high entry barriers for new companies entering the market. Four types of respondents were targeted for interviews: components manufacturers, consultancy firms, market analysts, and wind energy associations. Interviews were conducted overthe phone and in person during the WindEurope Summit 2016 in Hamburg, the Offshore Wind Energy 2017
17 MVAC cables are not included in the scope of this study.
18
in London, and the WindEurope Conference & Exhibition 2017 in Amsterdam. All findings were validated with respective experts to form an overview of component-specific market characteristics and trends. Further details on the companies interviewed during events and phone interview respondents can be found in Appendix D.
4. Overview and analysis of HVAC cables market
4.1 Component description
Of the various types of HVAC subsea cables on the market, the most prevalent are those made from cross-linked polyethylene (XLPE). High Temperature Superconducting (HTS) cables are also a mature technology, but their use in electricity highways can be limited due to the constraints of cryogenic systems.18
4.1.1 Cross-linked polyethylene cables
XLPE cables belong to the class of extruded cables, as do ethylene propylene rubber (EPR) and polyethylene (PE) cables. XLPE cables have good electrical properties, such as low dielectric loss factor, which makes it more feasible to operate at higher voltage than other kinds of material, including cables insulated with Poly Vinyl Chloride (PVC). PE is a thermoplastic material used as cable insulation, but its applications are limited by thermal constraints. Cross-linking is performed in XLPE through the process of ‘vulcanisation’ or
‘curing’. Chemical additives are introduced into the polymer in small quantities, which enable the molecular chains of the polymer to form a cross-linked lattice structure. An example of XLPE cable design is shown in Figure 6.19
Extruded insulation cables consist of many layers. Surrounding the conductors are an inner semi-conducting screen layer, the insulation compound, and an outer semi- conducting insulation screen, extruded simultaneously. Semi-conducting water swelling tape separates the outer semi-conducting screen and the metallic sheath to limit water propagation along the cable core in case of cable damage. A layer of polyethylene compound is extruded over the lead alloy-based metallic sheath. XLPE cables are used for HVAC and Medium Voltage Alternating Current (MVAC).20
18 Kaushik Das and Nicolaos Antonios Cutululis, Technology catalogue: components of wind power plants, AC collection systems and HVDC systems, p.7
19 Ibid.
20Ibid., p. 8
19 Figure 6. Example of XLPE cable design.
Source: Technology Catalogue, Baltic InteGrid.
4.1.2 High-temperature superconducting cables
Because HTS transmits power without resistance loss, utilities can increase power density by a factor of 2–8. Benefits of HTS Power Cables include its increased current-carrying capability; prevention of resistive electrical losses; use of liquid nitrogen as an environmentally benign coolant; its ability to be installed within existing conduit infrastructure; requirement of less space than conventional cables; satisfaction of the increased power requirements of existing substations; operation at high current levels with much lower losses; and requirement of less voltage transformations (reducing the cost of transformers).21
4.2 Current demand
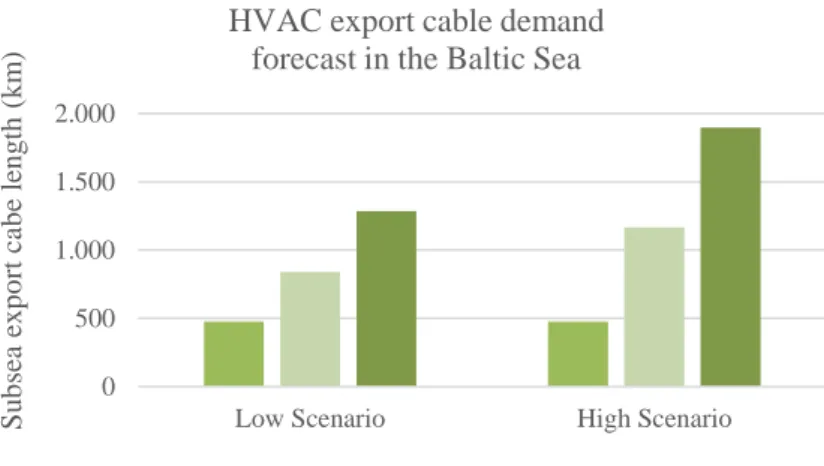
Over the last decade, there has been a steady increase in demand for both offshore and onshore HVAC transmission cables.22 Within the European offshore wind industry, 46 export cables were energised in 2016, including HVDC and HVAC subsea cables.23 The technical benefits of offshore subsea cables include high power transferability, high transmission efficiency, high reliability, competitive prices, compatibility with current infrastructure, and ability to provide offshore connections at medium to long distances.24 Figure 7 shows the demand forecast for HVAC subsea export cables in the
21 Kaushik Das and Nicolaos Antonios Cutululis, Technology catalogue: components of wind power plants, AC collection systems and HVDC systems, p. 9-10
22 Europacable. “Electricity transmission of tomorrow underground and subsea cables in Europe”. 2016.
http://www.europacable.com/books/electricity_transmission_2016_06/assets/common/downloads/Electricity%20Trans mission%20of%20Tomorrow.pdf (Accessed 11 September 2017)
23 WindEurope. “The European offshore wind industry - Key trends and statistics 2016”. Brussels. 2017
https://windeurope.org/wp-content/uploads/files/about-wind/statistics/WindEurope-Annual-Offshore-Statistics- 2016.pdf (Accessed 11 September 2017)
24 N. Helistö and V. Tai, OffshoreDC: Electricity market and power flow impact of wind power and DC grids in the Baltic Sea (Oulu: VTT Technical Research Centre of Finland, 2015).
20
Baltic Sea for the high and low scenarios developed in the context of the Baltic InteGrid project. In the high scenario, the demand for HVAC cables for offshore transmission in the Baltic Sea is expected to reach nearly 1,900 km in 2030.
Figure 7. Cumulative demand for HVAC export cables in the Baltic Sea.25
4.3 Market characteristics
The market for offshore HVAC subsea cables is mature. HVAC cables are widely used, and the technology is well understood within the onshore transmission network. To date, HVAC subsea cables have been the preferred technology for connecting OWFs to shore.
Experience with the technology has increased since the first European wind farms were installed in the early 2000s.26
4.3.1 Competitive landscape
The European market for HVAC subsea cables is dominated by three main actors:
Prysmian Group, Norddeutsche Seekabelwerke (NSW), and the NKT Group (formerly NKT Cables). Figure 8 shows the European market shares of export subsea cables in 2016, including HVAC and HVDC technology. Because most export cables installed are HVAC cables, the figure also indicates the market shares for this segment. As shown in the diagram, Prysmian Group is by far the largest supplier, with a market share of over 50 per cent. In spring 2017, NKT Cables acquired the high voltage (HV) cable segment of ABB, increasing their market share significantly; the company changed its name to NKT after the acquisition.27
25 Own figure.
26 WindEurope, The European offshore wind industry - Key trends and statistics 2016, 2017, accessed 11 September 2017, https://windeurope.org/wp-content/uploads/files/about-wind/statistics/WindEurope-Annual-Offshore-Statistics- 2016.pdf; Nicolaos Antonio Cutululis, telephone interview by Julia Sandén, 12 September 2017.
27 “Acquisition of ABB´s HV cable business”. Offshore Wind Industry Magazine, no. 01 (2017): 12 0
500 1.000 1.500 2.000
Low Scenario High Scenario
Subsea export cabe length (km)
HVAC export cable demand forecast in the Baltic Sea
Status Quo 2025 2030
21 Figure 8. Market shares for high voltage subsea cables manufactured in 2016.28
To date, the European market has been covered primarily by European suppliers.
However, with the projected growth in demand for HVAC subsea cables, new actors, mainly from Asia, are expected to enter the European market. Japanese and Korean cable manufactures have already expressed interest in entering the European market.29 The logistics costs of entering the market are unlikely to deter these companies, because these costs are relatively small relative to the total value of the subsea cable.30
According to NKT, suppliers that are competitive in the subsea cable market are highly capital-intensive and offer state-of-the-art products, significant technological know-how, and the ability to deliver turnkey solutions. Differentiators include product design and capabilities (e.g. the ability to deliver long cable lengths without joints), innovation, and offshore service offerings.31
28 WindEurope. “The European offshore wind industry - Key trends and statistics 2016”. Brussels. 2017
https://windeurope.org/wp-content/uploads/files/about-wind/statistics/WindEurope-Annual-Offshore-Statistics- 2016.pdf (Accessed on 11 September 2017)
29 Interview by Elizabeth Côté and Julia Sandén. Offshore Wind Energy 2017, London, 6–7 June 2017
30 Interview by Christoffer Bent, Julia Sandén, Christian Weiß and Steve Wendland. WindEnergy Hamburg, 27–30 September 2016
31 NTK Holding. “2015 Annual Report”. Brøndby.
http://www.nkt.dk/media/84885/2015-NKT-Annual-Report.pdf (Accessed on 11 September 2016) NKT Cables
13%
ABB 18%
NSW 17%
Prysmian 52%
22
4.3.2 Manufacturing bottlenecks
Over the last decade, European cable manufacturers have steadily expanded their production capacity to meet the increasing demand for high-voltage subsea and underground cables. From 2008 to 2011, this capacity increase raised output by approximately 40 per cent.32 Interviews with several manufacturers revealed that there are currently no major bottlenecks within the supply chain for HVAC subsea cables.
However, one limiting factor is the ability of manufacturers to plan and design for the production of upcoming subsea-cable projects. Inconsistency in order flows, as well as high rates of cancellation and delays in planned offshore wind projects, makes it difficult for the manufacturers to utilise their production capacity efficiently.33
A stable increase in demand for onshore and offshore HVAC cables is foreseen. Based on the current production capacity, some experts anticipate a shortage of HVAC cables around 2020 to 2025. The additional demand will most likely be met by an increase in production capacity from established European cable suppliers and possibly cable suppliers outside Europe.34 As demand increases, the availability of installation ships could become a concern.
4.3.3 Price trends
Although the overall demand for HVAC subsea cables has steadily increased, many European suppliers have struggled with temporary overcapacity due to a series of delays in the development of offshore wind projects in recent years. As a result, price competition has intensified and prices have decreased significantly over the past two years.35 The price of HVAC subsea cables is expected to stabilise at the current (low) level.36 Similarly, experts interviewed at the Offshore Wind Energy 2017 exhibition in London do not foresee any significant cost reduction for HVAC subsea cables within the next 10 to 15 years.37 However, for HVAC transmission there is still potential for cost reductions from a system point of view. According to the International Renewable Energy Agency (IRENA), minimising the infrastructure required to support offshore wind transmission is the most promising strategy to lower costs. This is also applicable for HVAC subsea cables.38
32 Europacable. “Electricity transmission of tomorrow underground and subsea cables in Europe”. 2016.
http://www.europacable.com/books/electricity_transmission_2016_06/assets/common/downloads/Electricity%20Trans mission%20of%20Tomorrow.pdf (Accessed on 11 September 2017)
33 Interview by Christoffer Bent, Julia Sandén, Christian Weiß and Steve Wendland. WindEnergy Hamburg, 27–30 September 2016
34 Interview by Elizabeth Côté and Julia Sandén. Offshore Wind Energy 2017, London, 6–7 June 2017
35 Hungerschausen, Peter (Senior Sales Manager at Norddeutsche Seekabelwerke GmbH). Phone interview by Julia Sandén. 4 September 2017
36 Ibid.
37 Interview by Elizabeth Côté and Julia Sandén. Offshore Wind Energy 2017, London, 6–7 June 2017
38 International Renewable Energy Agency (IRENA). “Innovation Outlook: Offshore Wind”. Abu Dhabi. 2016.
23
4.4 Technological trends
A key limitation of HVAC cables is their high electrical capacitance. Over long distances, (generally exceeding 80–100 km) the capacitive charging current is significant and reduces the cable’s ability to transmit real power.39 HVDC cables are therefore a more suitable option for long-distance transmission. However, compared to HVAC technology, an HVDC connection from OWFs to shore is riskier and more expensive. As a result, there are ongoing efforts to make HVAC subsea cables more suitable for longer offshore distances.40
Onshore, it is common to instal reactive power compensation to increase the viable distances for HVAC cables. The first reactive power compensation station installed offshore will be at Hornsea 1, the British OWF developed by the Denmark-based energy company Ørsted A/S. The wind farm will be connected to shore via three 120 km HVAC subsea cables (220 kV) in combination with a reactive power compensation station installed midway between the OWF and the shore. Ørsted A/S expects the construction of reactive power compensation to be more cost-efficient than are current HVDC systems.41
There is also a trend towards higher-voltage HVAC subsea cables, which have the benefit of reducing losses for a given power rating. The current voltage levels for HVAC subsea cables are generally 110 kV and 220 kV. Europacable expects voltage to increase to as much as 400 kV between the years 2025 and 2025, which will raise the power rating significantly.42 This development will probably result from manufacturing advances in the cleanliness of pellet production and extrusion as well as from improvements in cable design and material selection.43
http://www.irena.org/DocumentDownloads/Publications/IRENA_Innovation_Outlook_Offshore_Wind_2016.pdf (Accessed on 13 September 2017)
39 European Network of Transmission System Operators for Electricity (entso). “Offshore Transmission Technology.
Brussels”. 2011.
https://www.entsoe.eu/fileadmin/user_upload/_library/publications/entsoe/SDC/European_offshore_grid_- _Offshore_Technology_-_FINALversion.pdf (Accessed on 11 September 2017)
40 International Renewable Energy Agency (IRENA). “Innovation Outlook: Offshore Wind”. Abu Dhabi. 2016.
http://www.irena.org/DocumentDownloads/Publications/IRENA_Innovation_Outlook_Offshore_Wind_2016.pdf (Accessed on 13 September 2017)
41 Detlef Koenemann,“AC instead of DC”, Offshore Wind Industry Magazine, no. 02 (2017): 34–35; “Project One”, 4C Offshore, 2017, accessed 13 November 2017, http://www.4coffshore.com/windfarms/hornsea-project-one-united-kingdom- uk81.html.
42 Europacable. “Europacable Stellungnahme BFO: Anbindungskonzepte Standardisierte Technikvorgaben”. 2017. Access to the documents was provided by Bundesamt für Schifffahrt und Hydrographie (BSH).
43 International Renewable Energy Agency (IRENA). ”Innovation Outlook: Offshore Wind”. Abu Dhabi. 2016.
http://www.irena.org/DocumentDownloads/Publications/IRENA_Innovation_Outlook_Offshore_Wind_2016.pdf (Accessed on 13 September 2017)
24
IRENA has also identified a trend towards lower-frequency AC transmission as another development that might have an impact in the longer-term future. The benefit of this technology is reduced capacitive effects for a given power rating. To date, low-frequency transmission has only been a topic for academia.44
4.5 Barriers to entry
As noted previously, any potential need for increased production capacity for HVAC subsea cables is expected to be met by established European cable suppliers and existing cable suppliers outside Europe. It is unlikely that entirely new companies will enter the market. This is primarily due to the large upfront investment required to set up a new manufacturing facility. For a new company entering the market, this large investment may be difficult to justify.45
It has also been suggested that a new cable manufacturing facility is unlikely to be established in the BSR. The market for offshore wind in the Baltic Sea is relatively small in comparison to offshore wind markets for the North Sea and other worldwide emerging offshore wind markets. However, regional SMEs may find business opportunities in the supply chain for HVAC subsea cables, particularly in the maintenance, service, and repair segments.46
44 Ibid.
45 Interview by Elizabeth Côté and Julia Sandén. Offshore Wind Energy 2017, London, 6–7 June 2017
46 Ibid.
25
5. Overview and analysis of HVDC cables market
5.1 Component description
HVDC transmission technology is mainly applied when connecting two asynchronous networks and/or when the transport of high electrical power over long distances becomes uneconomical for HVAC transmission and greater control over power transmission is required. In subsea use, HVDC transmission is predominantly used to connect OWFs to land or transmit electricity over long distances through the sea where the use of overhead lines may not be technically or economically feasible. HVDC cables are also being used in land transmission projects to transmit a high volume of power. HVDC is a proven technology for transmission projects that interconnect asynchronous networks.47 HVDC underground cables are used to carry medium and high power (100 MW to 1,000 MW) over distances above 50 km. HVDC underground cables have been in commercial use since the 1950s. The primary types of HVDC cable technologies commercially available are mass-impregnated (MI) cables and XLPE cables. Self-contained fluid-filled cables are also becoming popular; however, they are used for very high voltage and short connections due to hydraulic limitations.48
5.1.1 Self-contained fluid-filled cables
Self-contained fluid-filled cables are paper-insulated oil-filled cables. These kinds of cables are more suitable for HVDC transmission over short distances of up to approximately 50 km. The insulation system in these cables must be under constant oil pressure. This oil pressure prevents the formation of cavities as the cable cools and the oil contracts. These kinds of cables can be used in both AC and DC operations. Examples of projects using low- pressure oil-filled cables are the interconnections between Saudi Arabia and Egypt (Aqaba Project) and the Spain-Morocco project.49
5.1.2 Mass-impregnated cables
Mass-impregnated subsea HVDC cables do not need oil-feeding and therefore have no limitation on length. Mass-impregnated cables are composed of a highly viscous impregnating material which does not cause any leakage in the event of cable damage/failure. Compared to oil-filled cables, the compact design of mass-impregnated subsea HVDC cables also allows for deep-water applications. An example using mass-
47 Kaushik Das and Nicolaos Antonios Cutululis, Technology catalogue: components of wind power plants, AC collection systems and HVDC systems, p. 11
48 Ibid.
49 Ibid.
26
impregnated subsea HVDC cables is the interconnection between Spain and Mallorca (“Cometa Project”). Although this type of cable is currently one of the most used, the use of extruded cables has risen in recent years. 50 Mass-impregnated cables have been in service for many years and are a mature technology that can be used for voltages up to ± 500 kV and 1600 A DC, which corresponds to a maximum pole-rating of 800 MW and bipole rating of 1600 MW. Conductor sizes are typically up to 2500 mm2 (with a transmission capacity of 2000 MW bipole). Further improvement in voltage and capacity can be expected in the future.51
5.1.3 Cross-linked polyethylene cables
Polymeric cables are only used in voltage-source-converter (VSC) applications that allow for a reversal of power flow with no polarity reversal. This technology has mainly been applied at voltages up to ± 200 kV (in service with a power capacity of 400 MW). However, recent projects such as European TEN-E France-Spain Interconnector (INELFE) has a voltage rating of ± 320 kV and power rating of 1000 MW per cable.52
5.2 Current demand
The European market for HVDC cables is growing due to an increased demand for long- distance transmission and interconnection between national networks.53 Within the offshore wind industry, there is also a clear trend towards increased OWF capacity and locations farther from shore. These trends underlie the increased use of HVDC transmission for connecting OWF to shore.54 Within the European offshore wind industry, 46 export cables were energised in 2016, including HVDC and HVAC subsea cables.55 Figure 9 shows the demand forecast for HVDC subsea export cables in the Baltic Sea for the high and low scenarios developed in the Baltic InteGrid project. No HVDC export cable is expected to be installed in the Baltic Sea before 2025. Moreover, the cable demand in the low scenario is larger than that in the high scenario because the case studies on which the forecast is based assume that a large cluster of OWFs will not be commissioned until 2035, which is outside the timeframe for projections in Work Package 3.
50 Ibid., pp. 11–12
51 Ibid., pp. 12–13
52 Ibid., p. 13
53 European Network of Transmission System Operators for Electricity (entso). “Offshore Transmission Technology”.
Brussels. 2011.
https://www.entsoe.eu/fileadmin/user_upload/_library/publications/entsoe/SDC/European_offshore_grid_- _Offshore_Technology_-_FINALversion.pdf (Accessed on 11 September 2017)
54 WindEurope. “The European offshore wind industry - Key trends and statistics 2016”. Brussels. 2017
https://windeurope.org/wp-content/uploads/files/about-wind/statistics/WindEurope-Annual-Offshore-Statistics- 2016.pdf (Accessed on 11 September 2017)
55 Ibid.
27 Figure 9. Cumulative demand forecast for HVDC export cables in the Baltic Sea.56
5.3 Market characteristics
The technology for HVDC subsea cables is rather mature; however, the use of DC systems for connecting OWFs to shore is still under development. HVDC subsea cables have been used for long-distance transmission and electricity exchange between asynchronous networks since the 1950s; as a result, the cable industry has gained experience with, and a comprehensive understanding of, the technology.57
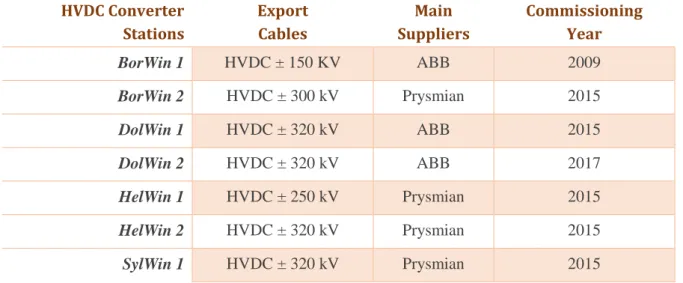
In the field of offshore wind, however, only a few wind farms have been connected to shore with HVDC transmission systems (all located in German waters).58 The limited experience and additional investment costs imply higher risks, making offshore developers hesitant to use HVDC technology. In addition, there are limited track records and experience. Indeed, apart from the Borwin 1, HVDC systems currently installed are only a few years old.59
5.3.1 Competitive landscape
Prysmian, NTK (formerly NTK Cables), and Nexans are the main HVDC subsea cable suppliers in Europe. For OWE converter stations currently operational in the German part
56 Own figure.
57 European Network of Transmission System Operators for Electricity (entso). “Offshore Transmission Technology”.
Brussels. 2011.
https://www.entsoe.eu/fileadmin/user_upload/_library/publications/entsoe/SDC/European_offshore_grid_- _Offshore_Technology_-_FINALversion.pdf (Accessed on 11 September 2017)
58 “Offshore converter database”. 4C Offshore. 2017. http://www.4coffshore.com/windfarms/converters.aspx (Accessed on 9 October 2017)
59 Interview by Elizabeth Côté and Julia Sandén. Offshore Wind Energy 2017, London, 6–7 June 2017 0
100 200 300 400 500
Low Scenario High Scenario Subsea export cabe lenght (km) HVDC export cable demand
forecast in the Baltic Sea
Status Quo 2025 2030