ATLAS-CONF-2017-075 02November2017
ATLAS LHCf CONF NOTE
ATLAS-CONF-2017-075
October 31, 2017
Measurement of contributions of di ff ractive processes to forward photon spectra in pp collisions at √
s = 13 TeV
The ATLAS and LHCf Collaborations
Abstract
This note presents a study of the contribution of proton diffractive dissociation to produc- tion of forward photons in pp collisions at
√s
=13 TeV with data recorded by the ATLAS and LHCf experiments in a joint effort. The results are based on data collected in 2015 with a corresponding integrated luminosity of 0.191 nb
−1. The data analysis is based on photon reconstruction in the LHCf-Arm1 detector, as well as on the inner tracking system of the ATLAS detector, which is used to identify diffractive events. In particular, the energy spec- trum of photons in the pseudorapidity range of 8.81< η < 8.99 or
η >10.94 is measured for events with no reconstructed charged-particle tracks with p
T >100 MeV and
|η|<2.5. The results are compared to predictions from several hadronic interaction models.
c
Copyright 2017 CERN for the benefit of the ATLAS and LHCf Collaborations.
Reproduction of this article or parts of it is allowed as specified in the CC-BY-4.0 license.
1 Introduction
Simulation of soft processes in hadronic interactions are based on phenomenological models since any perturbative calculations performed within quantum chromodynamics (QCD) fail to describe this low- energy regime. The LHCf apparatus [1] at the LHC is designed for precision measurements of neutral particles produced in the very forward direction. The primary research focus of the LHCf experiment is the validation of hadronic interaction models, which can also address some open questions arising from observations of ultra-high energy cosmic-ray events [2, 3, 4]. The LHCf collaboration recently published inclusive energy spectra of forward photons in proton–proton (pp) collisions at
√s
=13 TeV, where significant discrepancies between model predictions and data were reported [5]. One possible cause of these discrepancies is the inherent uncertainty on the modelling of diffractive processes in the respective phenomenological models.
Forward photon production in di
ffractive pp interactions and its simulation in several hadronic inter- action models has been recently studied in Ref. [6]. It was shown that there is a large variation between the predictions of the photon spectra from proton di
ffractive dissociation by di
fferent MC models, partic- ularly at large photon pseudorapidities
1,
η >10.94, whereas there is only a small variation in the inclusive photon spectra. The studies in Ref. [6] also suggest a method to separate the contributions of diffrac- tive and non-di
ffractive processes. By selecting events with no charged particles in the pseudorapidity range of
|η|<2.5, non-di
ffractive events can be rejected with high e
fficiency. Experimentally, this can be achieved by combined data-taking of the ATLAS [7] and LHCf experiments, where the inner tracking system of the ATLAS detector is used to veto central charged-particle activity.
This note presents the first joint analysis of the ATLAS and LHCf collaborations. Common data- taking of the ATLAS and LHCf experiments has been successfully performed in a dedicated low- luminosity pp run taken at
√s
=13 TeV in 2015, where events were triggered by the LHCf experi- ment. While the photon spectra are measured by the LHCf detector, the information from the ATLAS inner tracker system is used to suppress non-diffractive events. The forward photon energy spectrum is measured in two regions of photon pseudorapidity (8.81
< η <8.99 and
η >10.94), for events with no charged particles having p
T>100 MeV and
|η|<2.5. Forward photons stem dominantly from decays of forward
π0and
ηmesons. The experimental results are compared to predictions from several hadronic interaction models.
2 The LHCf and ATLAS detectors
The LHCf experiment consists of two independent detectors, called Arm1 and Arm2, installed at
±140 mfrom the ATLAS IP. This study is based on data collected by the Arm1 detector, which covers positive photon pseudorapidities. The Arm1 detector consists of two calorimeter towers. The first tower covers the pseudorapidity range of
η >10, which includes the zero-degree limit of the pp collision. The second tower covers the pseudorapidity region of 8.5
< η <9.5. The dimensions of the calorimeter towers are 20 mm
×20 mm and 40 mm
×40 mm, respectively. Each tower is composed of tungsten plates, 16 scintillator layers for shower sampling, and 4 x–y scintillator bar hodoscopes for lateral shower imaging.
The energy and position resolutions for photons are
<5% and
<200
µm, respectively.The ATLAS inner tracker consists of a silicon pixel detector (pixel) located close to the beam line and a silicon microstrip detector (SCT) surrounding the pixel detector. The transition radiation detector (TRT) is located outside the SCT. The tracker covers the full azimuthal angle and the pseudorapidity range of
|η|<2.5. It is immersed in a 2 T solenoidal magnetic field.
1A right-handed coordinate system with its origin at the nominal interaction point (IP) in the centre of the ATLAS detector and thez-axis along the beam pipe is used. Thex-axis points from the IP to the centre of the LHC ring, and they-axis points upward. The pseudorapidity is defined in terms of the polar angleθasη=- ln tan(θ/2).
3 Data set
The experimental data used in this analysis was obtained during a run taken from 22:32 to 1:30 (CEST) on June 12–13, 2015 during periods of stable pp collisions at
√s
=13 TeV. The instantaneous luminosity during the run was leveled by controlling the separation of the beams to keep the mean number of interactions per bunch crossing,
µ, around 0.01. The instantaneous luminosity during these data-takingconditions was 3–5
×10
28cm
−2s
−1. Considering that the live fraction of the LHCf data acquisition (DAQ) system [8] is about 50%
2, the total integrated luminosity of the data-set used in the analysis is L
int=0.191
±0.04 nb
−1.
The LHCf records an event when any successive three layers of the calorimeter have an energy deposit above a certain threshold. For both calorimeter towers, the trigger efficiency is estimated to increase from a few per cent for photons with 100 GeV energy to 100% for photons with energy over 200 GeV. The LHCf trigger information [1] is then passed to the trigger system of the ATLAS detector [9].
The data, recorded independently by the LHCf and ATLAS detectors for all LHCf triggered events, is then matched o
ffline using the unique ATLAS event identifier, which is also stored (event-by-event) in the corresponding LHCf data. Additionally, the time stamp and the bunch identifier of each matched event are compared between the two experiments to confirm the appropriate event matching. In total, 2.1
×10
6events were triggered by the LHCf-Arm1 detector.
4 MC simulation
Several Monte Carlo (MC) samples were produced to compare to the data and to correct the data for detector e
ffects.
The MC samples are based on the hadronic interaction models of EPOS-LHC[10], QGSJET-II- 04 [11], SYBILL 2.3 [12, 13], and PYTHIA 8.212DL [14, 15]. The EPOS-LHC, QGSJET and SYBILL models have been developed primarily to model cosmic-ray showering in the atmosphere, whereas PYTHIA 8 is commonly used in collider physics. The PYTHIA 8 sample is generated with the Monash [16]
set of tuned underlying-event parameters. In addition, the Donnachie and Landshoff (DL) model [17]
with a linear pomeron trajectory
αP(t)
=1
+∆+α0t is used to define the di
ffractive dynamics. The default values of the parameters
∆and
α0are 0.085 and 0.25 GeV
−2[18], respectively. According to the ATLAS inelastic pp cross section measurement at
√s
=13 TeV, the PYTHIA 8.212DL model with these param- eters gives the best description of the di
ffractive contibution observed with the ATLAS minimum-bias trigger scintillators [19].
The LHCf detector simulation [5] is used to estimate detector response and corrections to the fiducial measurement of the photon energy spectrum. For these purposes, 10
8and 5
×10
7events of pp inelastic interactions were generated using the QGSJET-II-04 and EPOS-LHC MC generators, respectively. These two models were selected as baseline event generators since both show relatively good agreement with the LHCf inclusive photon and
π0data at
√s
=7 TeV [20, 21]. The data and MC simulated events are passed through the same reconstruction and analysis software.
The ATLAS track reconstruction efficiency is determined using a simulation of the ATLAS detec- tor based on GEANT4 [22, 23] and PYTHIA 8 simulated events. The e
fficiency is parameterised in two-dimensional bins of p
Tand
η, and is obtained in a similar way as in Ref. [24]. For several con-trol distributions (Section 5), it was not possible to apply the full ATLAS detector simulation to the generator-level predictions. In such cases, dedicated response functions describing the track reconstruc- tion e
fficiency of the ATLAS inner tracker were applied directly to the generator-level predictions. These samples are labeled as “MC-folded” in the following.
2Defined as the ratio of the number of events recorded by LHCf over the number of triggered events, including those lost due to dead-time of the DAQ system.
5 Analysis
5.1 Analysis strategy
The goal of the analysis is to measure the energy spectrum of forward photons in the 200 GeV
<E
γ <6 TeV range, in two well-defined kinematic regions of the LHCf-Arm1 detector acceptance. Events are also classified according to the presence of at least one charged-particle track with p
T >100 MeV and
|η|<
2.5.
The resulting photon spectra are normalized to the expected number of inelastic collisions, N
inel, calculated as N
inel=L
intσinel, where
σinel =78.1
±2.9 mb is the inelastic pp cross section measured at
√
s
=13 TeV by ATLAS [19].
5.2 Fiducial region definition
The fiducial phase space of the measurement consists of two exclusive regions. Region A is defined by the photon pseudorapidity,
η >10.94, and photon azimuthal angle,
−135
◦ < φ <45
◦(denoted as
∆φ <
180
◦). Region B contains photons with 8.81
< η <8.99 and 80
◦< φ <100
◦(denoted as
∆φ <20
◦).
Events are required to contain at least one photon with an energy above 200 GeV. At the particle level, all photons produced in the proton fragmentation process (direct photons) or from subsequent decays of directly produced particles with a mean travel distance less than 140 m, are considered.
Inclusive photon energy spectra were published by LHCf [5]. In this joint ATLAS-LHCf analysis, photon energy spectra are measured for events having no primary charged particles with p
T >100 MeVand
|η|<2.5. Primary charged particles are defined as charged particles with a mean lifetime greater than 300 ps, either directly produced in pp interactions or from subsequent decays of directly produced particles with mean lifetime smaller than 30 ps. By the event selection, non-diffractive events are rejected while keeping more than 50% detection efficiency of diffractive events and a purity of more than 99%
3according to the QGSJET-II-04 model. Additionally, the selection e
fficiency of single-di
ffractive events is estimated as a function of the mass of the diffractive system, M
X. According to the QGSJET-II-04 predictions, this efficiency is more than 90% for M
X <20 GeV and decreases to 10% for M
X=100 GeV.
Therefore, mostly the low-mass di
ffractive events are expected to pass the N
track=0 requirement.
5.3 Event reconstruction
The analysis procedure used to reconstruct photons in the LHCf detector is the same as that used in Ref. [5]. The photon energy is reconstructed from the energy deposits in the LHCf calorimeters. The sum of the energy deposits in the 2nd to 13th scintillation layers is converted to the photon energy using an empirical function determined using the LHCf detector simulation. Corrections for shower leakage effects and light-yield collection efficiency are taken into account during the photon energy reconstruction process. Photon Identification (PID) is applied by using the L
90%estimator, defined as the longitudinal shower depth in units of radiation length (X
0), at which the integral of the energy deposit measured by the sampling layers in the LHCf-Arm1 detector reaches 90% of the total energy deposit. The PID selection criterion is set to L
90% <L
90%,thrwhere L
90%,thris an energy-dependent value, corresponding to photon identification e
fficiency of 90%. The hit position of the photon in the LHCf detector is reconstructed by searching for the maxima of the lateral distributions measured in the four position-sensitive layers. Multi- hit events, in which two or more x–y energy maxima are detected, are rejected in this analysis because of the poor performance of energy reconstruction in these events. The performance of the photon energy and hit position reconstruction were studied in dedicated beam tests with electron beams [25].
3Defined as the fraction of the selected events that are in the diffractive category in the model to the full set of selected events.
Charged-particle tracks in the central pseudorapidity region (|η|
<2.5) are reconstructed using the ATLAS pixel and SCT detectors. A special track reconstruction algorithm is applied and charged parti- cles with a transverse momentum down to p
T =100 MeV are measured. Each track is required to have at least one pixel hit, and the transverse impact parameter calculated with respect to the LHC beam line,
|d0|, smaller than 1.5 mm. Details of the performance of the track reconstruction in 13 TeV
pp data and simulation can be found in Ref. [26]. The estimated track reconstruction efficiency for charged pions increases from about 20-60% at p
T =100 MeV (depending on
η) to about 90% atp
T =400 MeV and becomes constant for p
T>400 MeV.
5.4 Event selection
The selected events are required to have a reconstructed photon candidate, with a minimum energy of 200 GeV, inside the region A or B.
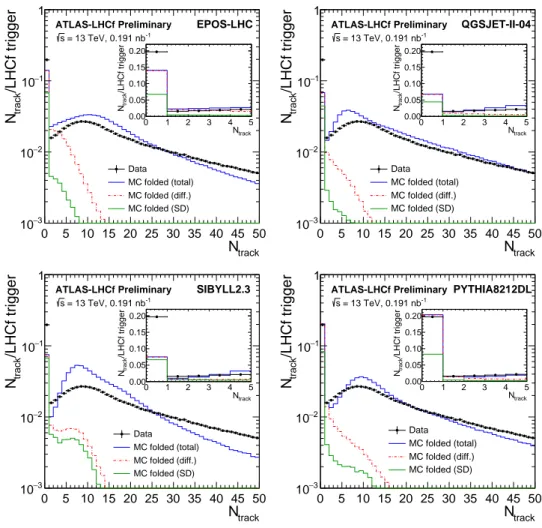
Next, selected events are classified based on the number of charged-particle tracks, N
track, recon- structed in ATLAS. Figure 1 shows the comparison of the N
trackdistribution between the data and MC models, for events in which the LHCf-Arm1 detector reconstructed a photon (region A or B). The con- tribution of non-di
ffractive events around N
track=0 is less than 2% in all models. The ratio of N
track=0 events to the total number of events is 20% in the data, whereas the same ratio predicted by the MC mod- els varies between 6% and 20% (depending on the model). Moreover, the contribution from the double di
ffractive dissociation process to N
track=0 events is relatively small for SIBYLL 2.3 and QGSJET-II-04 models, compared to EPOS-LHC and PYTHIA 8212DL.
5.5 Analysis corrections
The correction for detector effects is performed with a bin-by-bin correction procedure, based on MC simulated events, and is done separately for regions A and B. The unfolded inclusive-photon rate in the i-th energy bin, N
γall(E
iγ), is obtained as
N
γall=C
allγN
all(1
−R
bkg1)
,(1) where C
γall(E
iγ) are the correction factors related to the inclusive photon selection in LHCf, N
all(E
iγ) is the total number of selected events and R
bkg1is the small fraction of estimated background events.
By analogy, the unfolded photon spectrum for events with at least one charged particle with p
T >100 MeV and
|η|<2.5 is calculated as
N
γNch≥1 =C
trackC
Nγtrack≥1N
Ntrack≥1(1
−R
bkg2)
,(2) where C
track(E
γi) are the correction factors for the ine
fficiency of the track detection in ATLAS, and C
γNtrack≥1(E
iγ), N
Ntrack≥1(E
iγ) and R
bkg2are defined in a similar way as parameters from Eq. 1, except the extra N
track≥1 requirement.
The photon energy spectrum corresponding to events with no charged particles in the fiducial region, N
γNch=0(E
iγ), is obtained by subtracting the photon energy spectrum for events having at least one charged particle from the inclusive-photon spectrum:
N
γNch=0=N
γall−N
γNch≥1.(3)
The photon correction factors, C
γ(E
iγ), account for inefficiencies of the photon identification, the
multi-hit rejection cut e
fficiency, as well as for migration e
ffects between photon energy bins [5]. They
range between 0.8 and 1.4 in region A and between 0.7 and 1.9 in region B. They are derived using the
LHCf detector simulation.
track
N 0 5 10 15 20 25 30 35 40 45 50 /LHCf triggertrackN
−3
10
−2
10
−1
10 1
EPOS-LHC ATLAS-LHCf Preliminary
= 13 TeV, 0.191 nb-1
s
Data MC folded (total) MC folded (diff.) MC folded (SD)
track
N
0 1 2 3 4 5
/LHCf triggertrackN
0.00 0.05 0.10 0.15 0.20
track
N 0 5 10 15 20 25 30 35 40 45 50 /LHCf triggertrackN
−3
10
−2
10
−1
10 1
QGSJET-II-04 ATLAS-LHCf Preliminary
= 13 TeV, 0.191 nb-1
s
Data MC folded (total) MC folded (diff.) MC folded (SD)
track
N
0 1 2 3 4 5
/LHCf triggertrackN
0.00 0.05 0.10 0.15 0.20
track
N 0 5 10 15 20 25 30 35 40 45 50 /LHCf triggertrackN
−3
10
−2
10
−1
10 1
SIBYLL2.3 ATLAS-LHCf Preliminary
= 13 TeV, 0.191 nb-1
s
Data MC folded (total) MC folded (diff.) MC folded (SD)
track
N
0 1 2 3 4 5
/LHCf triggertrackN
0.00 0.05 0.10 0.15 0.20
track
N 0 5 10 15 20 25 30 35 40 45 50 /LHCf triggertrackN
−3
10
−2
10
−1
10 1
PYTHIA8212DL ATLAS-LHCf Preliminary
= 13 TeV, 0.191 nb-1
s
Data MC folded (total) MC folded (diff.) MC folded (SD)
track
N
0 1 2 3 4 5
/LHCf triggertrackN
0.00 0.05 0.10 0.15 0.20
Figure 1: N
trackdistribution in data compared to several MC model predictions for events in which the
LHCf-Arm1 detected a photon (in the region A or B) with E
γ >200 GeV. All distributions are normalized
to the total number of events. Black points indicate the measured spectrum and lines represent MC
predictions, folded with the tracking e
fficiency of the ATLAS detector. Blue lines indicate the inclusive
distributions, red lines the contribution from the proton diffractive dissociation events, and green lines the
contribution from the single-diffractive events. The inserts show a zoom of the data and model predictions
at small N
track. For these models only events with one particle-level photon (E
γ >200 GeV and within
the LHCf-Arm1 acceptance) are used. The LHCf simulation shows that most of the multi-photon events
are rejected by the photon selection criteria and the fraction of multi-photon events remaining as a single-
reconstructed photon relative to the total event yield is less than 2%.
The C
track(E
γi) factors are introduced to correct the photon energy spectra for events with N
ch ≥1 that fail to satisfy the detector-level N
track ≥1 requirement. The values of C
trackare obtained from the ATLAS detector simulation and are typically between 1 and 1.05.
Once the N
γNch=0and N
γalldistributions are obtained, the ratio N
γNch=0/Nγallcan be derived. Since sev- eral experimental uncertainties cancel, this allows for a more precise comparison to theoretical models.
5.6 Background estimation
The main background in the recorded data set is due to interactions between the proton beam and the residual gas in the beam pipe. This background is estimated by using events associated to non-colliding bunches at the ATLAS IP. The resulting estimates of the fraction of background, R
bkg1, in region A and B are 0.005 and 0.009, respectively, and they are found to be independent on the photon energy. Since no charged-particle tracks are detected in 90% of beam-gas background events, this background does not a
ffect the N
γNch≥1spectrum from Eq. 2.
An additional source of background is pp collision events with N
ch=0 but having N
track ≥1. This background source can be split into three categories: track migration from outside of the fiducial region of the measurement, secondary tracks produced in interactions with dead material outside of the ATLAS tracker, and decay products of long-lived particles. The contamination of N
ch=0 events due to N
track≥1 events is estimated with the ATLAS detector simulation and the estimated background fraction, R
bkg2, is below 0.006.
6 Systematic uncertainties
Systematic uncertainties affecting the photon energy spectra can be categorized according to uncertainties due to the LHCf event reconstruction and correction (C
γfactors), the normalization factor, the ATLAS tracking efficiency modeling, the impact of fake tracks, as well as the C
trackfactor modeling effects.
Details of these systematic uncertainties are discussed below:
•
LHCf event reconstruction
The estimation of the systematic uncertainties related to the reconstruction of the photon energy spectra follows the procedure described in Ref. [5].
The photon energy scale is the dominant source of systematic uncertainty in the photon energy spectrum measurement. The photon energy scale uncertainty is 3.4%, which impacts the photon energy spectrum in region A (region B) by 15% (30%) at a photon energy of around 3 TeV. A possible model dependence of the photon correction factors is estimated by comparing C
γfactors obtained using MC simulated samples based on QGSJET-II-04 and EPOS-LHC. The di
fference between these two models is taken as the systematic uncertainty.
Systematic uncertainties related to the photon reconstruction mostly cancel in the N
γNch=0/Nγallratio.
However, the correction factors C
allγand C
Nγtrack≥1depend di
fferently on the choice of the interaction model. This model uncertainty is also estimated by comparing predicted N
γNch=0/Nγallratios, based on EPOS-LHC and QGSJET-II-04 MC samples. This is a dominant source of the uncertainty for the ratio measurement, leading to relative uncertainties of 10% (20%) below 3 TeV and up to 40%
(80%) uncertainty for photons with energies above 4 TeV in region A (region B).
•
Normalization factor
The photon energy spectra are normalized to the expected number of inelastic collisions, which depends on both the integrated luminosity of the data sample and the value of the pp inelastic cross section at
√s
=13 TeV. The integrated luminosity uncertainty of 1.9% [27, 28] is already
taken into account in the inelastic cross section measurement. Therefore, the resulting uncertainty on the normalization factor is estimated to be 3.7% arising from the uncertainty on the measured inelastic cross section [19]. The normalization uncertainty cancels in the N
γNch=0/Nγallratio.
•
ATLAS track reconstruction e
fficiency
The uncertainty on the track reconstruction efficiency arises from imperfect knowledge of the passive material of the ATLAS detector. It is estimated by evaluating the track reconstruction e
fficiency using extra simulation samples with an increased amount of detector material. These material variations are motivated by dedicated studies of photon conversions, hadronic interac- tions, and track losses due to interactions with detector services [29].
The e
ffect of model-dependence of the track reconstruction e
fficiency is studied by using four dif- ferent event generators and the systematic uncertainty is estimated to be about 8% as the maximum deviation among the four samples.
•
Fake tracks
The impact of fake tracks on the final results is estimated by relaxing the track selection criteria.
The requirement on the transverse impact parameter,
|d0| <1.5 mm, is removed from the track selection, enhancing the contribution of fake tracks. A di
fference in the N
γNch=0spectrum between the nominal and d
0-relaxed track selection criteria is about 1%, which is taken as the systematic uncertainty.
As a further cross-check, the analysis is repeated with an increased p
Tthreshold ( p
T >400 MeV) in the track selection. The results are compatible with nominal values and no systematic uncer- tainty is assigned.
•
Track correction factor
The systematic uncertainty on C
trackis estimated by taking the maximum deviation between the values derived with the EPOS-LHC MC sample and the values predicted by other MC models. The estimated uncertainty on the track correction factor is 5% and 3% for region A and B, respectively.
7 Results
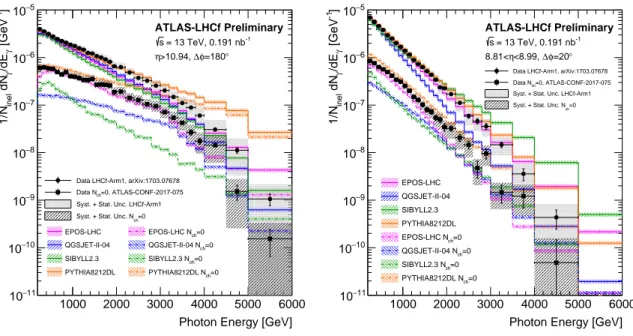
The forward photon energy spectra measured by the LHCf-Arm1 detector are shown in Fig. 2, separately for region A (η > 10.94,
∆φ <180
◦) and region B (8.81
< η <8.99,
∆φ <20
◦), and both for the N
ch- inclusive and N
ch=0 regions. In region A, the N
γNch=0photon energy spectrum observed in data is much harder than the inclusive-photon spectrum at the photon energies below 3 TeV, whereas the N
γNch=0and inclusive photon spectra have similar slope in region B.
The results are also compared to several model predictions
4. The PYTHIA 8.212DL model shows good agreement with data up to E
γ =2 TeV, in both the inclusive and N
ch =0 regions. However, PYTHIA 8 predicts a significantly harder photon spectrum in the high-energy region. The EPOS-LHC model shows generally good agreement with data for all photon energies in the N
ch=0 region. QGSJET- II-04 shows good agreement with data at the photon energies above 3 TeV, whereas it predicts lower photon fluxes at the lower photon energies. SIBYLL 2.3 predict significantly lower photon fluxes in the N
ch=0 region.
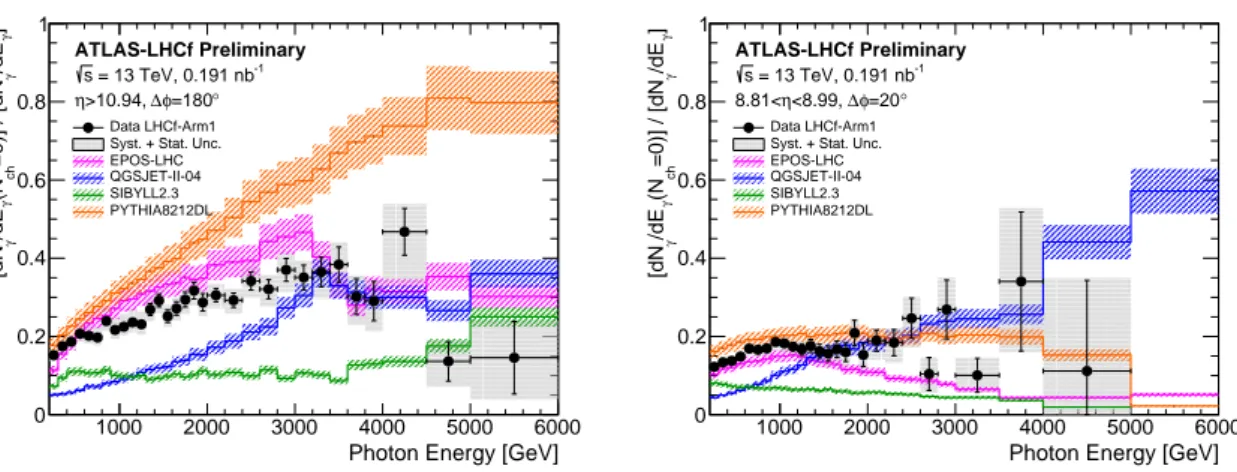
Figure 3 shows the ratio of the N
γNch=0photon spectrum to the inclusive-photon spectrum. In the region A, the ratio observed in data increases from 0.15 up to around 0.4 with increasing photon energy
4All MC predictions include an extra 10% uncertainty related to the contribution from photons produced in long-lived particle decays (with the mean lifetime above 33 ps), which is currently not taken into account in the calculation of model predictions.
Photon Energy [GeV]
1000 2000 3000 4000 5000 6000 ]-1 [GeVγ/dEγ dNinel1/N
−11
10
−10
10
−9
10
−8
10
−7
10
−6
10
−5
10
ATLAS-LHCf Preliminary = 13 TeV, 0.191 nb-1
s
° φ=180
∆
>10.94, η
Data LHCf-Arm1, arXiv:1703.07678
=0, ATLAS-CONF-2017-075 Data Nch
Syst. + Stat. Unc. LHCf-Arm1 ch=0 Syst. + Stat. Unc. N
EPOS-LHC QGSJET-II-04 SIBYLL2.3 PYTHIA8212DL
ch=0 EPOS-LHC N
ch=0 QGSJET-II-04 N
ch=0 SIBYLL2.3 N
ch=0 PYTHIA8212DL N
Photon Energy [GeV]
1000 2000 3000 4000 5000 6000 ]-1 [GeVγ/dEγ dNinel1/N
−11
10
−10
10
−9
10
−8
10
−7
10
−6
10
−5
10
ATLAS-LHCf Preliminary = 13 TeV, 0.191 nb-1
s
° φ=20
∆
<8.99, η 8.81<
Data LHCf-Arm1, arXiv:1703.07678
=0, ATLAS-CONF-2017-075 Data Nch
Syst. + Stat. Unc. LHCf-Arm1
ch=0 Syst. + Stat. Unc. N
EPOS-LHC QGSJET-II-04 SIBYLL2.3 PYTHIA8212DL
ch=0 EPOS-LHC N
ch=0 QGSJET-II-04 N
ch=0 SIBYLL2.3 N
ch=0 PYTHIA8212DL N
Figure 2: Forward photon energy spectra measured by the LHCf-Arm1 detector in the regions A (left) and B (right). Filled circles show the inclusive-photon spectra measured in Ref. [5]. Filled squares indicate the spectra for N
ch=0 events, where no extra charged particles with p
T>100 MeV and
|η|<2.5 are present. Vertical bars represent statistical uncertainties of the data sample, while gray bands indicate the quadratic sum of statistical and systematic uncertainties. Colored lines indicate model predictions with (dashed lines) and without (solid lines) the N
ch=0 requirement. Hatched areas around the model lines indicate the 10% uncertainty related to the contribution from photons produced in long-lived particle decays (with the mean lifetime above 33 ps), which is currently not taken into account in the calculation of model predictions.
up to around 4 TeV and decreases to 0.15 again at the highest energy. This increase tendency is also observed for all model predictions, except SIBYLL 2.3. The PYTHIA 8 and SIBYLL 2.3 models predict higher and lower fraction of N
ch =0 events, respectively. This suggests that PYTHIA 8 (SIBYLL 2.3) predicts a too large (too small) contribution of low-mass diffractive events to the forward photon energy spectrum. In region B, the ratio in data is around 0.15 and is approximately constant over a wide range of photon energies. The SIBYLL 2.3 model predicts an average value of the ratio that is much lower than observed in data. QGSJET-II-04 predicts lower ratio at photon energies below 1.5 TeV. The EPOS-LHC and PYTHIA 8.212DL generators show reasonable agreement with data.
8 Summary
This note presents the first joint analysis of the ATLAS and LHCf collaborations, based on 0.191 nb
−1of pp collision data recorded at
√s
=13 TeV. In order to study the contribution of low-mass di
ffractive processes to the forward photon production, the event selection relies on the veto of charged-particle tracks in the ATLAS inner tracker. The photon energy spectra are measured in two pseudorapidity ranges,
η >10.94 or 8.81
< η <8.99, for events with no extra charged particles having p
T >100 MeV and
|η|<2.5. The photon spectra for N
ch =0 events are compared to the inclusive photon spectra, to allow for a comparison of non-diffractive and diffractive particle production processes.
The ratio between the N
γNch=0and inclusive photon spectra increases from 0.15 to 0.4 with increasing
Photon Energy [GeV]
1000 2000 3000 4000 5000 6000
] γ/dEγ=0)] / [dN ch(Nγ/dEγ[dN
0 0.2 0.4 0.6 0.8 1
ATLAS-LHCf Preliminary = 13 TeV, 0.191 nb-1
s
° φ=180
∆
>10.94, η
Data LHCf-Arm1 Syst. + Stat. Unc.
EPOS-LHC QGSJET-II-04 SIBYLL2.3 PYTHIA8212DL
Photon Energy [GeV]
1000 2000 3000 4000 5000 6000
] γ/dEγ=0)] / [dN ch(Nγ/dEγ[dN
0 0.2 0.4 0.6 0.8 1
ATLAS-LHCf Preliminary = 13 TeV, 0.191 nb-1
s
° φ=20
∆
<8.99, η 8.81<
Data LHCf-Arm1 Syst. + Stat. Unc.
EPOS-LHC QGSJET-II-04 SIBYLL2.3 PYTHIA8212DL
Figure 3: Ratio of the photon energy spectrum with an extra N
ch=0 requirement to the inclusive-photon energy spectrum for regions A (left) and B (right). Vertical bars represent statistical uncertainties of the data sample, while gray bands indicate the quadratic sum of statistical and systematic uncertainties. Col- ored lines indicate model predictions. Hatched areas around the model lines indicate the 10% uncertainty related to the contribution from photons produced in long-lived particle decays, which is currently not taken into account in the calculation of model predictions.
photon energy up to 4 TeV at
η >10.94, whereas it is found to be relatively constant (around 0.15) at
8.81
< η <8.99. The results are compared to predictions based on several hadronic interaction models:
EPOS-LHC, QGSJET-II-04, SYBILL 2.3, and PYTHIA 8.212DL. Predictions from EPOS-LHC gener- ally show best agreement with data. At photon energies above 2 TeV, the PYTHIA 8 predicts significantly higher ratio than observed in data. This indicates that the large discrepancy between PYTHIA 8 and data in the high-energy photon region reported in Ref. [5] can be due to overestimation of the diffractive dis- sociation process in PYTHIA 8. The QGSJET-II-04 and SYBILL 2.3 models predict an average value of the ratio that is much lower than observed in data in both
η >10.94 and 8.81
< η <8.99 regions. This suggests that QGSJET-II-04 and SYBILL 2.3 predict a too small contribution of low-mass diffractive events to the forward photon energy spectrum.
References
[1] LHCf Collaboration, Technical design report of the LHCf experiment: Measurement of photons and neutral pions in the very forward region of LHC, CERN-LHCC-2006-004 (2006).
https://cds.cern.ch/record/926196.
[2] Pierre Auger Collaboration, A. Aab et al., Depth of maximum of air-shower profiles at the Pierre Auger Observatory. I. Measurements at energies above 10
17.8eV, Phys. Rev.
D90no. 12, (2014) 122005, arXiv:1409.4809 [astro-ph.HE].
[3] Pierre Auger Collaboration, A. Aab et al., Muons in air showers at the Pierre Auger Observatory:
Measurement of atmospheric production depth, Phys. Rev.
D90no. 1, (2014) 012012, arXiv:1407.5919 [hep-ex].
[4] Telescope Array Collaboration, R. U. Abbasi et al., Study of Ultra-High Energy Cosmic Ray
composition using Telescope Array’s Middle Drum detector and surface array in hybrid mode,
Astropart. Phys.
64(2015) 49–62, arXiv:1408.1726 [astro-ph.HE].
[5] LHCf Collaboration, Measurement of forward photon-energy spectra for
√s
=13 TeV proton-proton collisions with the LHCf detector, arXiv:1703.07678 [hep-ex].
[6] Q.-D. Zhou, Y. Itow, H. Menjo, and T. Sako, Monte Carlo study of particle production in di
ffractive proton–proton collisions at
√s
=13 TeV with the very forward detector combined with central information, Eur. Phys. J.
C77no. 4, (2017) 212, arXiv:1611.07483 [hep-ex].
[7] ATLAS Collaboration, The ATLAS Experiment at the CERN Large Hadron Collider, JINST
3(2008) S08003.
[8] LHCf Collaboration, LHCf Detector Performance during the 2009-2010 Lhc Run, Int. J. Mod.
Phys. A
28(2013) 1330036.
[9] ATLAS Collaboration, ATLAS Collaboration, Performance of the ATLAS Trigger System in 2015, Eur. Phys. J. C
77no. 5, (2017) 317, arXiv:1611.09661 [hep-ex].
[10] T. Pierog, I. Karpenko, J. M. Katzy, E. Yatsenko, and K. Werner, EPOS LHC: Test of collective hadronization with data measured at the CERN Large Hadron Collider, Phys. Rev.
C92no. 3, (2015) 034906, arXiv:1306.0121 [hep-ph].
[11] S. Ostapchenko, Monte Carlo treatment of hadronic interactions in enhanced Pomeron scheme: I.
QGSJET-II model, Phys. Rev.
D83(2011) 014018, arXiv:1010.1869 [hep-ph].
[12] E.-J. Ahn, R. Engel, T. K. Gaisser, P. Lipari, and T. Stanev, Cosmic ray interaction event generator SIBYLL 2.1, Phys. Rev.
D80(2009) 094003, arXiv:0906.4113 [hep-ph].
[13] F. Riehn, R. Engel, A. Fedynitch, T. K. Gaisser, and T. Stanev, A new version of the event generator Sibyll, PoS
ICRC2015(2016) 558, arXiv:1510.00568 [hep-ph].
[14] T. Sjostrand, S. Mrenna, and P. Z. Skands, PYTHIA 6.4 Physics and Manual, JHEP
05(2006) 026, arXiv:hep-ph/0603175 [hep-ph].
[15] T. Sjostrand, S. Mrenna, and P. Z. Skands, A Brief Introduction to PYTHIA 8.1, Comput. Phys.
Commun.
178(2008) 852–867, arXiv:0710.3820 [hep-ph].
[16] P. Skands, S. Carrazza, and J. Rojo, Tuning PYTHIA 8.1: the Monash 2013 Tune, Eur. Phys. J.
C74
no. 8, (2014) 3024, arXiv:1404.5630 [hep-ph].
[17] A. Donnachie and P. V. Landshoff, Elastic Scattering and Di
ffraction Dissociation, Nucl. Phys.
B244
(1984) 322.
[18] H. Jung, Hard di
ffractive scattering in high-energy e p collisions and the Monte Carlo generator RAPGAP, Comput. Phys. Commun.
86(1995) 147–161.
[19] ATLAS Collaboration, Measurement of the Inelastic Proton-Proton Cross Section at
√s
=13TeV with the ATLAS Detector at the LHC, Phys. Rev. Lett.
117no. 18, (2016) 182002,
arXiv:1606.02625 [hep-ex].
[20] LHCf Collaboration, Measurement of zero degree single photon energy spectra for
√s
=7 TeV proton-proton collisions at LHC, Phys. Lett. B
703(2011) 128–134.
[21] LHCf Collaboration, Measurements of longitudinal and transverse momentum distributions for
neutral pions in the forward-rapidity region with the LHCf detector, PRD
94no. 3, (2016) 032007.
[22] GEANT4 Collaboration, S. Agostinelli et al., GEANT4: A simulation toolkit, Nucl. Instrum. Meth.
A
506(2003) 250.
[23] ATLAS Collaboration, The ATLAS Simulation Infrastructure, Eur. Phys. J. C
70(2010) 823, arXiv:1005.4568 [physics.ins-det].
[24] ATLAS Collaboration, Charged-particle distributions at low transverse momentum in
√s
=13 TeV pp interactions measured with the ATLAS detector at the LHC, Eur. Phys. J.
C76no. 9, (2016) 502, arXiv:1606.01133 [hep-ex].
[25] Y. Makino et al., Performance study for the photon measurements of the upgraded LHCf calorimeters with Gd
2SiO
5(GSO) scintillators, Journal of Instrumentation
12(2017) P03023.
[26] ATLAS Collaboration, Track Reconstruction Performance of the ATLAS Inner Detector at
√