An Approach to quantify the Costs of Business Process Intelligence
Bela Mutschler, Johannes Bumiller DaimlerChrysler AG, Corporate Research
P.O. Box 2360, 89013 Ulm, Germany
{bela.mutschler;johannes.bumiller}@daimlerchrysler.com Manfred Reichert
University of Twente Information Systems Group 7500 AE Enschede, The Netherlands
m.u.reichert@cs.utwente.nl
Abstract: Today, enterprises are forced to continuously optimize their business as well as service processes. In this context the process-centered alignment of information sys- tems is crucial. The use of business process intelligence (BPI) tools offers promising perspectives in this respect. However, when using BPI tools one has not only to look at potential benefits but at costs as well. Therefore, most enterprises thinking about the purchase of a BPI solution demand for a business case systematically outlining an investment’s benefits and costs. This paper summarizes such a business case based on an evaluation of contemporary BPI tools and practical experiences. We present basic BPI concepts, describe BPI benefits and cost drivers and introduce two cost models to gain insights into BPI economics.
1 Introduction
Nowadays innovative products and services have to be developed under high cost pressure and time restrictions. This requires new types of dynamic collaboration scenarios within and between enterprises. Changes, either driven by internal or external factors [MRB05b], force business units to quickly adapt process-oriented information systems [LK04]. In this context, the process-oriented alignment of information systems (e.g., enterprise resource planning systems) is success-critical. However, such an alignment causes high mainte- nance costs. Business processes are complex, rigid and adopting them to changed needs typically affects many people. Information systems are inflexible as well and very often implemented with the process logic ”hard-wired” in the application code.
Business process intelligence (BPI) tools offer promising perspectives in this context. BPI applies business intelligence concepts (e.g., analytical applications) to business processes [GCC+04]. It is based on the analysis of process execution data and on the automatic derivation of (optimized) process models and process performance characteristics from
these data. It is implemented as a set of integrated tools providing features for the analy- sis, mining, prediction, control, and optimization of processes. The overall goal of BPI is to extend an enterprise’s performance management [Hof99] to business processes. Enter- prises more and more realize that gaining knowledge about their processes results in many benefits, justifying the high costs arising from the introduction of BPI solutions. In fact, BPI tools offer several benefits. For example, business processes can be monitored during their execution, process optimization potentials can be derived in (nearly) real-time, and process information can be visualized in an aggregated form for different user groups (e.g., using dashboards). Besides, the use of BPI tools also causes high costs. Therefore, it is important (and often requested in practice) to prove the added value of such tools.
The quantification of benefits and costs of BPI tools is a complex task in practice. Costs cannot be clearly associated to single cost factors, benefits are difficult to evaluate, and risks are not conceivable. Nevertheless, most enterprises demand for business cases sys- tematically outlining positive and negative impacts of an investment [Rei02]. In this paper we develop such a business case for BPI analysing the benefits and costs related to it. Risks of using BPI (e.g., the availability of a critical mass of process data) are out of the scope of this paper and therefore not further analysed here.
Our work is part of a project currently conducted at DaimlerChrysler. The overall objec- tive is to systematically identify and estimate the factors that influence the costs, benefits, and risks of advanced process technologies. Respective technologies particularly cope with business process integration and management issues [MRB05a]. In this project, we accomplish case studies, surveys, experiments, and tool comparisons to analyse relevant factors and their impact on costs, benefits and risks.
Section 2 introduces a reference architecture for BPI approaches. Section 3 describes po- tential benefits, resulting from the application of BPI concepts. As benefits are always opposed by costs, Section 4 introduces two BPI specific cost models. The first one de- scribes an approach to determine the total costs of ownership of BPI investments. The second cost model quantifies the positive impact of BPI on software development projects.
The paper concludes with a summary and an outlook.
2 Business Process Intelligence
This section sketches basic BPI concepts at a glance. Firstly, we illustrate differences be- tween BPI and related concepts. Business activity monitoring and process performance monitoring are terms basically addressing the same topic, i.e., the real-time monitoring and analysis of business processes (neglecting the systematic derivation of process opti- mizations). By contrast, corporate performance management [MWK04] is rather a holistic approach to harmonize enterprise goals and business processes through IT-based planning, monitoring and controlling efforts.
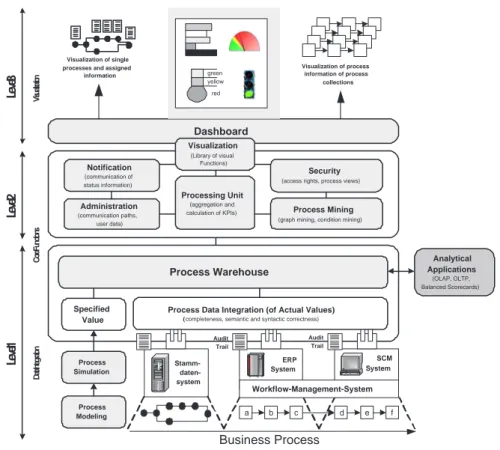
Before we consider factors determining costs and benefits of BPI approaches, we illustrate basic BPI concepts by means of a conceptual reference architecture. This architecture comprises three major levels (cf. Fig. 1).
Level 1 is responsible for the extraction of process execution data from the information systems supporting (fragments of) the monitored business processes. Typically, the im- plementation of a particular business process is scattered over heterogeneous information systems each of them using a different representation for process log files. While some information system provide event-based execution logs (audit trails) with detailed infor- mation [zM04], others maintain only simple process logs. Therefore, the syntactical and semantic integration of these log data is a challenging task. In practice, very often mes- sage brokers and ”extract transform load” (ETL) modules (known from data warehousing) are used for this purpose. Furthermore, a central repository (process warehouse) stores collected control and application data generated during real process executions. Besides, estimated reference values (e.g., derived from process simulations) can be stored in the process warehouse as well to allow for delta analyses (i.e., the comparison of estimated reference and real process data).
Dashboard
Data IntegrationCore Functions
Analytical Applications
(OLAP, OLTP, Balanced Scorecards)
Process Modeling Process Simulation
Processing Unit
(aggregation and calculation of KPIs)
Visualization
(Library of visual Functions)
Administration
(communication paths, user data)
Security
(access rights, process views)
Notification
(communication of status information)
Process Mining
(graph mining, condition mining)
Process Warehouse
Process Data Integration (of Actual Values)
( completeness, semantic and syntactic correctness)
Specified Value
Level 1Level 2Level 3 Visualization
Visualization of single processes and assigned
information
Visualization of process information of process
collections green
yellow red
Stamm- daten- system
ERP System
SCM System
Business Process
a b c d e f
Workflow-Management-System
Audit Trail
Audit Trail
Figure 1: BPI Reference Architecture.
Level 2 of our reference architecture (cf. Fig. 1) implements BPI core functions. In order to measure and evaluate process performance, the processing unit aggregates and calcu- lates key performance indicators (KPI) (e.g., process cycle time or number of processes
completed within a given period of time) based on the data provided by the process ware- house. In order to be able to quickly react to critical process events (e.g., lack of resources needed to complete a process step) the notification component provides functions to send messages to relevant persons (e.g., the process administrator). To deal with confidential data, a security component provides functions to control the access on (aggregated) pro- cess data (e.g., through generated process views). Similar issues are known from data warehousing [HW05]. The process mining component is responsible for the automated derivation of (optimized) process models from logged execution data [vdAW04]. For this it provides algorithms and tools. Thereby, the correct induction of process models depends on the completeness and quality of available process log data. Finally, the administration component provides typical support functions (e.g., for the management of user data).
Level 3 (cf. Fig. 1) is responsible for the visualization of processes and aggregated pro- cess information (i.e., information about a collection of process instances) [Lof02]. The visualization component is providing a library of presentation elements (e.g., traffic lights or bar charts) for the design of user-specific presentation forms (dashboards).
The reference architecture can be applied using contemporary BPI tools. Examples of such tools include Websphere Business Integration Monitor [IBM03], ARIS Process Per- formance Manager [Sch04] and BizTalk Server Business Activity Monitoring Framework [Mic04]. All of them assume the availability of event-based process execution data (e.g., related to the start and completion of process activities, or resources needed by a process activity). Contemporary BPI tools however do not cover all aspects of the described archi- tecture (e.g., data integration). Therefore, other software tools (e.g., message broker) have to be taken into account.
Process instances may produce a mass of data that has to be collected, stored and analysed in real-time. Processing that data must not negatively affect the performance of the oper- ational systems. Another challenge arises from the use of adaptive process management technology [RRD04]. Here, the increasing number of varying process instances is directly correlated with an increasing amount of process execution data (e.g., information about the type, reason or frequency of process changes). It is not yet clear how such data is used.
Independently of the number and maturity of features provided by a specific BPI tool, most enterprises that want to invest into such a tool demand for a business case systematically outlining the investment’s benefits and costs. As a first step towards such a business case, BPI benefits are presented in the following.
3 BPI Benefits
Enterprises are aiming at continuous optimizations of their business processes. An impor- tant factor in this context is the availability of adequate metrics. In 1983 DeMarco stated:
”You can’t manage what you can’t control, and you can’t control what you can’t measure”
[DeM83]. This also applies for business processes. In order to effectively manage them, process logic has to be explicitly defined at build-time and process instances have to be flexibly controlled during run-time (e.g. using process management systems). Comput-
erized business process support provides the basis for process performance measurement (e.g., using appropriate process metrics). As BPI is build upon measurable process at- tributes, thus it is based on a foundation of real process execution data, it offers interesting perspectives in this respect.
Examples of quantifiable process data used by BPI tools are:
• Process Time:
– start and completion times of processes/process activities – average duration to complete a process/process activity – waiting and idle times of processes/process activities
• Process Resources:
– resources needed to execute processes/process activities (e.g., actors) – input and output data to execute processes/process activities – size of work queues of resources
• Process Quality:
– percentage of failed processes/process activities – percentage of successful processes/process activities
– percentage of processes/process activities missing a defined quality of service
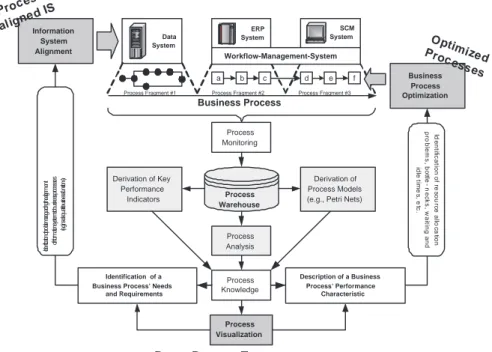
BPI tools utilize respective metrics to derive (aggregated) process information and to gen- erate status reports. In the following we introduce three use cases for BPI and discuss the benefits arising in this context (cf. Fig. 2):
• Use Case 1: Information System Alignment. BPI can be used to support the development and maintenance of process-oriented information systems. In particular, it provides valuable information (e.g., about the adequacy of provided business functions [Kat04]) for aligning the information systems to the business processes. The use of BPI tools can decrease soft- ware development costs. In particular, Section 4.2 illustrates this economic impact using an algorithmic cost model.
• Use Case 2: Business Process Optimization. BPI can be used to identify ”critical” scenarios that may occur during the execution of a business process (e.g., non-availability of resources, unnecessary waiting and idle times). Process mining as an important BPI concept (cf. Section 2.1) allows for the continuous derivation of optimized process models. This, in turn, reduces the total effort necessary for ”manual” process analyses. As optimizations are based on real data, their implementation tend to be much more effective than other approaches (e.g., the disclosure of optimization potentials by process simulation based on estimated data).
• Use Case 3: Process Transparency/Visualization of Process Information: Due to the frag- mented support of business processes, their control is distributed over several operational systems, i.e., we cannot always assure that controlled execution by one control system (e.g., process management system) is possible. Nevertheless, when collecting the respective log
data from the different systems, it becomes possible to provide monitoring and visualization support for the overall business process. The information to be visualized include complete process schemas and process instances (e.g., control and data flows, activity states) as well as other process-related data (e.g., application data). Most BPI tools include features to vi- sualize processes and related aspects. ARIS PPM, for example, offers a detailed tree view to illustrate the hierarchical relationships between processes and sub processes. Particularly the analysis of entire process maps becomes easier using such or comparable features.
Process Fragment #1 Process Fragment #2 Process Fragment #3 Data
System
ERP System
SCM System
Business Process
a b c d e f
Workflow-Management-System
Derivation of Key Performance
Indicators
Derivation of Process Models (e.g., Petri Nets)
Process Analysis Process Monitoring
Process Warehouse
Process Knowledge Information
System Alignment
Business Process Optimization
Description of a Business Process’ Performance
Characteristic Identification of a
Business Process’ Needs and Requirements
Process Visualization
Process- aligned IS
Optim Proc ized
esses
Better Process Transparency
Identification of resource allocation
problems, bottle- necks, waiting andidle times, etc.
Identification of problems regarding the alignment of information systems to business processes (e.g., inadequate business functions)
Figure 2: Realization of BPI Benefits.
However, contemporary visualization modules of BPI tools still lack some important issues:
visualization of processes running on different platforms as well as features to customize process visualizations [BRB05]. Regarding the latter, for example, it is an objective to better adjust the process information to be visualized for different purposes. Process views, for example, target at providing either context-aware (e.g., visualization of control flow) or user- aware (e.g., high-level aggregated process data for managers) process information. Providing such advanced visualization features will further increase the advantages of this use case.
In summary, the visualization and monitoring of distributed processes is a complex, though quite useful BPI use case.
Besides the benefits offered by these three use cases, other promising perspectives arise from the use of BPI tools:
• Real-time Enterprise: The ability of organizations to process available enterprise data as fast
as possible is more and more considered to be success-critical [SA03, MW04]. BPI tools are (partially) able to provide and process information in real-time and therefore enable faster reactions to internal or external events (e.g., responses to critical situations).
• On-demand Planning: BPI tools do not only enable the continuous monitoring and control of business processes and their performance, but of the supporting information systems and their effectiveness as well. Thus, performance problems (e.g., process deadlocks or resource allocation problems) can be identified and solved earlier.
• Reduced Planning Risks: As the output of business processes (e.g., of production processes) can be predicted more precisely using BPI tools, planning risks can be reduced (e.g., regarding sales and distribution efforts).
• Effective Guidance of IT and Business Investments: BPI tools can support enterprise invest- ment decisions as they help to identify bottlenecks that can only be corrected making addi- tional purchases of software, hardware or expertise.
• Better understanding of Critical Success Factors: Analysing the execution of business pro- cesses and the alignment of supporting information systems, BPI tools can help to gain knowl- edge about success factors and problems of an organization’s IT infrastructure.
BPI tools support a broad spectrum of use cases. However, the success of BPI tools in practice is not yet conceivable, though there is a growing interest of both vendors and customers for the topic. Another important element of economic-driven reflections is an investment’s cost structure. Costs have to be justified by an investment’s expected benefits.
To be able to balance costs and benefits, cost drivers of respective investment have to be identified and incorporated in a suitable cost model. Therefore, the next section deals with costs related to the use of BPI.
4 BPI Costs
This section focuses on the analysis of costs related to the use of BPI. We distinguish between two different cost scenarios:
1. Cost Model 1: BPI Total Cost of Ownership. Section 4.1 presents a cost model to quantify the total costs of ownership (TCO) of BPI investments. BPI cost drivers are described and incorporated in an overall cost model.
2. Cost Model 2: Impact of BPI on Software Development Efforts. Section 4.2 does not present a cost model for BPI itself. Instead, it sketches the idea of a cost model to quantify the impacts of BPI on software development efforts. To estimate such efforts, various approaches are proposed in the literature [Boe81]: algorithmic cost models, expert judgements, estimations by analogy, and pricing-to-win. We decided to extend algorithmic cost models to take into account the impact of BPI on software development. Using algorithmic cost models seems reasonable as they represent the most systematic, although not necessarily the most accurate approach for software cost estimation.
4.1 BPI Total Costs of Ownership
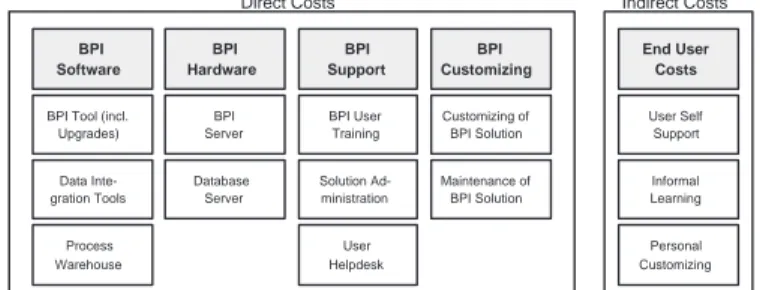
Analysing the total costs of ownership of BPI investments, we distinguish between direct and indirect costs (cf. Fig. 3). While direct costs (cf. Section 4.1.1) can be typically quantified comparatively easy, this is difficult to achieve for indirect costs (cf. Section 4.1.2). However, both direct and indirect costs of BPI investments are analysed in more detail in the following.
Indirect Costs Direct Costs
End User Costs
User Self Support
Informal Learning
Personal Customizing BPI
Software
BPI Tool (incl.
Upgrades)
Data Inte- gration Tools
Process Warehouse
BPI Hardware
BPI Server
Database Server
BPI User Training
Solution Ad- ministration
User Helpdesk
BPI Support
BPI Customizing
Customizing of BPI Solution
Maintenance of BPI Solution
Figure 3: Overview: Cost Driver that quantify BPI Investments.
4.1.1 Direct Costs
Regarding direct costs of BPI investments, four major cost categories (each of them uni- fying additional cost drivers) can be identified: BPI software, BPI hardware, BPI support, and BPI customizing. All cost categories are illustrated in more detail in the following:
• Cost Category 1 (BPI Software: BPI software is the dominant cost factor regarding BPI investments. We distinguish three cost drivers within this area:
– Cost Driver 1-a (BPI Tools): BPI tools (cf. Section 2) are the basic fundament of every BPI solution. Therefore, they constitute a major cost driver for every BPI solution. De- pending on the organization’s requirements, it may be necessary to purchase additional tools covering specific BPI aspects.
– Cost Driver 1-b (Data Integration Tools): BPI tools assume the availability of event- driven process execution data. As business processes typically span several information systems, the requested data is fragmented. This, in turn, causes additional costs for integrating both the information systems into the BPI solution and for integrating the process data into the process warehouse. While the former requires the cost-intense implementation of customized adapters, the latter requires investments in specialized data integration and middleware tools.
– Cost Driver 1-c (Process Warehouse): The storage of process execution data causes additional costs. The process warehouse has to be realized on top of a database man- agement system. ARIS PPM, for example, is using an Oracle database to realize the process warehouse.
• Cost Category 2 (BPI Hardware): Introducing BPI yields costs for additional hardware as well. We distinguish two cost drivers:
– Cost Driver 2-a (BPI Server): BPI tools are typically executed on dedicated BPI servers that have to fullfil advanced performance requirements. IBM’s WBI Monitor, for ex- ample, requires an IBM eServer zSeries 900 or S/390 system if used in conjunction with OS/390 or z/OS.
– Cost Driver 2-b (Database Server): Many BPI tools rely on advanced database technol- ogy to realize the process warehouse. Advanced database technology requires capable hardware components too.
• Cost Category 3 (BPI Support): Purchasing BPI software and hardware is only the first step. As any other IT-based solution, additional costs are caused. We distinguish three cost drivers within this area:
– Cost Driver 3-a (BPI User Training): Software developers, process analysts, IT man- agers and any other personnel using a BPI solution have to be trained in using the BPI solution. This is necassary to bring the amount of available BPI functionality to full evolvement.
– Cost Driver 3-b (Solution Administration): The administration of a BPI environment (through dedicated BPI administrators) implies costs as well. For example, updates have to be installed periodically or adapters have to be adopted to changed information system interfaces.
– Cost Driver 3-c (BPI User Helpdesk): Users of a BPI solution have to be supported in using the provided features. This requires the implementation of a specialized user helpdesk which causes additional costs.
• Cost Category 4 (BPI Customizing): BPI tools support a broad spectrum of use cases (cf. Sections 2 and 3). However, every organization has its own focal points.
Therefore, BPI solutions are typically customized to fullfil an organization’s require- ments before it goes live:
– Cost Driver 4-a (Customizing of BPI Solution): The initial customizing of a standard BPI solution causes high efforts (and therefore costs). Organization-specific key per- formance indicators and business ratios [Kue03] have to be defined and adequate dash- boards have to be configured.
– Cost Driver 4-b (Maintenance of BPI Solution): Besides initial customizing activities, further maintenance efforts have to be incorporated (e.g., for the integration of addi- tional data sources, adaptations of existing connectors).
4.1.2 Indirect Costs
Indirect costs of BPI investments are difficult to quantify. Nevertheless, they have to be taken into account as well. Generally, indirect costs result in a decreased productivity. Im- portant indirect cost driver regarding the use of BPI are the self-support of users, informal learning activities and the personal customizing of BPI features accessible within a user’s personal scope. Regarding the quantification of these indirect costs we refer to approaches discussed before (e.g., at [Inc03]) as their quantification is outside the scope of this paper.
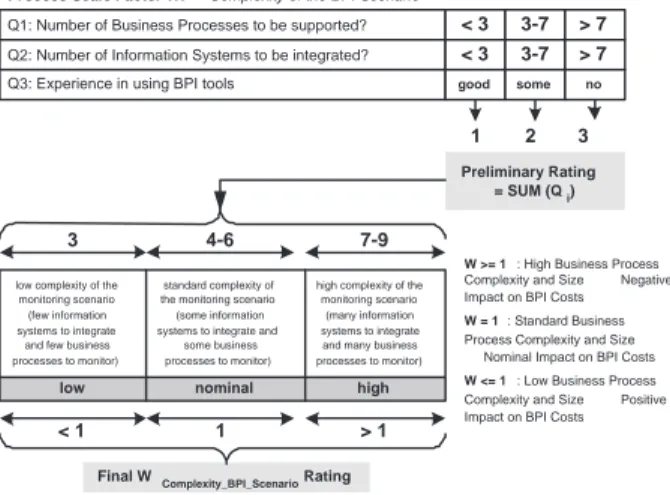
4.1.3 Quantifying the Complexity of the BPI Scenario
Besides the mentioned cost drivers another source of cost variation has to be taken into account. Practical experiences indicate that the complexity of the BPI scenario to be re- alized is a significant source of exponential cost variation. To consider this thesis, we introduce an exponential scale factor Complexity BPI scenario W (cf. Fig. 4). W accounts for the relative economies or diseconomies of scale when a BPI scenario increases in its complexity. Economies and diseconomies of scale refer to an economic property of pro- duction and describe what happens to costs if the quantity of all input factors increases.
If costs increase proportionately, there are no economies of scale. If costs increase by a greater amount, there are diseconomies of scale. If costs increase by a lesser amount, there are positive economies of scale. By means of our cost model this means that if W ≤1, the BPI complexity is high and a BPI investment exhibits economies of scale. If the BPI scenario’s complexity is doubled, the BPI investment costs are more than doubled. W = 1 describes a standard BPI scenario with economies and diseconomies of scale in balance.
If W≥1, BPI complexity is low and a BPI investment exhibits diseconomies of scale.
Process Scale Factor W: Complexity of the BPI Scenario
W >= 1 : High Business Process Complexity and Size Negative Impact on BPI Costs W = 1 : Standard Business Process Complexity and Size
Nominal Impact on BPI Costs W <= 1 : Low Business Process Complexity and Size Positive Impact on BPI Costs
low nominal high
low complexity of the monitoring scenario (few information systems to integrate
and few business processes to monitor)
standard complexity of the monitoring scenario (some information systems to integrate and
some business processes to monitor)
high complexity of the monitoring scenario (many information systems to integrate and many business processes to monitor)
< 1 1 > 1
Q1: Number of Business Processes to be supported?
Q2: Number of Information Systems to be integrated?
< 3 3-7 > 7
< 3 3-7 > 7
1 2 3
Preliminary Rating
= SUM (Qi)
Final W Complexity_BPI_Scenario Rating
3 4-6 7-9
Q3: Experience in using BPI tools good some no
Figure 4: Cost Model to quantify BPI Investments.
To determine the complexity of a BPI scenarios, i.e., to define W), we use an approach based on three attributes (cf. Fig. 4): the number of business processes to be monitored, the number of information systems to be integrated (as data sources), and the experience of the users of the BPI solution. Estimations for W can be derived from these factors (cf.
Fig. 4), though we cannot yet provide calibrated reference values W. Such a calibration is based on real project data and necessary to be able to derive valid estimations.
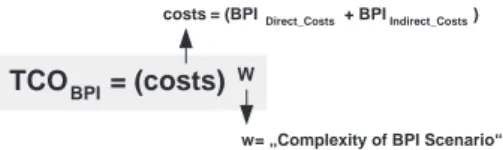
In summary, Figure 5 shows the cost model that can be used to quantify the total costs of ownership (TCO) of BPI. Besides the BPI total costs of ownership, there is another cost- related effect that we assume based on practical experiences. BPI promises to positively affect software development efforts. This thesis is illustrated in the following section.
TCOBPI = (costs) W
costs = (BPIDirect_Costs + BPIIndirect_Costs)
w = „Complexity of BPI Scenario“
Figure 5: Quantifying the Total Costs of Ownership of BPI Investments.
4.2 Quantifying the impact of BPI on Software Development Projects
This section sketches a conceptual extension of algorithmic cost models to quantify the impact of BPI on software development efforts. The proposed extension is based on the rationale that the use of BPI helps to better align information system to business processes.
4.2.1 Algorithmic Cost Models
Algorithmic cost models are based on mathematical formulas to predict the effects of software technology improvements on software life cycle costs and schedules. Respective models (e.g., Boehm’s constructive cost model [Boe81] or Putnam’s software life cycle management [PM91]) rely on estimations of various software development process and product attributes (e.g., software size or number and experiences of software engineers involved). Algorithmic cost models unify exponential and linear scaling approaches into one rating-driven model:
effort (person months) = A * (size) B * EM
A is an organisation-dependant constant and not further considered in the following. A software system’s size can be measured in lines of code, functions points or object points.
B is an exponential scale factor to account for the relative economies or diseconomies of scale encountered as a software project increases its size (e.g., through communication overhead of large teams). EM typically unifies a set of additional linear effort multipliers EMi (with EM = SUM(EMi)). These usually combine attributes to further adjust the es- timate obtained from calculating only with a project’s size and exponential scale factors.
EMi typically cover product attributes (e.g., constraints and requirements placed upon the project), platform attributes (e.g., limitations caused by the hardware and operating system being used), personnel attributes (e.g., level of skills possessed by the project personnel), and project attributes (e.g., constraints and conditions under which project development takes place).
4.2.2 Quantifying the impact of BPI
Existing algorithmic cost models cover a broad spectrum of software projects. One prob- lem, however, is that the possible impact of BPI is not represented by these models. There-
fore, we propose an additional effort multiplier EMbpi to take BPI aspects into consider- ation as well. This idea is based on the rationale that a software project’s development productivity depends - among other things - on the amount of BPI functions used in a software project. While some software project’s rely on only simple BPI features (e.g., standard process visualization functions), others use advanced BPI functions (e.g., process mining) to gain valuable information for the alignment of information systems to business processes (cf. Section 3). The proposed effort multiplier EMbpi can be used with any algorithmic cost model, though it has to be calibrated separately for each used model.
The extension with an additional effort multiplier EMbpi (rather than to develop a new cost model from the scratch) seems to be reasonable as this allows us to focus on the impacts of BPI specific cost drivers. Traditional software estimation aspects can be further addressed by using existing cost models. Using the current version of Boehm’s constructive cost model as baseline [BAB+00], for example, would mean that cost calculations are based on 17 instead of 16 cost drivers.
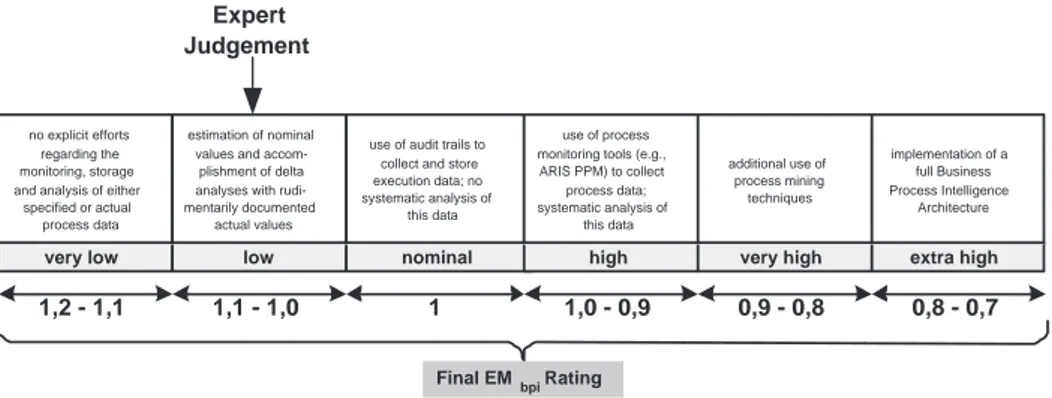
very low low nominal high very high extra high
no explicit efforts regarding the monitoring, storage and analysis of either
specified or actual process data
estimation of nominal values and accom-
plishment of delta analyses with rudi- mentarily documented
actual values
use of audit trails to collect and store execution data; no systematic analysis of
this data
use of process monitoring tools (e.g., ARIS PPM) to collect process data;
systematic analysis of this data
additional use of process mining techniques
implementation of a full Business Process Intelligence
Architecture
1,1 - 1,0
1,2 - 1,1 1 1,0 - 0,9 0,9 - 0,8 0,8 - 0,7
Final EMbpi Rating Expert
Judgement
Figure 6: Business Process Intelligence Cost Driver Ratings.
To derive a value for EMbpi, an approach based on expert judgements seems suitable. The use of BPI features used within a software development project is rated from very low to extra high (cf. Fig. 6) and a corresponding value for EMbpi. The assumed values shown in Figure 6 orientate oneself at reference values provided by the constructive cost model for effort multipliers and are not yet validated and calibrated. An overall EMbpi rating less than 1 denotes a factor that can decrease the schedule and effort. An EMbpi rating equal to 1 does neither extend nor decrease the schedule and effort. A EMbpi rating greater than 1 denotes a factor that extends the schedule or effort.
Figure 7 illustrates two ”what-if” scenarios focusing on the impact of the effort multiplier EMbpi using Boehm’s constructive cost model as calculation baseline. Extra high rated BPI results in a decreased effort, while very low rated BPI results in an increased effort.
0 200 400 600 800 1000 1200 1400 1600 1800
50 FP 100 FP 250 FP 500 FP
Effort EMbpi = „extra low“
EMbpi = „very high“
EMbpi = „very low“
Cocomo 2 Estimation Cocomo 2 Scale Factors and Effort Multipliers = „Nominal“
0 1000 2000 3000 4000 5000 6000
50 FP 100 FP 250 FP 500 FP
EMbpi = „extra low“
EMbpi = „very high“
EMbpi = „very low“
Cocomo 2 Estimation Cocomo 2 Scale Factors
= „Nominal“ and Effort Multipliers = „Very Low“
Figure 7: Cocomo 2-based What-If Scenarios.
5 Summary and Future Work
This paper sketches basic BPI concepts (including a conceptual BPI reference architecture and a short overview of contemporary BPI tools). Based on this background information, benefits of BPI are described in more detail. As BPI implies not only benefits, but causes significant costs as well, we introduce two cost models analysing two different cost aspects related to BPI. The first cost model describes an approach to estimate the total cost of own- ership of BPI investments. Thereby, we distinguish between direct and indirect costs, and additionally introduce an exponential scale factor ”Complexity of BPI Scenario”. Based on a second cost model we sketch the idea of quantifying the effects of BPI on software development efforts (by extending algorithmic cost models with a new effort multiplier EMbpi).
We are aware of the problem that our cost models are not yet validated and calibrated.
However, both models and especially the assumed exponential scale factors will be subject to further analyses. Anyhow, both cost models and their underlying assumptions are based on practical experiences and provide first insights into BPI economics.
References
[BAB+00] B. Boehm, C. Abts, A. W. Brown, S. Chulani, B. K. Clark, E. Horowitz, R. Madachy, D. Reifer, and B. Steece. Software Cost Estimation with Cocomo 2. Prentice Hall, 2000.
[Boe81] B. Boehm. Software Engineering Economics. Prentice Hall, 1981.
[BRB05] R. Bobrik, M. Reichert, and T. Bauer. Requirements for the Visualization of System- Spanning Business Processes. 1st Int’l Workshop on Business Process Monitoring and Performance Management (BPMPM 05), Copenhagen, Denmark, 2005.
[DeM83] Tom DeMarco. Controlling Software Projects: Management, Measurement and Esti- mation. Yourdon Press, 1983.
[GCC+04] D. Grigori, F. Casati, M. Castellanos, U. Dayal, M. Sayal, and M. Shan. Business Process Intelligence. Computers in Industry, 53, pp. 321-343, 2004.
[Hof99] O. Hoffmann. Performance Management - Systeme und Implementierungsans¨atze. Paul Haupt Verlag, 1999.
[HW05] B. Humm and F. Wietek. Architektur von Data Warehouses und Business Intelligence Systemen. Informatik Spektrum 28, pp. 3-14, 2005.
[IBM03] IBM. IBM WBI Monitor V. 4.2.3. IBM Report, 2003.
[Inc03] Gartner Inc. Distributed Computing Chart of Accounts. 2003.
[Kat04] P. S. Katsma. Business Function Support. Pearson Custom Publications, 2004.
[Kue03] M. Kuetz. Kennzahlen in der IT - Werkzeuge f¨ur das Controlling und Management.
dpunkt Verlag, 2003.
[LK04] R. Lenz and K. A. Kuhn. Towards a continuous Evolution and Adaptation of Informa- tion Systems in Healthcare. Int’l J. of Medical Informatics, 74, pp.75-89, 2004.
[Lof02] N. Lofts. Process Visualization. John Wiley and Sons Inc., 2002.
[Mic04] Microsoft. Understanding BizTalk Server. Technical Article, available for download at:
http://www.microsoft.com/biztalk, 2004.
[MRB05a] B. Mutschler, M. Reichert, and J. Bumiller. Towards an Evaluation Framework for Business Process Integration and Management. 2nd INTEROP Workshop at Int’l. Conf.
on Enterprise Computing (EDOC 2005), Enschede, The Netherlands (to appear), 2005.
[MRB05b] B. Mutschler, M. Reichert, and J. Bumiller. Towards Process-Aware Enterprise Software Environments. Proc. 7th Int’l Conference on Enterprise Information Systems (ICEIS 2005), pp. 575-579, 2005.
[MWK04] F. Melchert, R. Winter, and M. Klesse. Aligning Process Automation and Business In- telligence to support Corporate Performance Management. Proc. 2004 Americas Con- ference on Information Systems (AMCIS 2004), pp.53-63, 2004.
[PM91] L. Putnam and W. Meyers. Measures for Excellence: Reliable Software on Time, Within Budget. Yourdon Press Computing Series, 1991.
[Rei02] D. J. Reifer. Making the Software Business Case - Improvement by the Numbers.
Addison-Wesley, 2002.
[RRD04] S. Rinderle, M. Reichert, and P. Dadam. Flexible Support of Team Processes by Adaptive Workflow Systems. Distributed and Parallel Databases, 16(1), pp. 91-116, 2004.
[Sch04] IDS Scheer. ARIS Process Performance Manager. White Paper, 2004.
[vdAW04] W. M. P. van der Aalst and A. J. M. M. Weijters. Process Mining - A Research Agenda.
Computers in Industry, 53(3), pp.231-244, 2004.
[zM04] M. zur Muehlen. Workflow-based Process Controlling - Foundation, Design and Appli- cation of Workflow-driven Process Information Systems. Logos Verlag Berlin, 2004.