DOI 10.1007/s10270-014-0443-z S P E C I A L S E C T I O N PA P E R
Effective application of process improvement patterns to business processes
Matthias Lohrmann · Manfred Reichert
Received: 24 September 2013 / Revised: 28 November 2014 / Accepted: 1 December 2014
© The Author(s) 2014. This article is published with open access at Springerlink.com
Abstract Improving the operational effectiveness and effi- ciency of processes is a fundamental task of business process management (BPM). There exist many proposals of process improvement patterns (PIPs) as practices that aim at support- ing this goal. Selecting and implementing relevant PIPs are therefore an important prerequisite for establishing process- aware information systems in enterprises. Nevertheless, there is still a gap regarding the validation of PIPs with respect to their actual business value for a specific application scenario before implementation investments are incurred. Based on empirical research as well as experiences from BPM projects, this paper proposes a method to tackle this challenge. Our approach toward the assessment of process improvement pat- terns considers real-world constraints such as the role of senior stakeholders or the cost of adapting available IT sys- tems. In addition, it outlines process improvement poten- tials that arise from the information technology infrastruc- ture available to organizations, particularly regarding the combination of enterprise resource planning with business process intelligence. Our approach is illustrated along a real-world business process from human resource manage- ment. The latter covers a transactional volume of about 29,000 process instances over a period of 1 year. Overall, our approach enables both practitioners and researchers to reasonably assess PIPs before taking any process implemen- tation decision.
Communicated by Dr. Selmin Nurcan.
M. Lohrmann (
B
)·M. ReichertDatabases and Information Systems Institute, Ulm University, Ulm, Germany
e-mail: mlohrmann@kpmg.com; matthias.lohrmann@uni-ulm.de M. Reichert
e-mail: manfred.reichert@uni-ulm.de
Keywords Business process modeling·Business process design·Business process optimization·Business process intelligence·Business process quality
1 Introduction
Research on business process management (BPM) and process-aware information systems (PAISs) has resulted in many contributions that discuss options to improve the quality, performance, and economic viability of business processes [1]. Examples range from individual “best prac- tices” [2] to comprehensive business process quality frame- works [3,4]. In this context, we refer to process improvement patterns (PIPs) as generic concepts for enhancing particular aspects of business processes. As an example, consider deci- sion processes that require to appraise various decision crite- ria. The respective appraisal tasks can be arranged to reach a decision with as little effort and as quickly as possible. This can be achieved by executing tasks with a high probability of providing sufficient information for a decision and with comparably low execution effort earlier in the process. This principle is known as “knockout” [5]. It constitutes a first example of a process improvement pattern.
Example 1 (Knockout principle) Consider a process for han- dling invoices received from suppliers. To determine whether the invoice should be paid, we want to check whether it is in line with purchase order data. In addition, we need to ensure that there is a sign-off from the responsible manager. The former check can be fully automated in the context of ERP systems and therefore be executed with little effort. Thus, it makes sense to execute this check first and possibly “knock out” the invoice before incurring the much greater effort of (manual) sign-off.
1.1 Research challenges
To ensure practical relevance, the actual business value of PIPs needs to be demonstrated to practitioners, thus enabling reasonable implementation decisions. In the context of this issue, there exist many propositions for empirically establish- ing the effectiveness of PIPs. These include anecdotal evi- dence [6], case studies [7], and surveys [8]. Commonly, these approaches are based on ex-post (i.e., hindsight) appraisal of qualitative evidence given by process managers or other stakeholders to obtain general insights applicable to compa- rable cases.
However, there still exists a gap regarding the a priori (i.e., in advance) assessment of PIPs considering a particu- lar application scenario, which may range from an organiza- tion’s strategy and goals to its existing business process and information systems landscape. In particular, this gap should be bridged for the following reasons:
– Similar to design patterns in software engineering [9], PIPs constitute abstract concepts that may or may not be useful in a particular context. Experience from other sce- narios, which may widely differ from the one at hand, is thus not sufficient to take reasonable decisions on the implementation of organizational changes or process- aware information systems (PAISs).
– Ex-post evidence is usually obtained from persons involved in the respective implementation projects. In turn, this leads to a source of bias. Moreover, a priori assessment allows addressing a far wider spectrum of PIPs. In particular, it is not necessary to complete imple- mentation projects before a PIP can be assessed.
– Combining PAISs with process intelligence tools [10–12]
opens up new opportunities to quantitatively and qualita- tively gauge real-world business processes. This should be leveraged for scenario-specific PIP assessment.
– Effective PAIS development requires to consider process improvement potentials before any implementation effort is incurred. Accordingly, PAIS development should start with a requirements definition which, in turn, is based on adequate process design considering relevant PIPs.
To enable a priori PIP assessment, this paper tackles the following challenges:
Challenge 1 Describe an approach toward a priori PIP assessment reflecting and summarizing common practice in the field.
Challenge 2 Evaluate the approach by applying it to a sub- stantial real-world case.
Challenge 3 Reconcile the approach to scientific standards by applying guidelines for empirical research in information systems (IS).
1.2 Contribution
This article constitutes an amended version of the work we presented in [13]. Reflecting the considerations made above, [13] provides an approach toward a priori assessment of PIPs.
In particular, the contribution of [13] is based on the following aspects:
– The proposal we presented in [13] provides a standard approach to evaluate the impact of PIPs on organizational objectives for specific application scenarios. Thus, it sup- ports well-founded decisions on the implementation of corresponding adaptations of business processes. More- over, it contributes to bridge the gap between generic PIPs proposed by the BPM research community and real- world application scenarios. This way, it enhances the practical relevance of proposed PIPs.
– It considers scientific rigor by applying an appropriate research framework.
– It reflects practical requirements, which could be demon- strated through an experience report covering a substan- tial real-world business process.
In particular, when discussing the validity of our research design, execution, and results with practitioners, we made a number of observations that are generally applicable to process improvement projects based on PIPs. Since these may be helpful for practical application as well as future research, they are included as project recommendations in this paper.
This article complements our previous results with the following additional contributions:
– It extends the presentation of the sample case used for our experience report with empirical results based on process mining [11]. Thus, it illustrates the application of this technology to a practical case.
– It provides a discussion of open challenges regarding process improvement tools.
– It provides a more profound discussion of the applied process improvement methodology, thus rendering the approach more accessible for application to other sce- narios.
– It discusses the complete set of process improvement measures that resulted from the application of PIPs to the sample case.
– It describes the results obtained when revisiting our process improvement measures 14 months after having completed the initial process improvement project.
– It provides a substantially extended discussion of related work.
– It comprises a more detailed reflection of our results against Challenges 1–3, as well as an assessment of the
Fig. 1 Sample business objective: handling incoming applications
Job offer sent
Letter of refusal sent OR
approved
Agreement on conditions
Symbols Conditional element
Subcondition:
relevant state of conditional elements
AND
Necessary / sufficient subconditions
“Fully determinate” target aspect:
to be fulfilled if and only if conditions are met Technical
quality
Interview results
AND Senior management
approval
Simplified terminology, full set of terms available in [15]
approved
given
given
OR not
approved not approved
not given
not given
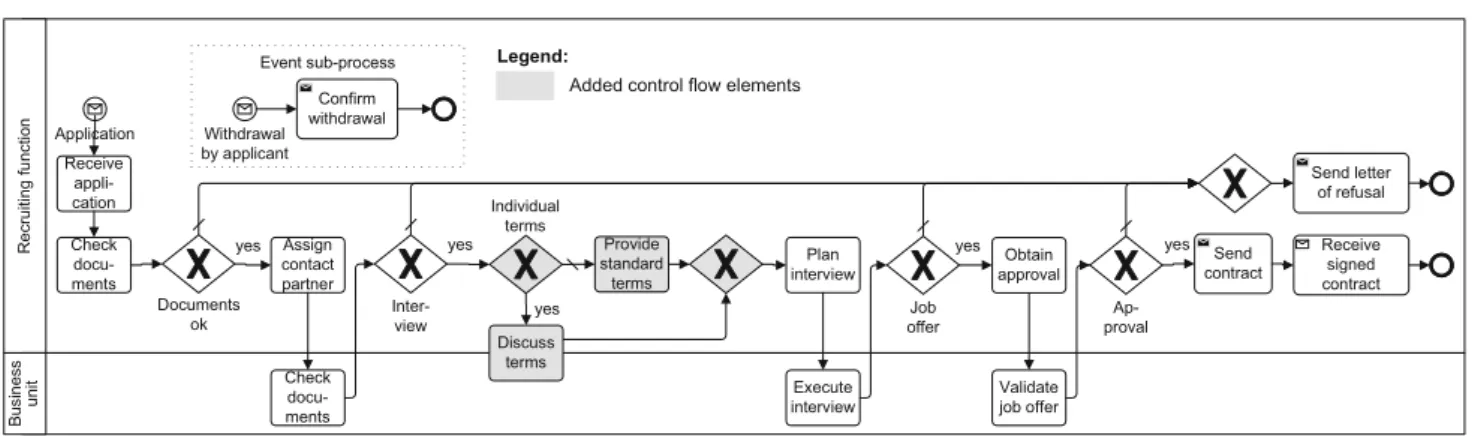
Fig. 2 Sample process: handling incoming applications (BPMN notation)
general applicability of our approach. This includes a dis- cussion of relevant limitations and strategies to address these.
The remainder of this article is structured as follows:
Sect.2describes the sample process we use to illustrate our approach. Section3presents our approach toward PIP assess- ment. In the sense of an experience report, Sect.4describes the results obtained when applying the approach to the sam- ple process from Sect.2. Section5discusses the state of the art in PIP assessment as well as other related work. Finally, Sects.6and7evaluate our results referring to the challenges discussed above and conclude the paper.
2 Sample case: applications management process The business process we use to illustrate the concepts pre- sented in this paper stems from the field of human resource management. It addresses the handling of incoming job appli- cations to fill open positions in a professional services firm.
Figure 1 describes the business objective of this process according to a notation we developed in [14]. The objec- tive of the process is to achieve one of two states for each job application: Either the application is refused, or a job offer is
sent to the applicant. A job offer shall be sent if the following conditions are met: (1) The application documents have been accepted in terms of quality (e.g., with regard to the CV), (2) an interview has taken place with a positive feedback, (3) basic conditions have been agreed on between both parties, and (4) senior management approval has been obtained. If one of these requirements is not met, a letter of refusal has to be sent.
Based on our discussions with stakeholders and the results of process mining, we can model the business process imple- menting this business objective. For this purpose, we use BPMN (cf. Fig.2, [15]). For the sake of brevity, we slightly simplify the model and omit a detailed description of its elements. As an example of the relation between the busi- ness objective and the process model, consider the condi- tions the business objective poses toward sending a job offer.
The process model transforms these conditions into respec- tive checking activities (e.g., Technical quality into Check documents) and XOR decision gateways. Note that there is not necessarily a one-on-one relation between conditions and checking activities. Further, there may be multiple process implementation alternatives for a given business objective (e.g., multiple conditions may be checked within one activ- ity).
Fig. 3 Termination states of the application process: one fiscal year sample
29.177
17.081
5.101
2.129 388 1.541
2.937
100% 59%
17%
7%
1% 5%
10%
Incoming applications
Declined by recruiting department
Declined by technical department
Declined after interview
Job offer not approved
Withdrawal by applicant
Applicant hired Critical cases
Note: Analysis includes internships, but no back office applications (e.g., personal assistants); withdrawal by applicant can occur at any time
No. of process instances
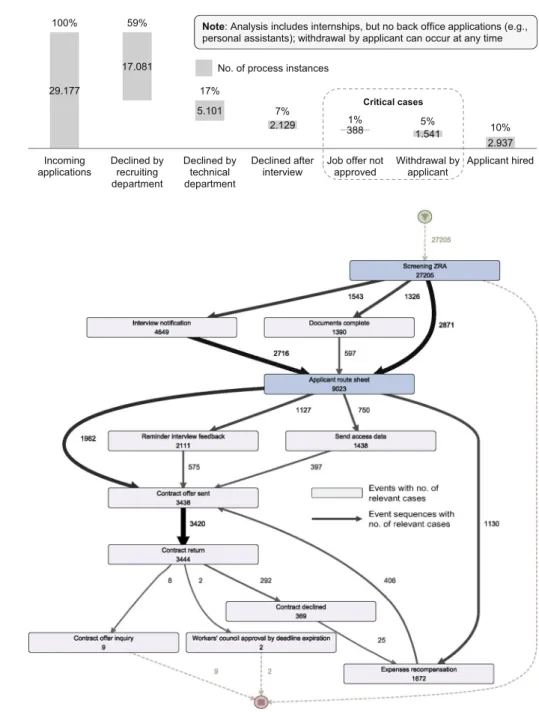
Fig. 4 Filtered process map:
one fiscal year data sample
Figure3 breaks down the total number of applications handled in a time period of one fiscal year into the num- ber of applications for each possible termination state of the process. Note that the termination states from Fig. 3 correspond to potential paths through the process model from Fig.2. We will refer to this overview when discussing our research execution in Sect. 4. We obtained a corre- sponding data sample of 27,205 process instances from the log database tables of the PAIS supporting the business process (in this case, an SAP ERP system). Each process instance covers one application. Thus, 1,972 out of the 29,177 applications of Fig.3 are not included in the data sample.
These comprise, for example, applications handled in the business units without involvement in the human resource
(HR) function. These applications are not traceable in the PAIS.
Figure4shows a process map generated with the Disco process mining tool [16] when applying it to the data sample.1 For the sake of readability, this process map has been filtered
1 The field of process intelligence deals with analyzing the actual enact- ment of business processes [17]. In this context, process mining refers to using processing events logged with a timestamp to generate process maps, i.e., graphic representations of actual process enactment traces, and additional process information [11]. Note that Disco was selected as a representative of a number of tools available to practitioners in commercial settings today. Alternatives like ProM [18] or Celonis Dis- covery [19] might be used as well.
to solely comprise enactment traces that occur frequently and events that are relevant for our analyses.
The process map is an example of the results that can be generated with process mining tools. In the following, we will use process mining and other techniques to analyze our log data sample with respect to process improvement potentials.
The process map should be considered as an amendment, but not as a replacement of “traditional” process models such as the one presented in Fig.2:
– The process map is based on events logged in the PAIS.
Not all events directly reflect a corresponding activity in the process model, and identifiers of events might differ from the ones of corresponding activities. There may be activities not reflected in a logged event or events not triggered by an activity from the process model.
– The process map shows the actual frequency of events in the data sample. Thus, it reflects as-is process execution, which may differ from to-be process design as recorded in the process model.
– The process map needs to be interpreted with the sup- port of experienced stakeholders. In our sample case, for example, application refusal events are used to purge the database of received applications to comply with privacy regulations. Further, not all hirings are handled through the corresponding end events. Issues like these need to be understood when interpreting the process map. However, this understanding is useful for process improvement as well.
3 Methodology
Like other IS artifacts, PIPs constitute goal-bound artificial constructs in the sense of the design science paradigm [20]
to be evaluated in terms of “value or utility” [21]. In our context, this results in a particular challenge. While PIPs are abstract concepts applicable to a broad range of scenarios, their business value must be determined considering the spe- cific use case to enable a decision whether the PIP should be implemented. To this end, we use an extended conceptual framework as summarized in Fig.5.
Beyond the concepts of PIPs and business processes or application scenarios, we introduce organizational objec- tives, process improvement objectives, and process improve- ment measures:
1. Organizational objectives reflect strategic goals an organization wants to achieve with respect to an appli- cation scenario. Examples of organizational objectives that apply to many scenarios include the effectiveness of process output, cost savings, or compliance with regu- lations [1,22]. Note that these examples can be used as
Process improvement objectives (PIOs)
Business process / application scenario
Process improvement measures (PIMs) Organizational
objectives Process improvement
patterns (PIPs)
Specific Generic
“What?”
“How?”
Additional concepts Original concepts
1
2
3
Fig. 5 Extended conceptual framework
a starting point to identify organizational objectives rel- evant to a particular application scenario. In principle, such objectives are generic, but how they are prioritized against each other is specific to an organization’s strategy.
2. Process improvement objectives (PIOs) comprise char- acteristics that enhance a process considering orga- nizational objectives. PIOs can be viewed as a refine- ment of organizational objectives considering the par- ticular challenges associated with a concrete application scenario. In a step-by-step approach, PIOs can be refined into a tree structure, as will be exemplified when dis- cussing our application scenario in Sect.4. The resulting top-down model is a useful mental technique to ensure a comprehensive perspective on process improvement.
Note that similar considerations are used in goal-oriented requirements engineering (cf. Sect.5.3) and value-based management [23]. This procedure can be aborted as soon as the resulting PIOs are sufficiently granular to allow for the application of PIPs. PIOs thus constitute the “bridge”
between abstract organizational objectives and concrete PIPs. The relevance of PIOs to organizational objectives may be evident, or it may require additional validation.
As an example of immediately evident PIOs, consider the elimination of obviously redundant tasks to reduce costs.
As an example of PIOs that require validation, consider short cycle times. It is not necessarily a strategic goal to enact processes as fast as possible. However, this may be a PIO if a link between cycle times and a particu- lar organizational objective (e.g., reducing costs) can be demonstrated. PIOs thus provide an additional layer of abstraction as a “shortcut” between improvement mea- sures and organizational objectives. For the above exam- ple, potential improvement measures might be validated by demonstrating a positive impact on cycle times instead of overall cost. PIOs can also be viewed as a tool to iden- tify PIPs relevant for the application scenario: Available PIPs are considered with regard to whether they can con- tribute to a PIO. For example, the parallel execution of formerly sequential tasks constitutes a PIP that may con- tribute to shorter cycle times as an exemplary PIO. Note
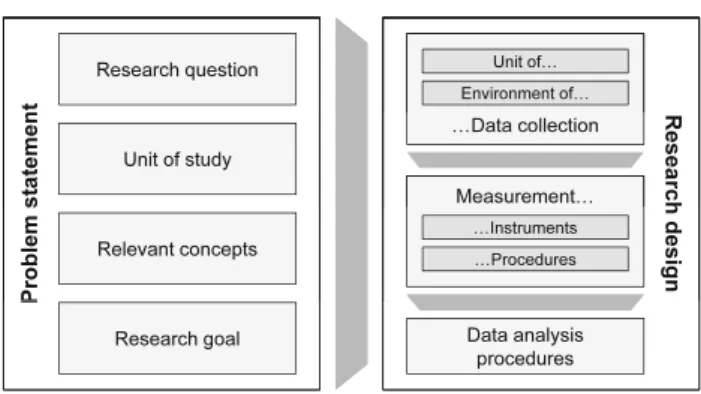
Fig. 6 Problem statement and research design: required components
that the concept of PIOs corresponds to the identifica- tion of stakeholders’ goals, which has been proposed as a requirement for empirical IS research in [24].
3. Process improvement measures (PIMs) are bundles of actions considered for joint implementation.2 They reflect the application of process improvement patterns (PIPs) to a specific process in order to realize PIOs. Sev- eral PIPs may be bundled into one PIM for joint imple- mentation, depending on the given application scenario.
As an example of a PIM, consider the implementation of a new workflow tool, which may incorporate multi- ple abstract PIPs. A PIM thus applies one or more PIPs to a specific business process to address one or more particular PIOs. Assessing PIPs for a particular applica- tion scenario thus amounts to the assessment of the busi- ness value of corresponding PIMs considering relevant PIOs.
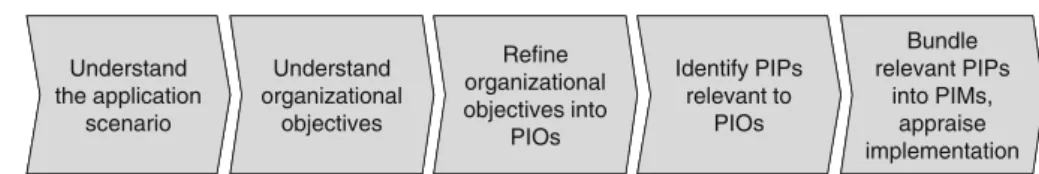
Note that, considering the arrows, Fig. 5 may also be read as a top-down method for process improvement. Sec- tion 4 further describes its application: General organiza- tional objectives are refined to PIOs specific to the consid- ered business process or application scenario. Then, PIPs rel- evant to the concrete scenario are selected from a generic set of generally available PIPs and bundled into concise PIMs.
Specifically to the application scenario, PIMs are described in sufficient detail to enable to discuss and decide on their implementation.
Business processes and PIMs, as our unit of study, are implemented by means of PAISs. To maintain scientific rigor, their assessment should take into account requirements known from the empirical evaluation of propositions in soft- ware engineering or IS research. In [24], the authors subsume requirements in terms of scientific methodology for evalua- tion approaches in IS research. Figure6provides an overview on the basic concepts described there. In the following, we
2Note that in the given context, the term “measure” is not to be under- stood as a means of measuring something (e.g., a performance indicator) or as a unit of quantity, but as a coordinated set of activities.
align our approach to [24]. We describe how each compo- nent is reflected in our proposition. Note that the (general) statements made should be further refined for each applica- tion scenario. From a practical perspective, this will ensure a common understanding by all project participants. Thus, respective considerations are included in the following para- graphs as well.
3.1 Problem statement
The first four components we address constitute the problem statement according to [24].
Research question (“What do we want to know?”) Should PIMs be implemented to better meet organizational objec- tives? Note that this research question refers to PIMs instead of PIPs in order to reflect our goal of scenario-specific assess- ment.
For our sample case, the research question can be refined to the question whether PIMs should be implemented to reduce cost per hire (cf. Sect.4.1).
Unit of study (“About what?”) The business process to be improved and the proposed PIMs comprising PIPs constitute our unit of study. Effectively selecting PIPs and bundling them into scenario-specific PIMs require the participation of knowledgeable, but also creative project members. For exam- ple, the participants of workshops to discuss PIMs should be carefully selected. In this regard, researchers may contribute a valuable “outside-in view” based on, for example, experi- ence from other scenarios.
Regarding our sample case, the application management process and the proposed PIMs as the unit of study are described in detail in Sects.2and4.3, respectively.
Relevant concepts (“What do we know in advance?”) Related work to be considered generally includes conceptual work on PIPs, case studies on comparable processes, and benchmarks available for the application scenario. In this regard, it is helpful to ensure proper research of available literature as well as a thorough use of available organizational knowledge (e.g., through selection of appropriate interview partners).
For our exemplary application scenario, we use a frame- work of process redesign practices [2], our own research into PIPs, a cost per hire benchmark, and available research on
“knockout” processes [5].
Research goal (“Why do we want to know?”) Implementing PIMs will result in cost and risks incurred (e.g., process dis- ruptions). To avoid unnecessary cost and risks, implementa- tion decisions should be based on appropriate investigation of whether implementing PIMs will enable to better meet organizational objectives. Implementation decisions should consider not only benefits in day-to-day process operations, but also required investments and future operating cost or total cost of ownership.
3.2 Research design
The five components described in the following constitute the research design of our approach in terms of data collection, measurement, and data analysis.
Unit of data collection To understand the application sce- nario, we require an as-is process description to reflect process design, a process instances sample to reflect process execution, and PIOs to reflect refined organizational objec- tives. Depending on the application scenario and practical considerations, the process instances sample can be given as a PAIS data extract, as a set of interviews with involved people, as a set of cases directly observed, or as a combina- tion thereof. To assess PIPs, we require descriptions of avail- able PIPs and scenario-specific propositions of PIMs. Note that data collection should cover both process design and actual process execution. This way, PIOs can be identified prospectively (based on the process design) and retrospec- tively (based on the process execution). Immediate observa- tions are preferable to indirectly related process information.
Depending on the application scenario and practical con- siderations, the process instances sample can be given as a PAIS data extract, as a set of interviews with involved peo- ple, as a set of cases directly observed, or as a combination thereof.
Regarding our sample application scenario, we could refer to a business objective model and a flowchart of the process, a statistic on the results of process execution, and a substantial PAIS execution data extract (cf. Sect.2). To assess PIPs, we use PIP descriptions available in the literature and from our own research, and PIMs as described below (cf. Sect.4.3).
Environment of data collection Our proposition primarily aims at improving existing business processes. Hence, data are collected in the field to reflect the actual situation as best as possible. The environment of data collection thus gen- erally comprises process stakeholders (i.e., contact partners involved in process execution, recipients of process output, or suppliers of process input) as well as relevant documenta- tion and PAISs. The environment of data collection should be as broad as practically reasonable in order to facilitate iden- tifying all PIOs that are relevant to organizational objectives, and to enable appropriate assessment of PIPs and PIMs.
Regarding our sample case, the environment of data col- lection comprised the head of recruiting, a business unit HR partner, business unit team managers, the PAIS administra- tor, and recruiting team members as process stakeholders. In terms of documentation, we used regular recruiting manage- ment reports and PAIS status codes. The PAIS used to support the business process was available as well. As a limitation to our sample environment of data collection, applicants as a group of process stakeholders were not represented in the environment of data collection due to practical requirements.
Because of privacy regulations, applicants’ contact data may
only be used to process the application, but not for other purposes.
Measurement instruments Our approach is based on elabo- rating PIOs and PIMs in a step-by-step approach. Draft PIOs and PIMs are thus used to document input from the environ- ment of data collection, and constitute measurement instru- ments comparable to semi-structured questionnaires. These are amended with the proceedings documentation from inter- views and workshops (see measurement procedures below).
In addition, depending on the process instances sample, process execution tracing capabilities in PAISs or statistical process control (SPC) procedures also need to be considered.
Note that measurement instruments should consider usability criteria with regard to stakeholders involved in measurement procedures. For example, this requires using terms customary to the organization when phrasing PIOs and PIMs.
Regarding our sample application scenario, PIOs and PIMs used as measurement instruments are described in Sects.4.2and4.3, respectively. In addition, we used work- shop proceedings, confirmation letters on results reconcili- ation (via email), and procedures to extract execution data from the PAIS used to manage incoming applications.
Measurement procedures Depending on the application sce- nario and practical considerations, relevant measurement procedures comprise stakeholder interviews, stakeholder workshops, and questionnaire procedures. Process mining can be used if the sample of process instances is based on a PAIS data extract. Measurement procedures should take into account customary practices of the organization, e.g., by using standard templates for meeting proceedings.
On-site measurement procedures (i.e., observing the process in its operations environment) can help to identify additional PIOs to be addressed for process improvement by giving a clearer picture of day-to-day process issues.
Regarding our sample case, we used telephone and face- to-face interviews with follow-up reconciliation of proceed- ings, a recruitment center site visit, and process mining with Disco.
Data analysis procedures In general, relevant data analy- sis procedures include qualitative analysis of workshop and interview results and quantitative analyses of process instance samples depending on the measurement instruments applied. Note that data analysis procedures need to be flexi- bly adapted to the step-by-step refinement of PIOs and PIMs and to the form of quantitative data available on the process instances sample. In practice, this may lead to a mix of tools actually applied. In this context, for example, statistical analysis tools can significantly reduce quantitative analysis effort and therefore enable enhancing the search scope for relevant PIOs.
Regarding our sample case, a qualitative analysis was con- ducted together with stakeholders as described in Sect.4.3.
In turn, the quantitative analysis comprised filtering of sub-
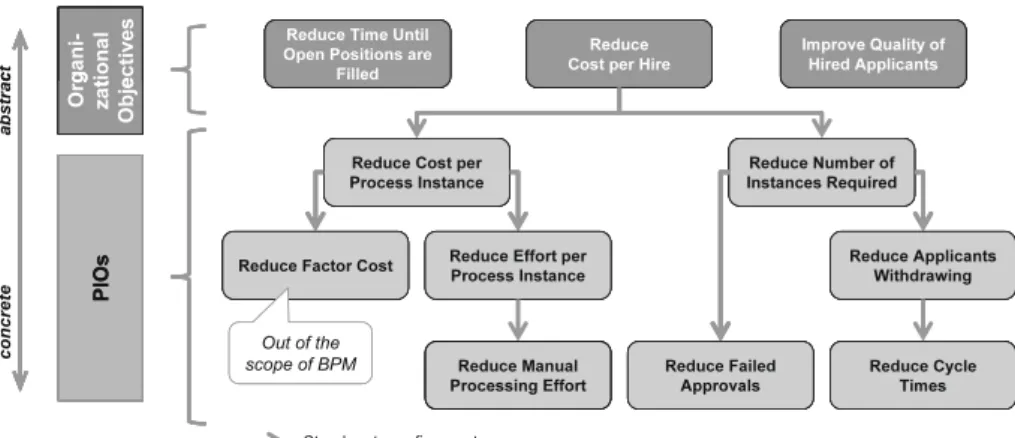
Fig. 7 Deriving process improvement objectives
process views in a process mining tool (Disco), re-extraction of filtered samples and import into a spreadsheet application, conversion of the event log into a “case log” (i.e., an array of events for each process instance), computation of cycle time attributes for each case, and statistical analysis with Minitab.
4 Sample case: process improvement patterns assessment
We now apply our extended conceptual framework com- prising organizational objectives, PIOs, PIPs, and PIMs (cf.
Fig.5) as well as our research design to our sample appli- cation scenario. Further, we summarize our observations regarding the use of tools and systems for empirically ana- lyzing our sample process, which may be useful for further developments in this regard.
4.1 Organizational objectives
As discussed, obtaining clarity about the content and business value of organizational objectives constitutes a fundamental prerequisite to ensure the relevance of PIP assessment. In our sample application field (i.e., recruiting), organizations strive to fill vacant positions quickly, cost-effectively, and with suit- able candidates. To achieve these goals, personnel market- ing is responsible to generate a sufficient number of suitable applications, while the purpose of our sample process (i.e., managing job applications) is to convert applications into actual hires.
Thus, organizational objectives for the sample applica- tion scenario include reducing the time needed until open positions are filled, reducing cost per hire, and improving the quality of hired applicants. Out of this set of objec- tives, reducing cost per hire is well suited for illustrating our approach. In particular, the issue of cost is transferable to many other scenarios. More precisely, the following con- siderations apply for our sample process:
Reducing cost per hire as organizational objective The cost per hire key performance indicator captures the total
cost of both personnel marketing and applications manage- ment. While recruiting cost spent per application is propri- etary data, based on experiences from projects with clients we assume an amount of about 400 Euros. In our sam- ple scenario, generating and managing about 29,000 appli- cations per year would thus result in 11.6m Euros total cost, with cost per hire at around 4,000 Euros. Since hir- ing cost for talent in professional services will be higher than in, for example, manufacturing, this value corresponds well to the average of 4,285 USD reported as cost per hire for larger organizations by a benchmarking organization [25]. Further, it seems rather conservative considering that professional recruiting consultants commonly charge half a year’s salary for successful hires, depending on industry.
This calculation demonstrates the high relevance of reduc- ing cost per hire through an improved application handling process.
Note that while reducing cost per hire has been chosen to illustrate our approach, the other objectives remain highly relevant. In particular, they need to be kept in mind when designing PIMs to avoid improving the process toward one objective at the expense of others. As an example, improving recruitment cost should not result in eliminating face-to-face interviews with candidates since this would probably reduce cost at the expense of the quality of applicants hired.
4.2 Process improvement objectives (PIOs)
PIOs pertain to characteristics of the business process that affect the organizational objectives we want to improve on.
They serve as a “shortcut” to facilitate discussing the business value of PIMs without reverting to high-level organizational objectives. In our sample case, we refine the organizational objective to reduce cost per hire in a step-by-step approach by asking the question what drives cost per hire or, subsequently, the resulting lower-level PIOs.
Figure 7 presents relevant aspects of the resulting tree structure: Initially, total cost per hire is driven by the cost associated with each process instance (i.e., with each individ-
ual application), and, since it is possible that multiple process instances are needed to fill one position, with the overall number of process instances required. Both aspects may be optimized to reduce cost per hire, but are still rather abstract and will not allow applying PIPs without further refinement.
On the one hand, cost per process instance is determined by the cost of production factors (e.g., the cost of employees’
working time or the cost of IT systems used) and the amount of effort spent on each process instance. Both drivers will occur in any tree of PIOs dealing with cost reduction. Fac- tor costs, however, are generally unsuitable as a PIO since they are not governed by process designers and managers.
Therefore, they cannot be subjected to process improvement efforts. Rather, they should be considered as a factor given externally which may affect assessment results. As an exam- ple, consider the impact of location decisions on labor costs.
Example 2 (The impact of factor costs on PIP evaluation) Particularly in large organizations, it is a common practice to bundle administrative business processes into “shared ser- vices organizations” [26]. In this context, labor costs con- stitute an important factor when deciding on the location of the shared services organization. In turn, this decision impacts considerations on the economic viability of process improvement measures. For example, when considering cap- ital investments to automate manual activities, like match- ing incoming payments on bank statements against invoices issued to customers, lower labor costs will increase the pay- back time of the investment, thus rendering its implementa- tion less attractive.
On the other hand, cost per process instance is determined by the quantity of production factors associated with each process instance. In our sample process, factors besides man- ual labor can be neglected, as will be the case for most admin- istrative business processes. Accordingly, reducing effort per process instance pertains to reducing manual processing effort. This PIO lies at the core of many PIPs commonly used in practice, such as task elimination, task automation, or knockout [2], and has thus reached a sufficient degree of refinement.
Besides reducing cost per process instance, cost per hire might be improved by reducing the number of process instances required over time. This option corresponds to the elimination of in-efficacious process instances that do not terminate in a desirable state according to the underlying business objective. It closely resembles methods applied in common quality management approaches that aim at reduc- ing “causes of poor quality” [27]. In particular, every in- efficacious process instance can be viewed as a quality issue in the business process. Note that the overall effect of qual- ity management on cost and firm performance has been well recognized and empirically demonstrated [28]. This option is particularly interesting since associated measures
can often be implemented with limited investments. Hence, further considerations on our sample case will focus on this PIO.
In our sample case, cost per hire is driven by the general efficiency of the application management process, but also by the frequency of process instances terminating in one of the states marked as “critical” in Fig.3. The following con- siderations apply in this regard:
– Not approving a job offer after a successful interview may be caused by defective steering of capacities (i.e., job vacancies), defective communication of terms to be offered, or defective review of application documents.
– Job offers declined by applicants mostly means that the applicant does not approve of conditions offered, did not have a good impression during the application process, or has decided to take another job offer.
Since terminating the process in these states means that significant effort has been incurred while still failing to hire a promising candidate, organizational objectives are clearly violated: On average, only one out of six applications will successfully pass interviews. However, considering critical cases with defective termination events (cf. Fig.3), only one out of ten applicants can be hired. In other words, if the process enactment defects lined out could be fully eliminated, only about 18,000 applications would have to be acquired and managed to cover demand. This would reduce total hiring cost by about 4.6m Euros.
Based on the considerations made above, we focus on PIOs to reduce effort per process instance or to reduce the probability of the defective process outcomes described.
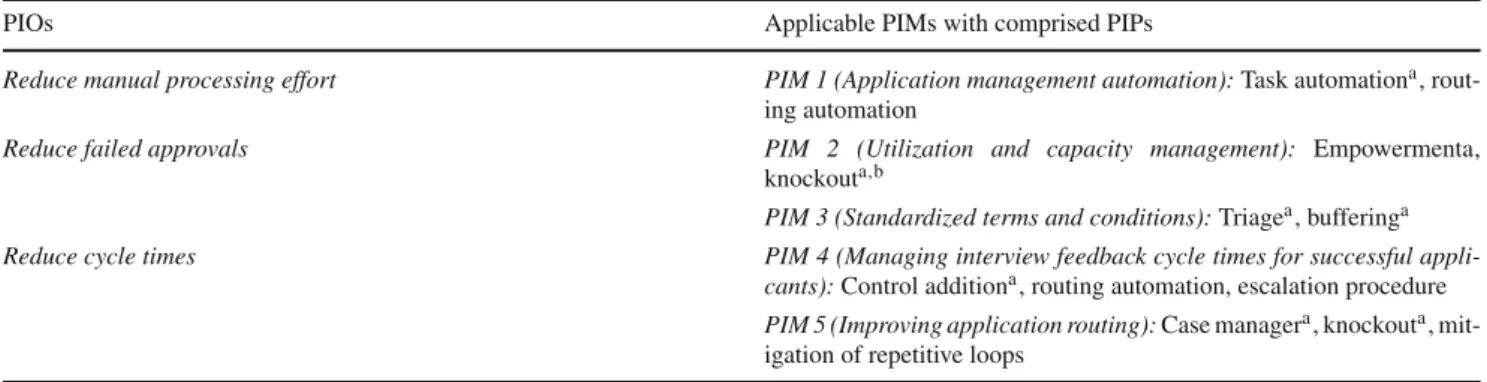
Table1summarizes the resulting topics.
Note that for the first PIO (i.e., Reduce manual processing effort) there is an evident link to our organizational objective of reducing cost per hire. However, the second and third PIOs (i.e., Reduce failed approvals and Reduce cycle times) are based on hypotheses on what can be done to reduce process enactment defects affecting the organizational objec- tive. Accordingly, they require qualitative or quantitative evi- dence to corroborate their relevance for reducing defects and thus improving cost per hire.
For the second PIO (i.e., Reduce failed approvals), we obtained qualitative evidence by interviewing responsible managers, which confirmed the topics described in Table1.
Since the reasons for failed approvals are not captured in the PAIS used to manage the application process, quantitative evidence is not available.
For the third PIO (i.e., Reduce cycle times), the causal link to its underlying defect of applications withdrawn by candidates is not as obvious. Further quantitative analysis is thus required. Figure8summarizes the duration between interviews and job offers for the subsets of applicants accept-
Table 1 Sample case: process
improvement objectives PIOs Rationale
Reduce manual processing effort Emerging potentials in terms of reducing process enactment effort per instance should be addressed
Reduce failed approvals Final approval of job offers by senior management fails if there are issues regarding vacancy management, reconciliation of terms, or checking of documents. The probability of these “late defects”
should be addressed
Reduce cycle times The probability of applicants’ obtaining and taking alternative job offers increases with time. Therefore, cycle times between applications being received and job offers made should be as short as possible
Fig. 8 Boxplot Duration interview to job offer in weeks vs. acceptance of job offers
ing and declining their offer in a boxplot (this part of total cycle time will later be the subject of process improvement, cf. Sect.4.3). In the figure, the differences between subsets regarding quartiles, median, and mean values appear as rela- tively small. However, a correlation between cycle times and the probability of a candidate to accept or decline a job offer can be statistically demonstrated
Correlation between job offers declined and cycle times We want to determine whether there is a significant influence of cycle time between application receipt and job offer in weeks on the probability of an applicant accepting or declin- ing a job offer. Accordingly, we use a binary logistic regres- sion test to evaluate the influence of a metric independent variable on a binary dependent variable. For this test, we use a sample of 2,721 job offers representing about 70 % of the annual volume (cf. Fig.3) and consisting of instances fully covered in the PAIS (not all interviews and feedbacks are
documented in the PAIS). The sample contains 261 cases where the job offer was eventually declined by the applicant.
This is the latest point in the process where withdrawal by the applicant is possible, and a significant amount of effort will have been spent on each respective case. The two samples are independent from each other and have a size of more than 100 cases each. Thus, the binary logistic regression can be applied.
Figure9shows an excerpt from the output of the statisti- cal software package we used (Minitab). The p-value of less than 0.05 indicates sufficient evidence to assume a signifi- cant correlation between the occurrence of withdrawal and cycle time. Regarding the question whether this correlation can be interpreted as a causal link of cycle times impacting the probability of withdrawal, the following considerations apply:
– Cycle time is measured between receipt of the application and the ultimate feedback to the candidate, whereas the withdrawal sample refers to candidates that declined a job offer thereafter. An impact of the occurrence of a withdrawal on cycle time can therefore be ruled out.
– There is a plausible explanation for longer cycle times causing withdrawals: It is possible that candidates find another job while waiting for feedback after an interview.
This explanation is substantiated by data on withdrawal reasons collected for a sample of 51 withdrawals between October 2013 and January 2014 for one business unit. The sample covers only cases where a reason was given for the withdrawal. In 33 out of 51 cases, the reason cited was a job offer by a third party, and we may assume that longer cycle times provide more opportunities for candidates to find alternative employment.
Fig. 9 Minitab output excerpt:
binary regression test Logistic Regression Table
Odds 95% CI
Predictor Coef SE Coef Z P Ratio Lower Upper
Constant -2.58986 0.169500 -15.28 0.000
Duration_weeks 0.144378 0.0635831 2.27 0.023 1.16 1.02 1.31
P-Value:Probability of duration notbeing a
relevant factor
Odds Ratio: Lowering duration by one week expected to reduce withdrawal risk by 16%
Table 2 Defining process improvement measures for process improvement objectives
PIOs Applicable PIMs with comprised PIPs
Reduce manual processing effort PIM 1 (Application management automation): Task automationa, rout- ing automation
Reduce failed approvals PIM 2 (Utilization and capacity management): Empowermenta,
knockouta,b
PIM 3 (Standardized terms and conditions): Triagea, bufferinga
Reduce cycle times PIM 4 (Managing interview feedback cycle times for successful appli-
cants): Control additiona, routing automation, escalation procedure PIM 5 (Improving application routing): Case managera, knockouta, mit- igation of repetitive loops
aProcess redesign practices comprised in [2]bAccording to [2], knockout decisions should be ordered “in a decreasing order of effort and in an increasing order of termination probability”. Since this would contradict the goal to knock out respective instances with as little effort as possible, we assume that knockout decisions should be arranged in reversed order
– We discussed potential additional independent variables with a positive effect on both cycle times and the proba- bility of withdrawal with HR management and obtained no evidence on such variables. HR managers even men- tioned that particularly sought-after candidates, who can be expected to quickly obtain alternative job offers, are handled with higher priority by business units. This effect might even “hide” part of the correlation between cycle times and probability of withdrawal. However, quantita- tive evidence on this issue is not available.
According to the “odds ratio” column, a 1-week delay can thus be expected to increase the probability of an applicant declining a job offer by 16 %.
The significant correlation between cycle times and the probability of withdrawal did not become obvious when just considering median and mean values, but only when execut- ing the binary logic regression test. This observation stresses the necessity to use both sufficient sample sizes and appro- priate statistical methods when dealing with empirical data on business process enactment.
4.3 Process improvement measures (PIMs)
PIPs relevant to our application scenario have been selected by considering a “longlist” of known PIPs in terms of poten- tial contributions to the PIOs described above. In our case, the “longlist” comprised PIPs from a framework by Rei- jers and Limam Mansar on process redesign practices [2]
(these are marked with an asterisk “*”) as well as from our ongoing research on improving business process quality [4,29]. However, organizations are not limited with regard to the sources of PIPs that can be used. PIOs are thus used as a mental technique to guide the identification of patterns that are useful for the organization. Relevant PIPs are then bundled into PIMs specific to the application sce- nario.
Table2summarizes PIOs and corresponding PIMs as bun- dles of PIPs.
In actual design and implementation projects, it is com- mon to document and track individual PIMs through mea- sure cards. In the following, we describe the PIMs from Table2in more detail using this metaphor. For each PIM, we give a short content description—with PIPs involved marked as italic—and additional details on the following issues:
– Implementation describes steps required to realize the measure.
– Business value appraises the expected implications con- sidering the impact on PIOs as well as implementation effort.
– Stakeholder verification describes the results of vali- dating the PIM through interviews with respective stake- holders.
Note that the PIMs presented here are, by definition, spe- cific to our application scenario. However, their structure as well as the underlying methodology is generally applica- ble. In terms of content, they exemplify issues commonly found in business process improvement projects, such as the evaluation of IT implementation effort. Moreover, beyond the scope presented here, actual measure cards comprise additional information relevant to project management. This includes project planning, project organization, key mile- stones with “traffic light” status, risks, next steps, and deci- sion requirements. Reporting on measure cards usually takes place in steering committee meetings of senior manage- ment.
PIM Card 1 (Application management automation) Our sam- ple process contains manual activities which might be automated using the PAIS. This pertains to the Assign contact partner and Plan interview tasks enacted by the recruiting function. According
to the recruiting statistics presented in Fig.3, these tasks occurred in 12,096 and 6,995 process instances, respectively. In this regard, further automation could be achieved by using master data already available in the PAIS.
Implementation. The manual assignment of an interview partner might be eliminated by implementing routing automation instead.
Each process instance in the PAIS is assigned to a job adver- tisement. This is done either by the candidate when entering his application data via a web platform provided by an external ser- vice provider, or by the recruiting function. Since each job ad refers to a set of business unit contact partners, these data might be used to implement routing automation. However, automating the assignment of contact partners requires implementing tight control over master data quality to ensure that appropriate con- tact partners are maintained for all job ads. Currently, this topic remains challenging due to the quantity of job ads, which are specific to service, location, degree of job experience, and other factors.
In addition, the Plan interview task might be automated by replacing the verbal feedback on candidates given by business units with structured data including the relevant interview partner.
In this case, however, each job ad should be assigned to only one business unit contact partner in order to avoid the need of coordi- nating feedback from multiple sources.
Business value. The manual effort involved in routing an applica- tion to a contact partner is estimated to be about 5 minutes by the head of recruiting. Accordingly, about 90 routings can be handled in one working day, resulting in a capacity reduction potential of 0.7 full-time equivalents (FTEs) for about 12,000 routings per year. This would amount to about 49,000 Euros annual cost sav- ings. Implementation of automated routing (including the required function of defining deputies for contact partners) is estimated to require about 20 consultant days at a cost of 21,800 Euros. In addition, the necessary master data cleanup of currently about 400 job ads is expected to take about 150 person days includ- ing project setup and reconciliation with business units, corre- sponding to 52,500 Euros one-off cost. Moreover, implementing a workflow to ensure future master data quality when defining job ads is expected to require 35 consultant days at a cost of 38,150 Euros.
Implementing automated interview planning builds on the improved quality of contact partner master data and would require an additional 10 consultant days or 10,900 Euros to implement the required structured interview partner feedback. Interview coordi- nation is currently estimated to take about 15 minutes per process instance, corresponding to 1.1 FTEs or 77,000 Euros annual cost.
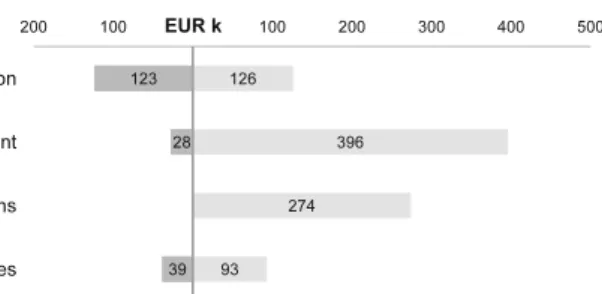
In total, recurring annual cost savings of 126,000 Euros are to be matched against one-off implementation cost of 123,350 Euros.
Stakeholder verification. When discussing this measure with stakeholders, the required change to the assignment of contact partners to job ads proved as the most challenging issue. In par- ticular, the definition of location-specific job ads raises concerns with stakeholders that this might lead to candidates applying for multiple job ads simultaneously. With regard to the current policy of defining job ads, the implementation decision on this measure card was postponed to late 2013, because the organization plans to re-examine its entire set of job ads with the goal of substantial reduction. Stakeholders assume that this will improve the “cus- tomer experience” of candidates. However, it would require to retain manual assignment of contact partners based on applica- tion documents. Note that, counterintuitively, in this case sim- plification of master data would thus lead to increased manual effort.
PIM Card 2 addresses the reduction in failed approvals as one of the critical cases identified in Fig.3.
PIM Card 2 (Utilization and capacity management) Among other reasons, senior managers refuse to approve job offers when the business unit that wants to hire a candidate has excess capacity.
In our case, this can be traced by monitoring personnel utiliza- tion, i.e., the rate of hours booked on client projects. If utilization falls below a certain level, there are not enough client projects for present staff, i.e., there is excess capacity. While refusal rea- sons are not tracked in the PAIS, stakeholder interviews resulted in an estimate of about 30 % of total refusals to be caused by this issue. Since candidates’ qualifications, in particular in gradu- ate recruiting, are mostly not specific to particular business units, the recruiting department can be empowered to route applications to more appropriate teams from the start on. This results in an early knock out of applications that would, in the end, be declined because of low utilization.
Implementation. To enable utilization-based routing decisions, a new report on utilization per team must be integrated into the application management workflow. Since relevant data are avail- able and are routinely retrieved for other reporting processes, implementation effort has been estimated to be 25 consultant days or 27,500 Euros. In addition, relevant utilization thresholds must be agreed and communicated. The recruiting center routes about 12,000 applications per year. If the additional operating effort for the utilization check can be assumed to be 10 minutes per appli- cation, this results in an overall additional capacity requirement of about 1.2 full-time equivalents (FTEs), amounting to approxi- mately 84,000 Euros annual cost.
Business value. The PIM is expected to reduce the “late refusal”
rate by about 30 % or 120 cases per year. Assuming a rate of job offers declined by the applicant of 7 % (cf. Sect.4.2), this would reduce the number of applications to be generated and managed to achieve a constant volume of hires by about 1,200 per year.
As we assumed the cost per application to be about 400 Euros, an annual savings potential of 480,000 Euros compares to 27,500 Euros one-off cost and 84,000 Euros operating expenditure per year.
Stakeholder verification. When discussing the PIM with senior stakeholders, its business value appeared as rather clear. How- ever, the distribution of utilization data emerged as a “political”
issue. Considering present organizational culture, the PIM will not be implemented right away, but the basic capability to add uti- lization control functionality to the PAIS will be included with the requirements definition for the new PAIS solution to be completed by early 2013.
The abbreviated measure cards presented above exem- plify how PIM implementation benefits can be projected and matched against expected implementation effort. However, beyond this quantitative reasoning, qualitative (or “political”) topics may play a role in taking implementation decisions as well, as will be exemplified with PIM Cards 3 and 4.
PIM Card 3 (Standardized terms and conditions) In our sam- ple process, extending contract offers to successful candidates requires final senior management approval. This pertains not only to the candidate, but also to the terms and conditions offered. In
this regard, salaries are of particular importance, since this topic is often discussed with the candidate during the interview or in a follow-up conversation. In some cases, this leads to senior man- agement approval not being granted because of terms that have been offered to candidates in verbal agreements. Again, refusal reasons are not tracked in the PAIS, but this issue is estimated to cause about 25 % of refusals. To remedy this topic, binding stan- dard terms and conditions could be made available to business unit interview partners. This would implement the information buffering PIP since information is provided upfront and does not need to be actively obtained by contact partners. In addition, an additional process step of discussing potential terms in advance between HR and the business unit might be included for partic- ularly relevant candidates (e.g., applicants with job experience).
This would implement the triage PIP since it would include an additional task for some cases.
Implementation. Implementation of this PIM might be achieved by organizational measures without changes to the underlying PAIS, since the upfront discussion of potential conditions can be included in the existing workflow between HR and the business unit. Figure10presents the corresponding change to the underly- ing process model.
Note that without implementing additional workflow activities or status codes, this change could not be ascertained by process mining. The number of interviews on manager level is available in the data sample and makes up 5.9 % of total volume. Contact part- ners estimate that about the same relevant volume will be caused by other candidates. Accordingly, approximately 3,200 discus- sions on terms would have to be conducted annually. Assuming that about 10 discussions can be handled in one working day by HR, this results in an additional required capacity of 1.8 FTEs at about 126,000 Euros cost per year. Additional effort on part of the business unit is not considered. Finally, the cost of compil- ing and communicating standardized terms and conditions can be neglected.
Business value. The PIM is expected to reduce the “late refusal”
rate by about 25 % or 100 cases per year, with an annual savings potential of 400,000 Euros according to the calculation presented with PIM 2, in comparison with 126,000 Euros additional operat- ing expenditure per year.
Stakeholder verification. The proposition of fully standardized terms and conditions raised concerns with stakeholders that this loss in flexibility might negatively impact chances to win candi- dates. However, due to privacy regulations, no empirical evidence regarding the impact of terms and conditions (namely, salaries) on the probability of candidates to accept contract offers could be obtained. Therefore, the decision to implement this PIM was postponed until conclusions from an internal confidential assess- ment are available, which will be additionally reconciled with an HR consultancy.
PIM Card 4 addresses the Reduce cycle times PIO by deal- ing with one of the underlying drivers for unnecessarily long cycle times.
PIM Card 4 (Managing interview feedback cycle times for successful applicants) The time span between successful inter- views and job offers can be reduced by implementing a control addition. This means that additional control flow elements are included to ensure the correct enactment of the process. Triggered
through routing automation, the recruiting department will call the interviewer directly when feedback is not available five busi- ness days after an interview. If the interviewer cannot be reached within two business days, an escalation procedure will take place by calling the respective supervisor. If no feedback can be obtained through these PIPs within ten business days, a letter of refusal will be sent.
Implementation. To implement the PIM, comprehensive tracing of interview dates and an additional workflow with corresponding triggering mechanisms must be implemented in the PAIS. This results in an estimated cost of approximately 38,500 Euros for 35 consultant days. In the data sample used for the binary regres- sion test (cf. Sect.4.2), about 51 % of cases would fall under the proposed regulations. Thus, a total volume of 7,000 interviews conducted annually (cf. Fig.3) would result in about 3,600 esca- lation procedures. On the one hand, this number can be expected to decline over time. On the other hand, multiple phone calls might become necessary for one escalation case. Hence, we assume that 20 escalation procedures can be handled in one person day, i.e., an additional 0.9 FTEs are required, resulting in about 63,000 Euros annual cost.
Business value. Based on our binary logical regression analysis (cf. Sect. 4.2), we reconciled with stakeholders that the maxi- mum interview feedback time can be reduced to 2 weeks based on an escalation process. Applying the corresponding odds ratio (cf. Sect.4.2) to all cases in our sample exceeding this time- frame results in a reduction of 39.2 cases of “late withdrawals”
(cf. Fig.3). This would reduce the number of applications to be generated and managed by about 390 per year, corresponding to 156,000 Euros in annual savings. Considering additional operat- ing expenditures of 63,000 Euros results in a total annual cost reduction of 93,000 Euros versus a one-off cost of 38,500 Euros.
Stakeholder verification. During stakeholder interviews, we val- idated implementation cost with the application workflow admin- istrator, additional processing effort at the recruiting center with the head of recruiting, and overall viability of the new process with the head of recruiting and the business unit HR partner. The esca- lation procedure to provide timely feedback was challenged by the business unit HR partner, but not by team managers. Final consent on the positive business value of the PIM could be achieved by discussing the quantitative analysis of the underlying PIO.
The final PIM we identified exemplifies an issue that occurs regularly in a top-down approach as employed in our case: Since it is possible that similar PIPs can be used to address various PIOs, overlaps in PIMs content may emerge.
This topic needs to be considered in implementation planning and when consolidating recommended PIMs into a “manage- ment summary” view (e.g., in terms of overall implementa- tion cost and cost savings potentials). In general, it is prefer- able to consolidate corresponding PIMs into one overall PIM addressing multiple PIOs. However, even in this case, the top- down approach facilitates obtaining a clear overall picture of potentials to be realized by PIP implementation.
PIM Card 5 (Improving application routing) Similar to PIM 1, Application Management Automation, this PIM deals with the implications arising from defects in application routing.