Business Process Models
?Markus Hipp1, Achim Strauss2, Bernd Michelberger3, Bela Mutschler3, and Manfred Reichert2
1 Group Research & Advanced Engineering, Daimler AG, Germany markus.hipp@daimler.com
2 Institute of Databases and Information Systems, University of Ulm, Germany {achim.strauss,manfred.reichert}@uni-ulm.de
3 University of Applied Sciences Ravensburg-Weingarten, Germany {bernd.michelberger,bela.mutschler}@hs-weingarten.de
Abstract. Enterprises are facing increasingly complex business pro- cesses. Engineering processes in the automotive domain, for example, may comprise hundreds or thousands of process tasks. In such a scenario, existing modeling notations do not always allow for a user-friendly pro- cess visualization. In turn, this hampers the comprehensibility of business processes, especially for non-experienced process participants. This paper tackles this challenge by suggesting alternative ways of visualizing large and complex process models. A controlled experiment with 22 subjects provides first insights into how users perceive these approaches.
Key words: process visualization, user experiment, visual design
1 Introduction
Enterprises are facing increasingly complex business processes [1]. Engineering processes in the automotive domain [2], for example, may comprise hundreds or thousands of process tasks.
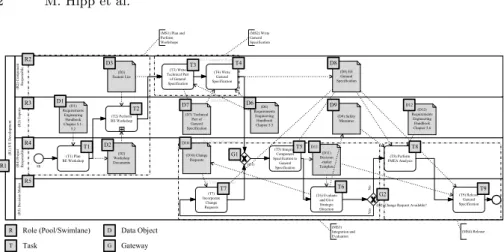
Consider Figure 1 showing a BPMN model of a (simplified) requirements engineering process from the automotive domain. Note that the example only serves for illustration purposes. The process involves roles E/E Development (R1),Component Responsible (R2),Expert (R3),Project Responsible (R4), and Decision Maker (R5). It further comprises 9 tasks (T1-T9), related to the prepa- ration, writing and validation of a requirements specification, and 12 data ob- jects (D1-D12) associated with them. Even this simplified process model reveals significant weaknesses regarding its visualization:
– Positioning of data objects:Usually, data objects are positioned right next to process tasks or between them [3]. However, such positioning might mislead
?This research was conducted in the niPRO project funded by the German Federal Ministry of Education and Research (BMBF) under grant number 17102X10.
(R1) E/E Development (R3) Experts
(R3) Experts
(T2) Perform RE Workshop (D1)
Requirements Engineering Handbook Chapter 5.1- 5.2
(D7) Technical Part of General Specification
(D9) Safety Measures (D6)
Requirements Engineering Handbook Chapter 5.5
(D12) Requirements
Engineering Handbook Chapter 5.6 (R2) ComponentResponsible
(R2) Component Responsible (T3) Write
Technical Part of General Specification
(T4) Write General Specification (D3)
Feature List
(D8) EE General Specification
(R4) ProjectResponsible
(R4) Project Responsible
(T1) Plan RE Workshop SE
(T5) Integrate Component Specification to General Specification
(T8) Perform FMEA Analysis (D11)
Decision -maker Template (D10) Change
Requests (D2)
Workshop
Documents (G1)
(R5) Decision Maker (R5) Decision Maker
(T6) Evaluate and Give Strategic
Direction (G2) Change Request Available?
(T7) Incorporate
Change Requests
(T9) Release General Specification (MS1) Plan and
Perform Workshops
(MS2) Write General Specification
(MS3) Integration and Evaluation
(MS4) Release
YesNo
R1 R2
R3
R4
R5
T1 T2
T3 T4
T5
T7 T6
T8
T9 D1
D3
D2
D7 D6
D8
D9
D10 D11
D12
R Role (Pool/Swimlane) T Task
D Data Object
G1
G2
G Gateway
Fig. 1. Example of a requirements engineering process.
users; e.g., D7 is positioned within swimlaneR3 although D7 is not related toR3. Note thatD7 is only linked toT3 andT4 contained inR2.
– Data object relations: Data objects can be related with more than one process task. In turn, this might lead to “long distance” data relations (i.e., dotted arrows) decreasing model comprehensibility [4]. For example, D8 is related to five process tasks, resulting in five data relations.
– Intersections: Sequence and data flows might overlap. Furthermore, data objects and process tasks may be overlapped by data relations (see D11 in Fig. 1). In general, such intersections affect the model’s comprehensibility [5].
Regarding large process models, these drawbacks might significantly affect a model’s comprehensibility [5] and aesthetic appearance [6]. To remedy this drawback, this paper presents four different concepts aiming at a user-friendly visualization of process models. Section 2 discusses requirements for visualizing process models. Section 3 then presents four visualization concepts and Section 4 related results from a controlled experiment. Section 5 discusses related work and Section 6 concludes the paper with a summary.
2 Requirements
This section summarizes major requirements regarding the comprehensibility as well as aesthetic appearance of process models. These requirements were derived in the context of two case studies in the automotive and healthcare domain [7, 8].
Their generalizability was confirmed by a literature study [9]. Finally, Table 1 summarizes the derived requirements.
2.1 Process Model Comprehensibility
Process model comprehensibility is crucial with respect to the quality of pro- cess models [5]. Important factors influencing the comprehensibility of process
models include its size as well as the degree of sequentiality, concurrency, den- sity, and structure [10, 11]. Concerning large and complex process models, two requirements are particularly relevant.
Sequence Flow: The sequence flow determines the order of process tasks in a process model and should be visualized in a comprehensible manner.
Clarity: Users should be able to get a quick overview of a process model. In particular, its visualization should enhance the clarity of process models.
2.2 Aesthetic Appearance
Humans are confronted with a continuously growing amount of visual infor- mation and, therefore, tend to become more intolerant to non-aesthetic one.
Hence, aesthetic appearance significantly influences the acceptance of user in- terfaces [12]. Our case studies and literature study confirm the importance of aesthetic process model visualizations, especially with respect to two issues:
Interest: To increase their aesthetic appearance, process models must be visu- alized in an interesting manner as humans are more attracted to visualizations being different from what they already know [13].
Stimulation: People always grasp at developing personal knowledge and skills [13]. The aesthetic appearance of process models should stimulate these goals.
2.3 Further Requirements
Simplicity: The complexity of a process model has a significant negative in- fluence on its comprehensibility [10] as well as its aesthetic appearance [12].
Therefore, the visualization of process models must be intuitive and simple.
Appeal: The graphical representation of a process model should support the user’s perception of the entire process. In particular, users should feel comfortable when working with process models in order to foster their willingness to reuse the models later on [13]. To achieve this goal, the visualization of process models should be appealing.
Structure: Mendling et al. [5] state that small variations in process mod- els might lead to significant differences in respect to their comprehensibility.
Amongst others, the structuring of a process model was identified as a factor positively influencing comprehensibility and aesthetic appearance [6].
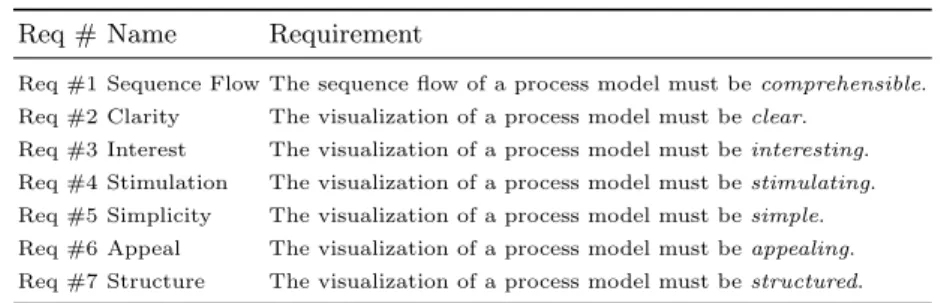
Req # Name Requirement
Req #1 Sequence Flow The sequence flow of a process model must becomprehensible.
Req #2 Clarity The visualization of a process model must beclear.
Req #3 Interest The visualization of a process model must beinteresting.
Req #4 Stimulation The visualization of a process model must bestimulating.
Req #5 Simplicity The visualization of a process model must besimple.
Req #6 Appeal The visualization of a process model must beappealing.
Req #7 Structure The visualization of a process model must bestructured.
Table 1.Overview on requirements.
3 Process Visualization Concepts
This section presents and discusses different concepts for visualizing process models: theBubble,BPMN3D, Network, andThin Line concepts [14]. In order to ensure same conditions and foster readability, the visualization concepts are presented along an abstract process model (cf. Fig. 2) including nine tasks (A-I).
Due to space limitations, this process model is rather simple. In our evaluation (cf. Sec. 4), participants deal with models of different sizes and complexity.
Pool
Pool Task A
Task B
Task D Task G
Task C
Task E Task I
Task F
Task H D1
D2 D3
D4 D5
D6 D7
D8
Fig. 2. Running example.
3.1 Bubble Visualization Concept
The first visualization concept, calledBubble, does not use common shapes like rectangles and hexagons. Instead, it is inspired by a node-oriented network rep- resentation. Figure 3 showsBubbleas applied to our running example. Unit-size circles are used to represent process tasks in an appealing, but simple manner (Req #6). In particular, circles are graphically better distinguishable from rect- angular document icons representing data objects [6]. Thus, data objects can be easier identified in the process model providing a better overview (Req #2) and structure (Req #7). In turn, data objects are presented using document
icons. Arrows are used to model both the sequence and data flow (Req #1).
The concept uses symbols for gateways and events that are similar to the ones known from BPMN. Task labels are added to the task’s edge. Finally, additional information may be accessed using the plus and gearwheel buttons, e.g., to detail task descriptions.
Fig. 3. Bubble visualization concept.
3.2 BPMN3D Visualization Concept
BPMN3Daims to use standard BPMN elements, but “outsources” the visualiza- tion of data objects into a third dimension (cf. Fig. 4). This concept is inspired by already existing approaches, e.g., provided in [15]. In particular, process tasks, events and sequence flows are represented through common BPMN elements on a common two-dimensional plain, whereas the presentation of data objects re- quires a third dimension. More precisely, BPMN3D extends every process task with a pole, pointing to the third dimension, which is then mapped to the 2- dimensional visualization. Data objects are aligned to these poles in terms of circles. In turn, icons indicate the type of the data objects (e.g., pdf files, office files, images). Applying this concept, data objects appear to be more indepen- dent from the actual sequence flow. This improves the structure of the process model (Req #7) and its overview (Req #2).
3.3 Network Visualization Concept
LikeBubble, theNetwork concept constitutes a network representation (cf. Fig.
5) (cf. Reqs #3 and #4). Each process task is represented through a node and comprises a small, centered circle (calledcore) as well as thegalaxy. The latter offers space forreferences, which may be used to connect a node to other nodes, data objects, or roles. To reduce complexity of the visualized process as well as mental load of the user, this concept focuses on single process tasks, i.e., single nodes. Only one node is dynamically emphasized as shown in Fig. 5 (Task E in
Fig. 4. BPMN3D visualization concept.
the example). Other nodes and corresponding references, data objects and roles are greyed out.Network provides a new way of visualizing process models (Req
#8).
Fig. 5. Network visualization concept.
3.4 Thin Line Visualization Concept
The goal ofThin Lineis to better structure the information displayed. The basic idea is to separate process tasks and sequence flows from data objects. This increases the overview of the process model and facilitates its comprehensibility (cf. Req #2 and Req #7). On one hand, users can focus on the sequence flow of the model. On the other, data objects are easily accessible in an explicit area below the sequence flow visualization (cf. Fig. 6). This approach can be considered as a minimalistic one with respect to process visualization. Both process tasks and sequence flow are represented through arrows, which results in a significant reduction of the amount of information displayed (Req #5). The title of a process task is displayed on top of each arrow. Further, additional elements for gateways and events are introduced. Finally, vertical lines guide the user to the area the related data objects are displayed. Table 2 shows the requirements addressed by each of the four visualization concepts.
Fig. 6. Thin Line visualization concept.
Concept Req#1 Req#2 Req#3 Req#4 Req#5 Req#6 Req#7
Bubble ++ ++ + + + ++ +
BPMN3D ++ ++ + - + + ++
Network - + ++ ++ - ++ +
Thin Line + - ++ ++ ++ + ++
++: addressed; +: partially addressed; -: not addressed Table 2.Requirements met by the visualization concepts.
4 Evaluation
We evaluate the four visualization concepts through a controlled experiment in- volving 22 subjects; 9 of them are students, 5 are working in academics, and 8 subjects stem from industry. In the experiment, all four visualization concepts are presented along various process models of different complexity. A question- naire is then used to collect data about the perception of the concepts. Part 1 of this questionnaire comprises questions concerning the subjects’ modeling ex- perience. In part 2 the subjects must rate each concept with respect to different variables using a five step Likert-scale. Possible answers range from “I totally agree (5)” to “I totally disagree(1)”. Finally, in part 3 subjects must evaluate each concept with an overall rating between 0 and 10. Table 3 summarizes the evaluated variables, which are derived from the presented requirements.
Research Questions Variables Source
Comprehensibility Overall Comprehensibility –
Sequence Flow Req #1
Clarity Req #2
Aesthetic Appearance Interest Req #3
Stimulation Req #4
Other Variables Simplicity Req #5
Appeal Req #6
Structure Req #7
Table 3.Measured variables.
4.1 Comprehensibility
BPMN3D is perceived as the most comprehensible concept (mean = 4.14; std dev =.834) withp= 0.047∗2 (cf. Fig. 7a), followed by Bubble (3.64/.790) and Thin Line (3.36/1.177). With (2.00/.926), Network performs worst. According to [5], this result is traceable since BPMN3D is most similar to BPMN. In turn, Network introduces new ideas to visualize process models.
Totally agree Agree Neutral Disagree Totally Disagree
(a) Comprehensibility
Totally agree Agree Neutral Disagree Totally Disagree
(c) Clarity Totally agree
Agree Neutral Disagree Totally Disagree
(b) Sequence Flow
BPMN3D Thin Line
Bubble Network BPMN3D Thin Line
Bubble Network BPMN3D Thin Line
Bubble Network
Fig. 7. Experiment results concerning comprehensibility.
Concerning thesequence flow (cf. Fig. 7b), again, BPMN3D is perceived as most comprehensible (4.59/.590) withp= 0.012∗. In turn, Bubble is rated with (3.91/1.065), followed by Thin Line (3.36/1.497) and Network (1.68/.945).
Theclarity of the visualization concepts shows similar results (cf. Fig. 7c).
Again, BPMN3D obtains significantly better ratings (4.05/.090) withp= 0.011∗ compared to Bubble (3.18/1.053) and Thin Line (3.18/1.181). Finally, Network (2.09/1.921) performs worst.
Altogether, BPMN3D is rated significantly better than the other concepts.
The ratings for comprehensibility (p = 0.047∗), sequence flow (p = 0.012∗), and clarity (p = 0.011∗) are significant. Thus, process models visualized with BPMN3D are perceived as significantly better comprehensible.
4.2 Aesthetic Appearance
Interestingly, Bubble is perceived as the most interesting concept (4.14/.834), although the difference to the other concepts is not significant with p= 0.109 (cf. Fig. 8a). BPMN3D receives the second highest rating (3.73/.827). Whether a visualization concept stimulates the subjects has been answered with simi- lar ratings (cf. Fig. 8b). Our evaluation with respect to aesthetic appearance, therefore, does not allow for general conclusions.
4.3 Other Variables
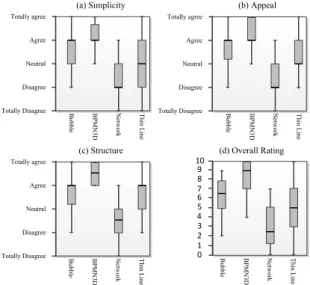
As can be seen in Figure 9a, BPMN3D is perceived as the mostsimple concept (4.0/.873) with p= 0.090, followed by Bubble (3.55/.858). Concerning appeal,
2 significant based on a 5% significance level. Significant results are marked with a *.
Totally agree Agree Neutral Disagree Totally Disagree
(b) Stimulation Totally agree
Agree Neutral Disagree Totally Disagree
(a) Interest
BPMN3D Thin Line
Bubble Network BPMN3D Thin Line
Bubble Network
Fig. 8. Experiment results concerning aesthetic appearance.
we receive similar results (cf. Fig. 9b). Again, BPMN3D is perceived as the most appealing concept (4.18/.795) with p= 0.185, followed by Bubble (3.86/.774).
BPMN3D is also perceived as the beststructured concept (4.41/.734) (cf. Fig.
9c), while Bubble (3.59/.908) and Thin Line (3.55/1.057) are rated second and third best in this category. Results are significant (p= 0.02∗).
10 9 8 7 6 5 4
1 3 2 0
(d) Overall Rating Totally agree
Agree Neutral Disagree Totally Disagree
(c) Structure
Totally agree Agree Neutral Disagree Totally Disagree
(b) Appeal Totally agree
Agree Neutral Disagree
Totally Disagree BPMN3D Thin Line
Bubble Network
(a) Simplicity
BPMN3D Thin Line
Bubble Network
BPMN3D Thin Line
Bubble Network
BPMN3D Thin Line
Bubble Network
Fig. 9. Experiment results concerning other variables.
4.4 Overall Rating
Subjects are asked to rate each concept concerning its overall impression (cf.
Fig. 8d). BPMN3D is rated with 9.18 out of 10 points (std dev = 1.868) and significantly better than the other concepts (p= 0.004∗). For 7 out of 9 variables, BPMN3D received the highest rating (with 5 significant results; cf. Tab 4).
Variable Best Rating p-Value
Comprehensibility BPMN3D 0.047∗
Sequence Flow BPMN3D 0.012∗
Clarity BPMN3D 0.011∗
Interest Bubble 0.110
Stimulation Bubble 0.879
Simplicity BPMN3D 0.089
Clearness BPMN3D 0.185
Structure BPMN3D 0.021∗
Overall Rating BPMN3D 0.004∗
* significant based on a 5% significance level.
Table 4.Results.
4.5 Discussion
Experimental results underline that the subject’s expertise might influence their opinion; e.g., [5] confirms that the amount of theoretical modeling knowledge influences the comprehensibility of process models. As Bubble also uses BPMN- like structures, its second highest overall rating fosters this assumption. Note that this paper focuses on visualization aspects, whereas interaction methods, which might also influence the comprehensibility of process models, are not discussed3. Visualization concepts for process models should combine well-known elements and structures from process model notations with few new ideas.
Our experiment further shows that distinguishing process tasks from data objects increases the comprehensibility of process models. BPMN3D, for exam- ple, uses a third dimension to visualize data objects. In turn, Thin Line displays process tasks and data objects in different areas. Finally, Bubble uses different visualizations for process tasks and data objects. All three concepts are consid- ered being well comprehensible.
To improve theinternal validityof the experiment, the visualization concepts are presented the same way. All concepts are applied to the same process model, i.e., the resulting visualizations present the same amount of information. In par- ticular, the visualization itself is the only varying factor. Finally, to all subjects, all visualization concepts are introduced in the same way. Regarding external validity, the chosen process model might be too small. Further, the fact that all subjects are experienced with BPMN might have influenced results.
5 Related Work
Personalized views on business processes are provided, for example, in [17, 18, 19]
based on abstraction and reduction techniques. In turn, [20] presents a visual- ization concept facilitating the management of large business process models
3 Research on process interaction can be found in [16].
through views with reduced complexity. All these approaches focus on technical issues, whereas issues related to the graphical representation of process artifacts (e.g., process tasks or data objects) are factored out. Various visualization con- cepts are provided in [21], which focus on visualizing traffic in process models, whereas [22] presents visualization concepts for time-aware process models. Fi- nally, niPRO enables advanced interactions based on a sophisticated navigation concept [16, 23, 24]. The 3D visualization of process models is addressed by [25] and [26], which enable collaborative process modeling in a 3D environment based on 3D avatars. In turn, [27] and [28] pick up a 2D process visualization as a starting point and derive a 3D visualization from it. Note that we applied this idea in the context of BPMN3D as well. Finally, [29] make use of process hierarchies to visualize complex process models on a small canvas, facilitating the presentation of information on different semantic levels.
6 Summary and Outlook
Enterprises use process model notations for visualizing business processes. How- ever, visualizations like BPMN tend to be not user-friendly, especially when process models become large and complex. This paper presented novel visual- ization ideas focusing on comprehensibility and aesthetic appearance of process models. We further evaluated these concepts in a controlled experiment. Results show that BPMN3D is considered being the most appealing visualization con- cept, since it combines well-known elements from BPMN with fresh ideas (e.g., a third dimension for data-objects). In future work, we will refine our visualization concepts and apply them in case studies in the automotive domain.
References
1. Weber, B., Reichert, M., Mendling, J., Reijers, H.A.: Refactoring large process model repositories. in: J Computers in Industry, pp. 467–486 (2011)
2. M¨uller, D., Herbst, J., Hammori, M., Reichert, M.: IT Support for Release Man- agement Processes in the Automotive Industry. in: BPM’06, pp. 368–377 (2006) 3. Recker, J.C.: Opportunities and constraints : the current struggle with BPMN. in:
J on Business Process Management 16(1), pp. 181–201 (2010)
4. Miers, D., Ph.D, S.A.W.: BPMN Modeling and Reference Guide - Understanding and Using BPMN. Future Strategies Inc. (2008)
5. Mendling, J., Reijers, H.A., Cardoso, J.: What Makes Process Models Understand- able? in: BPM’07, LNCS 4714, pp. 48–63 (2007)
6. Norman, D.A.: The Design of Everyday Things. The MIT Press (1988)
7. Hipp, M., Mutschler, B., Reichert, M.: On the Context-aware, Personalized Deliv- ery of Process Information: Viewpoints, Problems, and Requirements. in: ARES’11, pp. 390–397 (2011)
8. Michelberger, B., Mutschler, B., Reichert, M.: On Handling Process Information:
Results from Case Studies and a Survey. in: ER-BPM’11 Workshop, LNBIP 99, pp. 333–344 (2011)
9. Michelberger, B., Andris, R.J., Girit, H., Mutschler, B.: A Literature Survey on Information Logistics. in: 16th BIS’13, LNBIP 157, pp. 138–150 (2013)
10. Mendling, J., Moser, M., Neumann, G., Verbeek, H.M.W., Dongen, B.F.V.: Faulty EPCs in the SAP Reference Model. in: BPM’06, LNCS 4102, pp. 451–457 (2006) 11. Reijers, H.A., Mendling, J.: A Study Into the Factors That Influence the Under- standability of Business Process Models. in: J on IEEE Transactions on Systems, Man, and Cybernetics, Part A 41(3) (2011)
12. Birkhoff, G.D.: Aesthetic Measure. Cambridge Massachusetts University Press (1933)
13. Wright, C., P.: Funology - From Usability to Enjoyment. Human-Computer Inter- action Series 3. Springer (2003)
14. Strauss, A.: Information Visualisation in Process-Oriented Semantic Information Networks. Diploma Thesis, Ulm University (2012)
15. Effinger, P., Spielmann, J.: Lifting business process diagrams to 2.5 dimensions.
in: VDA 2010, 7530, pp. 75300 (2010)
16. Hipp, M., Michelberger, B., Mutschler, B., Reichert, M.: Navigating in Process Model Repositories and Enterprise Process Information. in: RCIS’14, IEEE (ac- cepted for publication) (2014)
17. Bobrik, R., Reichert, M., Bauer, T.: View-Based Process Visualization. in:
BPM’07, pp. 88–95 (2007)
18. Kolb, J., Kammerer, K., Reichert, M.: Updatable Process Views for User-centered Adaption of Large Process Models. in: ICSOC’12, LNCS 7636, pp. 484–498 (2012) 19. Reichert, M.: Visualizing Large Business Process Models: Challenges, Techniques,
Applications. in: TAProViz’12 Workshop, pp. 725–736 (2012)
20. Streit, A., Pham, B., Brown, R.: Visualisation support for managing large business process specifications, in: BPM’05, LNCS 3649, pp. 205–219 (2005)
21. Kriglstein, S., Wallner, G., Rinderle-Ma, S.: A Visualization Approach for Differ- ence Analysis of Process Models and Instance Traffic. in: BPM’13, LNCS 8094, pp. 219–226 (2013)
22. Lanz, A., Kolb, J., Reichert, M.: Enabling Personalized Process Schedules with Time-aware Process Views. in: HICS’13 WS, LNBIP 148, pp. 205–216 (2013) 23. Hipp, M., Michelberger, B., Mutschler, B., Reichert, M.: A Framework for the
Intelligent Delivery and User-adequate Visualization of Process Information. in:
SAC’13 Symp, ACM, pp.1383–1390 (2013)
24. Hipp, M., Mutschler, B., Reichert, M.: Navigating in Complex Business Processes.
in: DEXA’12, LNCS 7447, pp. 466–480 (2012)
25. Poppe, E., Brown, R., Recker, J., Johnson, D.: Improving Remote Collaborative Process Modelling using Embodiment in 3D Virtual Environments. in: APCCM’13, pp. 51–60, ACS 143 (2013)
26. Brown, R., Recker, J., West, S.: Using virtual worlds for collaborative business process modeling. in: J Business Process Management 17(3), pp. 546–564 (2011) 27. Sch¨onhage, B., van Ballegooij, A., Eli¨ens, A.: 3D Gadgets for Business Process
Visualization. in: WEB3D-VRML’00 Sym, pp. 131–138 (2000)
28. Effinger, P.: A 3D-Navigator for Business Process Models. in: TAProViz’12 Work- shop, pp. 737–743 (2012)
29. Seyfang, A., Kaiser, K., Gschwandtner, T., Miksch, S.: Visualizing Complex Pro- cess Hierarchies during the Modeling Process. in: TAProViz’12 Workshop, pp.
768–779 (2012)