J. T. McNeil,9J. Yelton,9J. Bennett,49I. Adachi,16, 12 K. Adamczyk,57 J. K. Ahn,37 H. Aihara,80 S. Al Said,74, 34 D. M. Asner,3 H. Atmacan,7V. Aulchenko,4, 60 T. Aushev,18R. Ayad,74 V. Babu,8 S. Bahinipati,21 P. Behera,23 M. Bessner,15T. Bilka,5 J. Biswal,31 A. Bobrov,4, 60 G. Bonvicini,85 A. Bozek,57M. Braˇcko,46, 31 T. E. Browder,15 M. Campajola,28, 52 L. Cao,2D. ˇCervenkov,5 P. Chang,56 V. Chekelian,47A. Chen,54B. G. Cheon,14K. Chilikin,41 K. Cho,36 S.-J. Cho,87 S.-K. Choi,13 Y. Choi,72 S. Choudhury,22D. Cinabro,85S. Cunliffe,8 S. Das,45 N. Dash,23
G. De Nardo,28, 52 R. Dhamija,22 F. Di Capua,28, 52 Z. Doleˇzal,5 T. V. Dong,10 S. Eidelman,4, 60, 41T. Ferber,8 B. G. Fulsom,62 V. Gaur,84N. Gabyshev,4, 60 A. Garmash,4, 60 A. Giri,22 P. Goldenzweig,32 B. Golob,42, 31 O. Grzymkowska,57Y. Guan,7 K. Gudkova,4, 60 C. Hadjivasiliou,62 K. Hayasaka,59 H. Hayashii,53 W.-S. Hou,56 C.-L. Hsu,73 K. Huang,56 K. Inami,51 A. Ishikawa,16, 12 R. Itoh,16, 12 M. Iwasaki,61 W. W. Jacobs,24 H. B. Jeon,39 S. Jia,10 Y. Jin,80 K. K. Joo,6 A. B. Kaliyar,75 K. H. Kang,39 G. Karyan,8 H. Kichimi,16 B. H. Kim,68 C. H. Kim,14
D. Y. Kim,71S. H. Kim,68 Y.-K. Kim,87 K. Kinoshita,7 P. Kodyˇs,5 T. Konno,35S. Korpar,46, 31 P. Kriˇzan,42, 31 R. Kroeger,49 P. Krokovny,4, 60 T. Kuhr,43R. Kulasiri,33 M. Kumar,45 K. Kumara,85Y.-J. Kwon,87K. Lalwani,45
S. C. Lee,39 J. Li,39L. K. Li,7Y. B. Li,63 L. Li Gioi,47 J. Libby,23 K. Lieret,43 Z. Liptak,15,∗ D. Liventsev,85, 16 C. MacQueen,48 M. Masuda,79, 65 T. Matsuda,50 D. Matvienko,4, 60, 41M. Merola,28, 52 F. Metzner,32 K. Miyabayashi,53R. Mizuk,41, 18 G. B. Mohanty,75 S. Mohanty,75, 83 T. J. Moon,68 R. Mussa,29 M. Nakao,16, 12
A. Natochii,15L. Nayak,22 M. Nayak,77 M. Niiyama,38 N. K. Nisar,3 S. Nishida,16, 12 K. Ogawa,59 S. Ogawa,78 H. Ono,58, 59 Y. Onuki,80 P. Oskin,41 G. Pakhlova,18, 41 S. Pardi,28 H. Park,39 S.-H. Park,87 S. Paul,76, 47 T. K. Pedlar,44 R. Pestotnik,31 L. E. Piilonen,84T. Podobnik,42, 31 V. Popov,18E. Prencipe,19 M. T. Prim,32
M. R¨ohrken,8 A. Rostomyan,8 N. Rout,23 G. Russo,52 D. Sahoo,75 Y. Sakai,16, 12 S. Sandilya,22 A. Sangal,7 L. Santelj,42, 31 V. Savinov,64 G. Schnell,1, 20 J. Schueler,15 C. Schwanda,26 Y. Seino,59 K. Senyo,86M. E. Sevior,48
M. Shapkin,27C. Sharma,45 V. Shebalin,15 J.-G. Shiu,56 F. Simon,47E. Solovieva,41 M. Stariˇc,31 Z. S. Stottler,84 J. F. Strube,62 M. Sumihama,11 T. Sumiyoshi,82 M. Takizawa,69, 17, 66 U. Tamponi,29 K. Tanida,30 Y. Tao,9 F. Tenchini,8 M. Uchida,81S. Uehara,16, 12 Y. Unno,14 S. Uno,16, 12R. Van Tonder,2G. Varner,15A. Vinokurova,4, 60 V. Vorobyev,4, 60, 41C. H. Wang,55 E. Wang,64 M.-Z. Wang,56 P. Wang,25M. Watanabe,59S. Watanuki,40E. Won,37
X. Xu,70 B. D. Yabsley,73 W. Yan,67 H. Ye,8 J. H. Yin,37 Z. P. Zhang,67 V. Zhilich,4, 60 and V. Zhukova41 (The Belle Collaboration)
1University of the Basque Country UPV/EHU, 48080 Bilbao
2University of Bonn, 53115 Bonn
3Brookhaven National Laboratory, Upton, New York 11973
4Budker Institute of Nuclear Physics SB RAS, Novosibirsk 630090
5Faculty of Mathematics and Physics, Charles University, 121 16 Prague
6Chonnam National University, Gwangju 61186
7University of Cincinnati, Cincinnati, Ohio 45221
8Deutsches Elektronen–Synchrotron, 22607 Hamburg
9University of Florida, Gainesville, Florida 32611
10Key Laboratory of Nuclear Physics and Ion-beam Application (MOE) and Institute of Modern Physics, Fudan University, Shanghai 200443
11Gifu University, Gifu 501-1193
12SOKENDAI (The Graduate University for Advanced Studies), Hayama 240-0193
13Gyeongsang National University, Jinju 52828
14Department of Physics and Institute of Natural Sciences, Hanyang University, Seoul 04763
15University of Hawaii, Honolulu, Hawaii 96822
16High Energy Accelerator Research Organization (KEK), Tsukuba 305-0801
17J-PARC Branch, KEK Theory Center, High Energy Accelerator Research Organization (KEK), Tsukuba 305-0801
18Higher School of Economics (HSE), Moscow 101000
19Forschungszentrum J¨ulich, 52425 J¨ulich
20IKERBASQUE, Basque Foundation for Science, 48013 Bilbao
21Indian Institute of Technology Bhubaneswar, Satya Nagar 751007
22Indian Institute of Technology Hyderabad, Telangana 502285
23Indian Institute of Technology Madras, Chennai 600036
24Indiana University, Bloomington, Indiana 47408
25Institute of High Energy Physics, Chinese Academy of Sciences, Beijing 100049
arXiv:2012.05607v2 [hep-ex] 10 May 2021
26Institute of High Energy Physics, Vienna 1050
27Institute for High Energy Physics, Protvino 142281
28INFN - Sezione di Napoli, 80126 Napoli
29INFN - Sezione di Torino, 10125 Torino
30Advanced Science Research Center, Japan Atomic Energy Agency, Naka 319-1195
31J. Stefan Institute, 1000 Ljubljana
32Institut f¨ur Experimentelle Teilchenphysik, Karlsruher Institut f¨ur Technologie, 76131 Karlsruhe
33Kennesaw State University, Kennesaw, Georgia 30144
34Department of Physics, Faculty of Science, King Abdulaziz University, Jeddah 21589
35Kitasato University, Sagamihara 252-0373
36Korea Institute of Science and Technology Information, Daejeon 34141
37Korea University, Seoul 02841
38Kyoto Sangyo University, Kyoto 603-8555
39Kyungpook National University, Daegu 41566
40Universit´e Paris-Saclay, CNRS/IN2P3, IJCLab, 91405 Orsay
41P.N. Lebedev Physical Institute of the Russian Academy of Sciences, Moscow 119991
42Faculty of Mathematics and Physics, University of Ljubljana, 1000 Ljubljana
43Ludwig Maximilians University, 80539 Munich
44Luther College, Decorah, Iowa 52101
45Malaviya National Institute of Technology Jaipur, Jaipur 302017
46University of Maribor, 2000 Maribor
47Max-Planck-Institut f¨ur Physik, 80805 M¨unchen
48School of Physics, University of Melbourne, Victoria 3010
49University of Mississippi, University, Mississippi 38677
50University of Miyazaki, Miyazaki 889-2192
51Graduate School of Science, Nagoya University, Nagoya 464-8602
52Universit`a di Napoli Federico II, 80126 Napoli
53Nara Women’s University, Nara 630-8506
54National Central University, Chung-li 32054
55National United University, Miao Li 36003
56Department of Physics, National Taiwan University, Taipei 10617
57H. Niewodniczanski Institute of Nuclear Physics, Krakow 31-342
58Nippon Dental University, Niigata 951-8580
59Niigata University, Niigata 950-2181
60Novosibirsk State University, Novosibirsk 630090
61Osaka City University, Osaka 558-8585
62Pacific Northwest National Laboratory, Richland, Washington 99352
63Peking University, Beijing 100871
64University of Pittsburgh, Pittsburgh, Pennsylvania 15260
65Research Center for Nuclear Physics, Osaka University, Osaka 567-0047
66Meson Science Laboratory, Cluster for Pioneering Research, RIKEN, Saitama 351-0198
67Department of Modern Physics and State Key Laboratory of Particle Detection and Electronics, University of Science and Technology of China, Hefei 230026
68Seoul National University, Seoul 08826
69Showa Pharmaceutical University, Tokyo 194-8543
70Soochow University, Suzhou 215006
71Soongsil University, Seoul 06978
72Sungkyunkwan University, Suwon 16419
73School of Physics, University of Sydney, New South Wales 2006
74Department of Physics, Faculty of Science, University of Tabuk, Tabuk 71451
75Tata Institute of Fundamental Research, Mumbai 400005
76Department of Physics, Technische Universit¨at M¨unchen, 85748 Garching
77School of Physics and Astronomy, Tel Aviv University, Tel Aviv 69978
78Toho University, Funabashi 274-8510
79Earthquake Research Institute, University of Tokyo, Tokyo 113-0032
80Department of Physics, University of Tokyo, Tokyo 113-0033
81Tokyo Institute of Technology, Tokyo 152-8550
82Tokyo Metropolitan University, Tokyo 192-0397
83Utkal University, Bhubaneswar 751004
84Virginia Polytechnic Institute and State University, Blacksburg, Virginia 24061
85Wayne State University, Detroit, Michigan 48202
86Yamagata University, Yamagata 990-8560
87Yonsei University, Seoul 03722
Using the entire data sample of 980 fb−1 integrated luminosity collected with the Belle detector at the KEKB asymmetric-energy e+e− collider, we present an amplitude analysis measuring the branching fractions of the Cabibbo-allowed, W-exchange resonant decay Ξ0c → Ξ0φ(→ K+K−) with a polarized φ and the non-resonant decay via a direct process Ξ0c → Ξ0K+K−. We present these measurements, relative to the normalization mode Ξ−π+, and find branching ratios
B(Ξ0c→Ξ0φ(→K+K−))
B(Ξ0c→Ξ−π+) = 0.036±0.004 (stat.)±0.002 (syst.) andB(ΞB(Ξ0c→Ξ0 0K+K−)
c→Ξ−π+) = 0.039±0.004 (stat.)±
0.002 (syst.) which suggest that only minor cusping peaks occur in the combinatorial background of Ω∗−→Ξ0K−due to these Ξ0cdecays.
I. INTRODUCTION
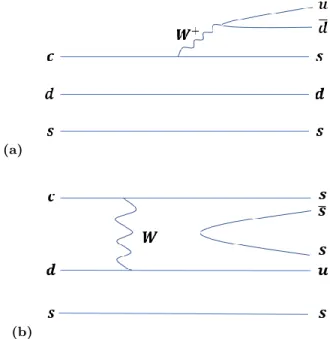
The most simple model of the Ξ0c(dsc) baryon non- leptonic decay occurs viac→stransitions into Ξ−π+ by way of an emittedW-boson. However, these decays may also occur via charged current (W-exchange) interactions between the quarks of the Ξ0c baryon. The most prob- able example of this decay is the Cabibbo-allowed W- exchange between thecd quarks, as shown in the decay diagrams of Fig. 1. In this type of decay the cdquarks exchange charge via the interactingW-boson and transi- tion intosuquarks respectively. Generally the remaining momentum from this decay escapes via an emitted gluon which immediately produces a quark-antiquark pair. For this work, we study the case in which the emitted gluon from theW-exchange decays into an s¯squark pair (s¯s- popping) throughcd→W+→su(g→s¯s).
(a)
(b)
FIG. 1: Decay diagrams depicting the non-leptonic, weak decay of Ξ0c →Ξ−π+ via an emittedW-boson(a) and the Cabibbo-allowedW-exchange,s¯s-popping decay of the Ξ0c →Ξ0K+K− which can resonate throughφ→K+K− (b).
∗now at Hiroshima University
Suchs¯s-popping decays are in general suppressed com- pared with the analogous light-quark popping decays but have more cleanly measurable final states. Other s¯s-popping decays have been measured, and in particu- lar by the Belle Collaboration the similar but Cabibbo- suppressed mode Ξ0c → ΛK+K− [1]. In this work we study the previously unobserved [2] Cabibbo-allowed mode Ξ0c→Ξ0K+K−and the fraction of this decay that resonates throughφ→K+K−.
One particular motivation for the study of these new Ξ0c decay channels is due to the recently discovered ex- cited Ω− baryon at Belle [3]. This excited Ω− was found in the Ξ0K−channel with an invariant mass of 2.012 GeV where for this work we use natural units withc= 1. From quark model predictions of heavy baryon excited states, there are good theoretical reasons to expect that this Ω− baryon may have a partner near 1.95 GeV [3, 4] and low- statistics indications of an excess in this region can be inferred. However, it is suspected that a Ξ0c decaying to Ξ0K+K−through a polarizedφ→K+K−could produce peaks in the Ξ0K± invariant mass spectra as well. These topological substructures are due to the helicity angles of the Ξ0c polarizing the φin the 1/2→1/2 + 1 resonant decay process [5]. Hence, the decay substructure of the Ξ0c →Ξ0K+K− must be studied to assure that any evi- dence of an excess in this region can be attributed to an excited Ω− candidate and not an artifact of these reso- nant decays.
The Belle detector and KEKB asymmetric e+e− col- lider collected the world’s largest sample of Υ(4S) energy data over a 1999−2010 run period with a total 980 fb−1 integrated luminosity for analysis across all energy ranges [6]. The Belle detector was a large, asymmetric detector hermetically consisting of six subdetectors. From inner- to-outermost subdetector, the Belle detector included the following components.
For charged particle tracking, four innermost layers of double-sided silicon strip vertex detectors surrounded the beryllium beam pipe encased by a 50-layer central drift chamber (CDC). These tracking detectors were asymmet- rically oriented in thez-axis to assure optimal solid angle coverage with respect to the interaction point (IP). For charged particle identification (PID), definedL(x:y) = Lx/(Lx+Ly) for likelihoodsLiof identifying the charged particlesp,π, andK; along withdE/dxmeasurements in the CDC, Belle included two subdetectors. The aerogel Cherenkov counters (ACC) were located along the barrel and outer, large solid angle of the CDC, and the time-of- flight counters were positioned just outside of the ACC
with respect to the barrel. For electron andγ detection via electromagnetic showers, along the entire Belle detec- tor 23o< θ <139o solid angle, CsI(Tl) crystals comprised the electromagnetic calorimeter (ECL). Outside the 1.5 T solenoid coil, the remaining subdetectors included lay- ered resistive plate counters with iron yoke for muon and KL detection [7, 8].
II. RECONSTRUCTION
Event reconstruction for this analysis is performed en- tirely in the Belle II Software Framework by converting Belle data structures to Belle II data structures [9, 10].
Background to the reconstructed invariant mass distri- bution of the Ξ0K+K− signal is in large part due to combinatorics and clone hyperon reconstructions from soft and overlapping γ candidates. Hence, it is neces- sary to reconstruct Ξ0 → Λπ0 candidates with a good signal-to-background ratio. We detail the reconstruc- tion procedure and selection criteria for the Ξ0c modes:
Ξ0c →(Ξ− →(Λ→pπ−)π−)π+ and Ξ0c →(Ξ0→(Λ→ pπ−)(π0→γγ))K+K−, by following a similar method- ology to that of the Ω(2012) → Ξ0K− observation [3]
which used the previous Belle Software Framework.
Preliminary Λ candidates must exhibit the expected kinematics from a long-lived hyperon decay, Ξ → Λπ.
These Λ→pπ− candidates are found with a local vertex reconstruction using a Kalman-Filter [11] and selected with the following kinematics: a reconstructed mass in
±3.5 MeV range of the nominal mass [2] which is ap- proximately 99% efficient; a cos(αxyz) > 0.0 in the 3D plane; a distance of the decay vertex with respect to the IP greater than 0.35 cm; and a loose PID requirement on the ptrack with L(p:π) andL(p:K) greater than 0.2 which is approximately 99% efficient. For these kinemat- ics we defineαxyz (αxy) as the 3D (2D) angle between a vector from the IP to the decay vertex and the momen- tum vector at the decay vertex. All hyperons with higher strangeness are then reconstructed with the described Λ candidates and all good π− or π0 → γγ candidates a priori selected by internal Belle studies of the CDC and ECL performance [10]. The decay vertex of these hy- peron candidates is then globally reconstructed using a decay chain fitter with mass-constrained daughters to im- prove the signal-to-background [9, 11].
Optimal Ξ− → Λπ− selection is less crucial for the normalization mode decay due to the high yield of these charmed baryon decays produced at Belle. We loosely select Ξ− → Λπ− candidates for this analysis with the following kinematics: a reconstructed invariant mass in
±3.5 MeV range of the nominal mass [2] which is ap- proximately 4σwith respect to the primary resolution; a reconstructed decay vertex chi-squared probability con- sistent with aχ2per degree of freedom less than 20; a dis- tance of the Ξ− decay vertex with respect to the IP pre- ceding the Λ decay vertex distance; a distance of the Ξ− decay vertex with respect to the IP greater than 0.1 cm;
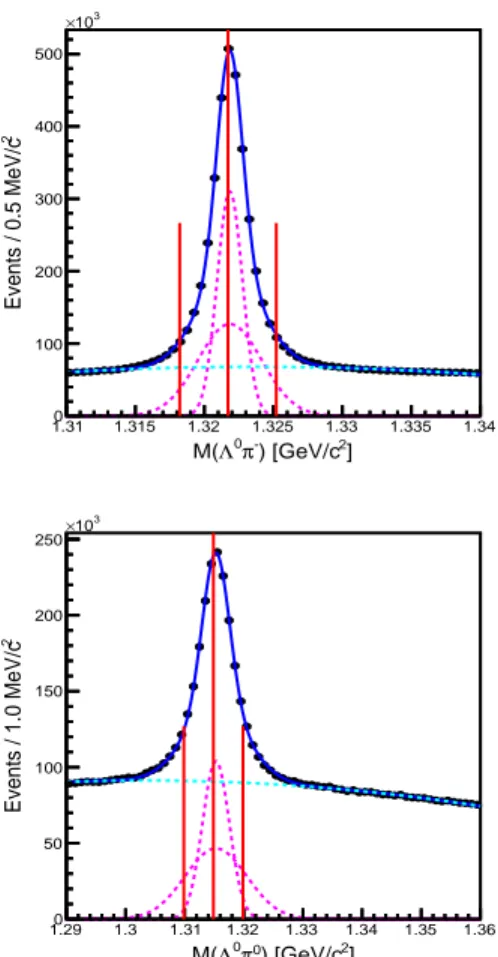
aπ− transverse momentum greater than 50 MeV; and a loose ratio between the Λ and Ξ− hyperon cos(αxy) an- gles in the tangential plane which is consistent with a hy- peron decay. The reconstructed invariant mass for these Ξ− → Λπ− hyperons is shown in Fig. 2 together with an unbinned maximum likelihood fit to the data using a probability density function (PDF) comprised of a double Gaussian signal function and a second-order Chebyshev polynomial background.
We reconstruct Ξ0 → Λπ0 by refitting the π0 due to the a priori candidates containing no directional informa- tion. Using a global decay chain reconstruction [9, 11]
the π0 candidates are refit to the decay vertex of the Ξ0 → Λπ0 with the Ξ0 constrained to come from the nominal IP region. After refitting these π0 candidates, the Ξ0 hyperons used for this analysis are selected with the following kinematics: a reconstructed invariant mass in a±5 MeV range of the nominal mass [2] which is ap- proximately 2σwith respect to the primary resolution; a reconstructed decay vertex chi-squared probability con- sistent with aχ2 per degree of freedom less than 20; a distance of the Ξ0 decay vertex with respect to the IP preceding the Λ decay vertex distance; a distance of the Ξ0 decay vertex with respect to the IP greater than 1.4 cm; a re-fitπ0momentum greater than 150 MeV; a re-fit π0mass range±10.4 MeV about theπ0nominal mass [2]
which is approximately 2σ; and lastly, a Λ tangentialαxy deflection angle greater than the IP produced Ξ0 angle ofαxy ≈0. The reconstructed invariant mass for these Ξ0 → Λπ0 hyperons is shown in Fig. 2 together with an unbinned maximum likelihood fit to the data using a PDF comprised of a double Gaussian signal function and a second-order Chebyshev polynomial background.
For the normalization channel Ξ0c →Ξ−π+, all Ξ−hy- perons described above are mass-constrained and com- bined with selectedπ+candidates. Theseπ+candidates are selected with a point of closest approach (POCA) in thexy-plane less than 0.2 cm, a POCA along the z- axis less than 1.0 cm, and a loose PID requirement with L(π:p) and L(π:K) greater than 0.2 which is approxi- mately 99% efficient. To reconstruct the signal channel Ξ0c →Ξ0K+K−, the Ξ0 hyperons described above are mass-constrained and combined with similarly selected K± candidates. TheseK± candidates are selected with a POCA in thexy-plane less than 0.2 cm, a POCA along the z-axis less than 1.0 cm, and a tight PID require- ments withL(K:p) andL(K:π) greater than 0.9 which is approximately 83% efficient. The decay vertex of these Ξ0c candidates in each mode is then reconstructed locally and constrained to the nominal IP profile region of the Belle detector. The final Ξ0c candidates are then opti- mally selected via a figure of merit with a scaled mo- mentum xp > 0.5 for xp = p∗/q
Ebeam2 −MΞ20 c where p∗ is the momentum in the e+e− center of mass (CM) frame. This requirement is typically used to produce a good signal-to-background ratio while retaining high ef- ficiency for charmed baryons produced in e+e− → q¯q
2] ) [GeV/c π-
Λ0
M(
1.31 1.315 1.32 1.325 1.33 1.335 1.34 2Events / 0.5 MeV/c
0 100 200 300 400 500
103
×
2] ) [GeV/c π0
Λ0
M(
1.29 1.3 1.31 1.32 1.33 1.34 1.35 1.36 2Events / 1.0 MeV/c
0 50 100 150 200 250
103
×
FIG. 2: Selected signal bands (marked in red half-lines) with respect to the nominal masses (marked in red full-lines) of the invariant mass distributions for the hyperon decays Ξ−→Λπ− (upper) and Ξ0→Λπ0 (lower) in the data sample (black) with an unbinned likelihood fit to a double guassian PDF (solid blue) with Chebyshev polynomial background (dashed cyan) and each individual Gaussian contribution to the signal PDF (dashed magenta).
continuum events.
From the Monte-Carlo (MC), the PDF which best de- scribes the Ξ0c baryon is a double Gaussian with a pri- mary, core, resolution and secondary resolution along with a second-order Chebyshev polynomial background.
In Fig. 3, we plot the results of these unbinned maxi- mum likelihood fits to the invariant mass distributions of the normalization channel, Ξ0c →Ξ−π+, and the sig- nal channel, Ξ0c → Ξ0K+K−, with fixed primary and secondary resolutions from MC simulations but with a free parameter yield into each Gaussian. We define the reconstruction efficiency into each mode as a ratio of sig- nal yields between the reconstruction level and generator level for generic MC events containing a single generated Ξ0c.
For the normalization mode, the primary and sec- ondary resolutions are independently found to be 7.1±0.1 MeV and 14.5 ± 0.2 MeV, respectively, which corre-
spond to an RMS resolution of 9.7 ± 0.1 MeV and has a reconstruction efficiencyΞ−π+ = (7.04±0.05)%
with respect to the generated MC when resolutions are constrained. For the non-resonant and resonant signal modes, these resolutions are determined independently from Ξ0c → Ξ0K+K− MC generated with phase space distribution and Ξ0c → Ξ0φ(→ K+K−) MC generated with a helicity amplitude distribution [5, 12, 13], respec- tively. The difference in resolution between resonant and non-resonant decays was found to be negligible and are averaged with equal weighting. These average primary and secondary resolutions are found to be 3.19±0.02 MeV and 12.37±0.21 MeV, respectively, and correspond to an RMS resolution of 5.6±0.1 MeV. Each signal mode MC sample, Ξ0c →Ξ0K+K− and Ξ0c →Ξ0φ(→K+K−), has statistically equivalent reconstruction efficiencies for their own resolution constraints given as Ξ0K+K− = (1.08±0.01)% and Ξ0φ = (1.09±0.01)% respectively within a ±10 MeV range of the Ξ0c nominal mass [2]
which is approximately 3σ with respect to the primary resolution.
From sideband samples in the Ξ0K+K− invariant mass distribution, we find that a significant number of φ → K+K− decays which are not from a resonant Ξ0c are reconstructed in the ±10 MeV signal band. To ac- count for these events, as well as the uniform combina- toral background, all reconstructed signal candidates in the signal band range of the Ξ0c nominal mass [2] are sideband-subtracted. This is done by subtraction of the scaled sideband candidates in the left and right sidebands of equal±10 MeV width at central mass energies labelled in Fig. 3 of±40 MeV to the nominal mass with respect to the±10 MeV signal band.
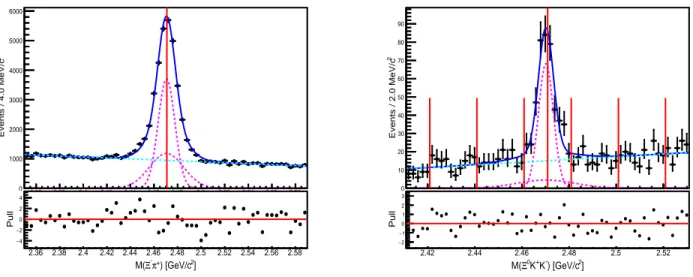
From the resulting likelihood fits in Fig. 3 with res- olutions constrained to the MC values previously de- fined, we findnΞ+π−= 27186±475 normalization mode candidates over the entire distribution range. Similarly, within the±10 MeV range of the nominal mass, we find ncand. = nΞ0φ+nΞ0K+K− = 311±23 candidates into both signal modes by using a scaled sum of events in the sideband-subtracted distribution of the Ξ0K+K−in- variant mass channel. Defining a signal statistical signif- icance as s/δ(s) for signal yield s and its uncertainty δ(s), our results correspond to a 13.5σ statistical sig- nificance of these new Cabibbo-allowedW-exchange de- cays of Ξ0c→Ξ0K+K−including the resonant mode via φ→K+K−.
The sideband-subtracted Dalitz plot is shown in Fig.
4 with a mass-constrained Ξ0c final state across the en- tire phase space. From this figure, we find a clear φ→K+K− band but no evidence of other resonances.
Theφresonance is found to be non-uniform due to the spin-polarization of the φ in the 1/2 → 1/2 + 1 reso- nant decay process Ξ0c → Ξ0φ. This non-uniform sub- structure is specifically observed nearM2(Ξ0K−)≈3.85 GeV2 and M2(Ξ0K−) ≈3.425 GeV2 along the φ band at M2(K+K−) ≈1.04 GeV2. For this work, we define the branching ratios B(ΞB(mode)0
c→Ξ−π+) = nmode
mode/nΞ−π+
Ξ−π+ with
2] ) [GeV/c π+ Ξ- M(
2.36 2.38 2.4 2.42 2.44 2.46 2.48 2.5 2.52 2.54 2.56 2.58 2Events / 4.0 MeV/c
0 1000 2000 3000 4000 5000 6000
2] ) [GeV/c π+
Ξ-
M(
2.36 2.38 2.4 2.42 2.44 2.46 2.48 2.5 2.52 2.54 2.56 2.58
Pull
−4
−2 0 2
4 M(Ξ0K+K-) [GeV/c2]
2.42 2.44 2.46 2.48 2.5 2.52
2Events / 2.0 MeV/c
0 10 20 30 40 50 60 70 80 90
2] ) [GeV/c
K-
K+
Ξ0
M(
2.42 2.44 2.46 2.48 2.5 2.52
Pull
−2
−1 0 1 2 3
FIG. 3: Reconstructed invariant mass distributions for the normalization mode Ξ0c →Ξ−π+ (left) and the analysis mode Ξ0c →Ξ0K+K− (right) in the data sample (black) with an unbinned likelihood fit to a double Gaussian PDF (solid blue) using fixed MC resolutions with Chebyshev polynomial background (dashed cyan) and each individual Gaussian contribution to the signal PDF (dashed magenta). The pull distribution for each likelihood fit is included (bottom) adjacent to each reconstructed distribution. The selected signal, left, and right sidebands (marked in red half-lines) with respect to the nominal masses (marked in red full-lines) are described in the text.
previously defined efficiencies. Using this definition, we study the fractions into these resonant and non-resonant modes using an amplitude analysis over this entire decay phase space.
4]
2/c ) [GeV K-
(K+
M2
0.95 1 1.05 1.1 1.15 1.2 1.25 1.3 1.35
]4/c2) [GeV- K0 Ξ(2M
3.3 3.4 3.5 3.6 3.7 3.8 3.9
0 2 4 6 8 10
FIG. 4: Dalitz plot distribution of the Ξ0c →Ξ0K+K− decays in the sideband-subtracted Ξ0c signal region of the data sample, shown with square bins of 12.5 MeV width.
III. AMPLITUDE MODEL
The non-uniform contributions to the resonant sub- structure in the Ξ0c →Ξ0φdecay are best modelled using an amplitude analysis over the decay phase space. In this section, we provide basic forms used to model the spin- polarized, resonant amplitudes forφ→K+K− from the spin-1/2 Ξ0cin an azimuthally symmetric plane. From the branching fractions into the resonant and non-resonant modes in Fig. 4 and the efficiency corrected integration of amplitude intensities [14], we calculate the branching ratios B(Ξ0cB(Ξ→Ξ00φ(→K+K−))
c→Ξ−π+) and B(ΞB(Ξ0c→Ξ0 0K+K−)
c→Ξ−π+) as previ- ously defined for the amplitude analysis.
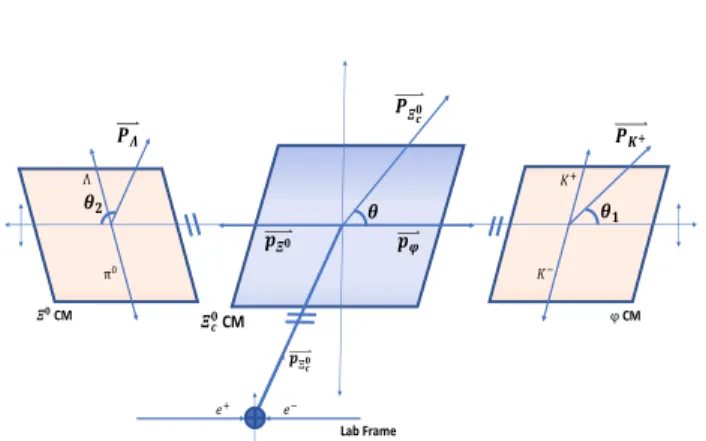
It is known that a resonant decay amplitude is well modelled to first order using a Breit-Wigner amplitude [1, 8]. To higher order, non-isotropic angular distribu- tions contribute to the resonant amplitude due to the spin orientations of the final-state decay products. For the resonant Ξ0c →Ξ0φ(→K+K−) decay, the unit spin of the φ meson is polarized due to the 1/2 spin of the heavy baryons. To describe this angular dependence of the polarizedφ, we study the polar polarization angles for the resonant Ξ0cdecay shown in Fig. 5 with respect to the Ξ0c momentum in the lab frame. In contrast, we assume the simple model that non-resonant Ξ0c →Ξ0K+K− are uniform, isotropic and are modeled using a constant am- plitude over the entire phase space.
From Fig. 5, Ξ0c decays resonantly into aφwith a po- larization angleθwith respect to its polarization vector P~Ξ0
c in the lab frame. The polarization angle θ in this diagram is defined as the angle between the polarization
𝑷𝜩
𝒄𝟎
𝒑𝜩𝟎 𝒑𝝋 𝜽
𝑷𝜦 𝑷𝑲+
𝜽𝟏 𝜽𝟐
𝐾+
𝐾− π0
Λ
𝜩𝒄𝟎CM
𝜩𝟎CM φCM
𝑒+ 𝑒− 𝒑Ξ
𝒄𝟎
Lab Frame
FIG. 5: Azimuthally symmetric diagram of the spin-polarization angles in the resonant Ξ0c →Ξ0φ(→K+K−) decay.
vector and the resonant daughter momentum vector,p~φ, in the Ξ0c CM frame. Similarly, the resonant, spin-1 φ and spin-1/2 Ξ0 decay with corresponding polarization anglesθ1andθ2with respect to their momenta in the Ξ0c CM frame and their daughter polarization vectors, P~Λ
andP~K+, in their own respective CM frame.
After integration over θ2 in the Dalitz plot, the an- gular distribution of the resonant Ξ0c decay depends effectively on the polarization angles of the Ξ0c and the resonant φ coupled by their corresponding helic- ity amplitudes, Hλφ,λΞ0. We define this effective angu- lar distribution of the resonant Ξ0c decay amplitude as A(θ, θ1) ∝ d1λφ,λ
K+−λK−(θ1)Hλφ,λ
Ξ0d1/2λ
Ξ0c,λφ−λΞ0(θ) for small-wigner D functionsdjλ,λ
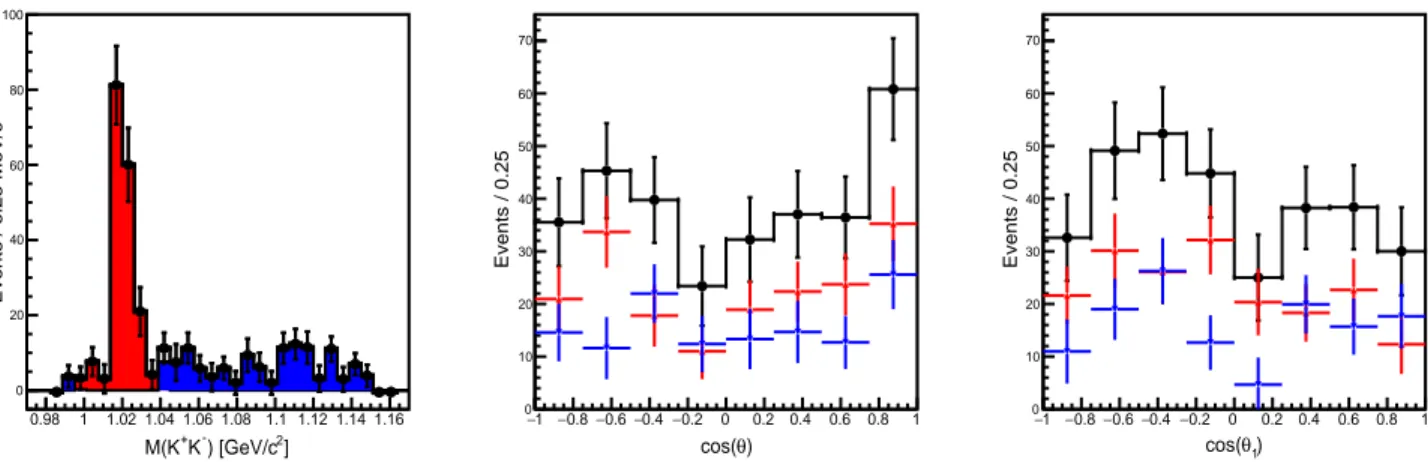
1−λ2 of a parent parti- cle with spinjand helicityλdecaying into two daughters with helicitiesλ1&λ2[5, 12]. The kinematics in this ef- fective angular distribution of our amplitude model are given in Fig. 6 for cos(θ) and cos(θ1) in±20 MeV range of the resonant nominal mass and in non-resonant regions of phase space.
When fitting the Dalitz plot using this angular distri- bution, A(θ, θ1), due to the low statistics we reparame- terize the sum of helicity contributions by absorbing con- stants into the overall normalization and eliminate any direct Hλφ,λΞ0 dependence which is outside the scope of this work. The resulting ratios ofHλφ,λΞ0 amplitudes are then free parameters in the amplitude model. Among these ratios, only the λφ = 0,1 terms contribute to the Dalitz plot which corresponds to the integrated distri- bution over both θ and θ2 and will only depend on θ1
directly.
From this, we conclude that the Ξ0c →Ξ0K+K− am- plitude from resonant, polarized φ → K+K− decays can be described by combining this effective angular distribution, A(θ, θ1), with a Breit-Wigner amplitude, V(E, Mφ,Γ). We then assert that this resonant am- plitude is complex and coherent with the non-resonant constant amplitude,AKK, across the Dalitz plot distri-
bution described as|AKK+AφP
V(E, Mφ,Γ)A(θ, θ1)|2 summed over all helicity states of Ξ0c, Ξ0, andφfor nor- malization amplitudesAKK andAφ of the non-resonant and resonant decays respectively. Alternate hypotheses for these assumptions are included in the systematic un- certainties.
IV. AMPLITUDE ANALYSIS
We fit the Dalitz plot distribution in Fig. 4 as a coher- ent sum of resonant and non-resonant amplitudes out- lined in Section III. We then freely vary the helicity am- plitude ratios of the resonant decay in the reparameter- ized angular distribution using only the natural width of theφresonance, Γ = 4.249 MeV [2], as a constraint. The convolution of this natural width with the Gaussian res- olution is included in the systematic uncertainties. The result of this unbinned maximum likelihood fit is shown in Fig. 7 across each pair of invariant mass projections using the amplitude analysis software AmpTools (v.10.2) [14]. From the normalized integration of each amplitude relative to the integral of their coherent sum, we measure branching fractions into the resonant and non-resonant modes as (48.1±4.2)% and (51.9±4.2)%, respectively.
In addition, we find that the measured mass of theφme- son,Mφ= 1019.62±0.25 MeV, is in agreement with the current average value [2].
These branching fractions for the resonant and non- resonant decay modes correspond to nΞ0φ = 149±17 andnΞ0K+K− = 161±18 candidates, respectively. After varying all free parameters of our amplitude model [14]
and considering the reconstruction efficiencies across the Dalitz plot distribution from signal MC, we measure the precise resonant and non-resonant branching ratios into these newW-exchanges¯s-popping decay modes:
B(Ξ0c→Ξ0φ(→K+K−))
B(Ξ0c→Ξ−π+) = 0.036±0.004 (stat.) (1)
B(Ξ0c→Ξ0K+K−)
B(Ξ0c→Ξ−π+) = 0.039±0.004 (stat.) (2) The branching ratios in (1) and (2) can easily be verified by one-dimensional analysis methods on the Ξ0K+K− invariant mass distribution in Fig. 3. For this validation, we plot the invariant mass of theK+K− under the signal Ξ0c band and weight the left and right sideband events appropriately, akin to the amplitude analysis. We then model the resonant φ → K+K− in theK+K− projection with a P-wave relativistic Breit- Wigner PDF convolved with a double Gaussian using constrained resolutions from signal MC studies. Using this analysis method we find statistically consistent re- sults corresponding to branching fractions (48.7±4.9)%
and (51.3±4.9)% into the resonant and non-resonant modes respectively. The corresponding minute differ- ences between these measurements as branching ratios are consistent with a slight overestimation of the resonant mode observed during the MC analysis of this channel us- ing one-dimensional methods. The methodological sys-
2] ) [GeV/c K-
M(K+
0.98 1 1.02 1.04 1.06 1.08 1.1 1.12 1.14 1.16 2Events / 6.25 MeV/c
0 20 40 60 80 100
θ) cos(
−1 −0.8−0.6−0.4−0.2 0 0.2 0.4 0.6 0.8 1
Events / 0.25
0 10 20 30 40 50 60 70
1) θ cos(
−1 −0.8−0.6−0.4−0.2 0 0.2 0.4 0.6 0.8 1
Events / 0.25
0 10 20 30 40 50 60 70
FIG. 6: Angular kinematics in the sideband-subtracted data sample for the cos(θ) (middle) and cos(θ1) (right) distributions (black) in±20 MeV range of the resonant nominal mass (red) and in non-resonant regions of phase space (blue) selected about theK+K− invariant mass projection (left).
2] ) [GeV/c K-
M(K+
0.98 1 1.02 1.04 1.06 1.08 1.1 1.12 1.14 1.16 2Events / 12.5 MeV/c
0 10 20 30 40 50 60 70 80 90 100
2] ) [GeV/c K-
Ξ0
M(
1.8 1.82 1.84 1.86 1.88 1.9 1.92 1.94 1.96 1.98 2Events / 12.5 MeV/c
0 5 10 15 20 25 30 35 40 45 50
2] ) [GeV/c K+
Ξ0
M(
1.8 1.82 1.84 1.86 1.88 1.9 1.92 1.94 1.96 1.98 2 Events / 12.5 MeV/c
0 5 10 15 20 25 30 35 40 45 50
FIG. 7: Paired invariant mass projections of the amplitude intensities in the Ξ0c→Ξ0K+K− decay via the resonant φ→K+K− (red) and non-resonant (blue) modes in the sideband-subtracted data sample (black plot points) using the coherent sum of azimuthally symmetric amplitudes (solid black) as a model.
tematic uncertainty between the amplitude analysis and the one-dimensional analysis branching ratios is included in the total systematic uncertainty of the final branching ratio measurement.
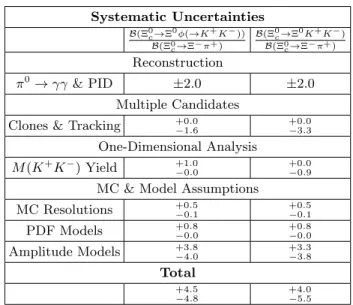
V. SYSTEMATIC UNCERTAINTIES In Table I, we summarize all systematic uncertain- ties which impact our branching ratio measurements, summed in quadrature, to calculate the total system- atic uncertainty. As the branching fraction is defined by the ratio of Ξ0c→(Ξ0→Λ0π0)K+K−and Ξ0c→(Ξ−→ Λ0π−)π+, the detection efficiency relevant (DER) errors from particle identification and reconstruction common to both modes, such as Λ finding and tracking, cancel.
The remaining uncertainties are due toπ0reconstruction (±1.5%) and PID (±1.3%), giving a total±2.0% when
quadratically summed. These are estimated by compar- ing data and MC for dedicated calibration samples. In addition, we assign a systematic uncertainty of +0.0−1.6% and +0.0−3.3% to each respective branching ratio measure- ment due to the DER errors from multiple candidates in the signal distributions as a result of cloned hyperon reconstructions and tracks which originate far from the IP. This is calculated by comparing measurements from MC samples to the truth generated.
In order to check our methodology, we compare the re- sults found for the branching ratios with the amplitude analysis to those found using the simpler one-dimensional approach of fitting the Dalitz plot projections. We assign a systematic uncertainty of+1.0−0.0% and+0.0−0.9% to each re- spective branching ratio measurement due to variances between this amplitude analysis and the one-dimensional analysis measurements.
Our remaining systematic uncertainties are due to the
MC statistics assumed for the resolutions as well as all model assumptions used throughout this analysis. We as- sign a collective systematic uncertainty of+0.5−0.1% to each branching ratio measurement due to the MC assump- tions in our PDF models. This is calculated by varying and floating the values of the resolution constraints about the statistical uncertainty and summing these effects in quadrature. Similarly, we assign a systematic uncertainty of+0.8−0.0% to each branching ratio measurement due to the choice of PDF models used in our measurements of the Ξ0c modes. This is calculated by finding the change in the result if we use a Gaussian PDF or a reduced fit range when modelling the reconstructed Ξ0c invariant masses.
For the amplitude model assumptions, we assign a col- lective systematic uncertainty of+3.8−4.0% and+3.3−3.8% to each respective branching ratio measurement when quadrati- cally summed. These are calculated by varying the model assumptions correlating to the natural width constraint [2] and various measurements with alternative or ancil- lary amplitude models. These collective calculations in- clude the following systematic effects: the quality of the phase space efficiencies and generated MC which is cal- culated by measuring these branching ratios with inte- grated efficiencies (+0.0−0.3% and+0.3−0.0%); the effect of smear- ing the Breit-Wigner natural width by the reconstruction resolution (+2.9−4.0% and +3.2−2.5%); the effect of using inco- herent, non-interference models of the two amplitudes (<±0.1%); the effect of including contributions due to a0(980) andf0(980) mesons near threshold (<±0.1%);
the assumption of azimuthal symmetry found by perturb- ing the model about small Euler angles (±0.1%); and the effect of direct helicity amplitude dependencies, the repa- rameterization, and the defined polarization angles calcu- lated by systematically varying and eliminating these free parameters in our amplitude model (+2.3−0.5% and+0.4−2.8%).
Summing all of these systematic uncertainties in quadrature, as shown in Table I, we assign a total system- atic certainty of +4.5−4.8% and+4.0−5.5% for the two branching ratio measurements, respectively.
VI. CONCLUSIONS
Using the entire data sample of 980 fb−1 integrated luminosity collected with the Belle detector [6], we find a signal with statistical significance of 13.5σ for new W- exchange s¯s-popping decay modes of Ξ0c → Ξ0K+K− including resonant decays through φ→K+K−. Using an azimuthally symmetric amplitude model we find that among the 311±23 candidates, (48.1±4.2)% decay reso- nantly through φ→K+K− while (51.9±4.2)% decay directly to Ξ0K+K−. These yields are directly com- pared to the normalization mode Ξ0c → Ξ−π+ of yield 27186±475 over the same data sample. From these mea- surements and the previously studied reconstruction ef- ficiencies on signal MC, we report new branching ratios
Systematic Uncertainties
B(Ξ0c→Ξ0φ(→K+K−)) B(Ξ0c→Ξ−π+)
B(Ξ0c→Ξ0K+K−) B(Ξ0c→Ξ−π+)
Reconstruction
π0→γγ& PID ±2.0 ±2.0
Multiple Candidates
Clones & Tracking +0.0−1.6 +0.0−3.3 One-Dimensional Analysis
M(K+K−) Yield +1.0−0.0 +0.0−0.9 MC & Model Assumptions
MC Resolutions +0.5−0.1 +0.5−0.1 PDF Models +0.8−0.0 +0.8−0.0 Amplitude Models +3.8−4.0 +3.3−3.8
Total
+4.5
−4.8
+4.0
−5.5
TABLE I: Contributions to the total systematic uncertainty of the branching ratio measurements, expressed as a percentage.
for these resonant and non-resonant Ξ0c modes:
B(Ξ0c→Ξ0φ(→K+K−)) B(Ξ0c→Ξ−π+)
= 0.036±0.004 (stat.)±0.002 (syst.)
B(Ξ0c→Ξ0K+K−) B(Ξ0c→Ξ−π+)
= 0.039±0.004 (stat.)±0.002 (syst.)
The measurements of these Ξ0cdecay modes, which can only proceed viaW-exchange together with s¯s produc- tion, add to our knowledge of the weak decay of charmed baryons. However, from the amplitude intensities in Fig.
7, we conclude it is unlikely that contributions from these resonant Ξ0c →Ξ0φ(→K+K−) decays will correlate to significant event excesses in the Ξ0K− reconstruction near 1.95 GeV. Only minor cusping to the combinato- rial background will be present in that region due to this decay. As a result of the slightly smaller branching fraction via the resonant Ξ0c →Ξ0φ decay, the apparent spin-polarization substructure is diluted due to the non- resonant fraction in this same region. This implies that future excited Ω searches may promisingly search this region of the Ξ0K− invariant mass after the inclusion of these new modes during MC studies. Despite the low statistics of these new modes at Belle, this study via an amplitude analysis provides necessary tools for studying more resonant amplitude features in multibody charmed baryon decays in the forthcoming high-luminosity era.
VII. ACKNOWLEDGEMENTS
We thank the KEKB group for the excellent operation of the accelerator; the KEK cryogenics group for the ef-
![arXiv:2007.05696v2 [hep-ex] 23 Feb 2021](data:image/gif;base64,R0lGODlhAQABAIAAAP///wAAACH5BAEAAAAALAAAAAABAAEAAAICRAEAOw==)