The Effect of the Beamspot Size on the Vertex Reconstruction within the Belle II Experiment
Ketevan Parlagashvili
Munich 2019
The Effect of the Beamspot Size on the Vertex Reconstruction within the Belle II Experiment
Ketevan Parlagashvili
Master Thesis
at the Faculty of Physics
of Ludwig–Maximilians–Universit¨ at Munich
submitted by Ketevan Parlagashvili
from Tbilisi, Georgia
Munich, 06.12.2019
Reviewer: Prof. Dr. Christian Kiesling
Der Einfluss der Beamspot Gr¨ oße auf die Vertex Rekonstruktion
im Belle II Experiment
Ketevan Parlagashvili
Masterarbeit
an der Fakult¨ at f¨ ur Physik
der Ludwig–Maximilians–Universit¨ at M¨ unchen
vorgelegt von Ketevan Parlagashvili
aus Tiflis, Georgien
M¨ unchen, den 06.12.2019
Gutachter: Prof. Dr. Christian Kiesling
Contents
Zusammenfassung x
Abstract xi
Introduction xii
1 Physics Motivations 1
1.1 The Standard Model . . . . 1
1.1.1 Open Questions in the Standard Model . . . . 2
1.1.2 Search for New Physics . . . . 2
1.2 CP Violation . . . . 3
1.2.1 CP Transformation . . . . 4
1.2.2 Flavor Mixing . . . . 4
1.2.3 Types of CP Violation . . . . 4
1.2.4 CKM Matrix and the Unitarity Triangle . . . . 7
1.2.5 CP Violation at Belle II . . . . 11
1.3 Other Physics Prospects at Belle II . . . . 13
1.4 Summary . . . . 13
2 The Belle II Experiment 14 2.1 A Short History of e
+e
−Colliders . . . . 14
2.2 SuperKEKB . . . . 15
2.2.1 Luminosity . . . . 16
2.2.2 The Nanobeam Scheme . . . . 18
2.2.3 Issues with the Nanobeam Scheme . . . . 19
2.3 The Belle II Detector . . . . 20
2.3.1 Vertex Detector . . . . 20
2.3.2 Central Drift Chamber . . . . 21
2.3.3 Particle Identification System . . . . 22
2.3.4 Electromagnetic Calorimeter . . . . 22
2.3.5 K
L-Muon Detector . . . . 22
2.4 Data Taking . . . . 22
3 The ∆t Resolution Function 24 3.1 Neutral Meson Mixing . . . . 24
3.2 Time-Dependent Evolution . . . . 26
3.3 Flavor Tagging . . . . 27
3.4 An Event with Signal and Tag Decays . . . . 28
viii Contents
3.5 Detector Effects Impacting the ∆t Distribution . . . . 29
3.6 Analytical Approach to the ∆t Resolution Used at Belle and BaBar . . . 29
3.7 The MPI Concept for Time-Dependent Fits . . . . 30
4 Belle II Software Simulation 32 4.1 Monte Carlo Simultions . . . . 32
4.2 Generators . . . . 33
4.3 Physics Analysis Software . . . . 34
4.4 Beam Parameters . . . . 34
4.5 Roofit . . . . 34
4.6 Track Reconstruction . . . . 35
5 Experimental Results 37 5.1 ParticleGun Studies . . . . 38
5.2 Beamspot Studies . . . . 41
5.3 TagVz for Negative True ∆t . . . . 41
5.4 Privately Produced Samples . . . . 42
5.5 Tag Side Vertexing . . . . 42
5.5.1 Fit Algorithms for Tag Vertex Fitting . . . . 44
5.6 Testing Different TagV Algorithms . . . . 46
5.7 Errors on Tag Side and failing fits . . . . 47
5.8 Centrally Produced Samples . . . . 51
5.8.1 Phase3 vs earlyPhase3, the Effect of Added Background on TagVz Resolution . . . . 51
5.8.2 MC12a Phase3 Samples in More Detail: Background and Different Fitting Algorithms . . . . 51
5.9 More Statistics for Privately Produced Samples . . . . 58
A Beamspot Modification 65 A.1 Beam Parameters at Generator Level . . . . 65
B Signal Side Fitting 69 B.1 The Case for Using RAVE over TreeFitter for Signal-Side Vertex Fitting 69 B.2 RAVE vs TreeFitter Comparison Plots . . . . 70
C Tag Side Fitting 72 C.1 TagVertexModule and “cut” . . . . 72
C.1.1 findConstraintBoost function of TagV . . . . 73
C.1.2 Solution for Updating Beamspot Size in Fitting . . . . 74
C.1.3 The Effect of “cut” on Vertex Fit constraint . . . . 75
C.2 MC12a Samples with Added Background . . . . 78
C.3 The BTube Constraint for Tag Vertex . . . . 80
C.4 Flavor of Tag Side and ∆t . . . . 81
List of Tables 84
Contents ix
Bibliography 85
Acknowledgements 89
Declaration 90
Zusammenfassung
Die beispiellose Verbesserung der Leuchtkraft des asymmetrischen SuperKEKB-Kolliders e
+e
−erfordert, dass der Interaktionspunkt (IP oder Beamspot) der kollidierenden Strahlen auf eine Mikrometerskala (das sogenannte Nanostrahlschema) reduziert wird, wodurch das IP-Profil kompatibel wird mit der B Meson Zerfallsl¨ ange. Dies bedeutet, dass die B -Mesonen außerhalb des Beamspots zerfallen k¨ onnen, und durch Anwenden der IP- basierten Standardbedingung auf die Tag-Vertex-Anpassung wird der Zerfallspunkt in Richtung des Beamspots vorgespannt. Dies ist insbesondere dann ein Problem, wenn das markierte B-Meson vor dem Zerfall eine lange Strecke von dem IP zur¨ ucklegt. Da- her wird die Verzerrung durch eine Inkompatibilit¨ at des Nanostrahlschemas mit der Art und Weise verursacht, wie die Tag-Vertex-Anpassung derzeit bei Belle II behandelt wird.
Diese Arbeit untersucht die M¨ oglichkeiten, die Verzerrung mit verschiedenen Anpassung-
soptionen f¨ ur den Tag-Vertex zu beseitigen. Es wird gezeigt, dass durch auflockern der
Fit-Einschr¨ ankung auf der Tag-Seite die Vorspannung verschwindet.
Abstract
The unprecedented luminosity upgrade of the SuperKEKB asymmetric e
+e
−collider
requires squeezing the interaction point (IP or beamspot) of the colliding beams down
to a micrometer scale (the so-called nanobeam scheme), making the IP profile compatible
with the B meson decay length. This means that the B mesons can decay outside of the
beamspot, and applying the default IP-based constraint to the tag vertex fit biases the
decay point toward the beamspot. This is especially a problem for the cases when the
tagged B meson travels a long distance from the IP before decaying. Therefore, the bias
is caused by an incompatibility of the nanobeam scheme with the way the tag vertex
fit is currently handled at Belle II. This thesis investigates the options for getting rid of
the bias with different fit options on the tag vertex. It is shown that by relaxing the fit
constraint on the tag side, the bias disappears.
Introduction
It is widely accepted by physicists today that our universe can be boiled down to a few basic building blocks - the fundamental particles - and the three out of the four fun- damental forces that govern them, described by the Standard Model of particle physics (SM) Section 1.1. Some of the biggest successes of the Standard Model include the prediction of the Higgs, W and Z bosons, as well as the charm, bottom and top quarks.
Despite its many successes, the SM fails to address, for example, the phenomenon of neutrino masses and has no description of gravity, dark matter and dark energy. As a result, the SM has been dubbed a phenomenological description of particle physics;
physicists therefore search for so-called physics Beyond the SM (BSM physics), or New Physics (NP).
Recent efforts by the high-energy physics community focus on the explanation of the asymmetry of matter and antimatter in our observable universe; that is, why much more matter has been observed than antimatter. According to the Big Bang theory, initially equal amounts of matter and antimatter were created, therefore, certain conditions must have been satisfied in order for the imbalance to emerge over time. The Sakharov condi- tions for baryogenesis require the violation of baryon number conservation, interactions out of thermal equilibrium and the violation of charge conjugation (C) symmetry and of the combined charge parity (CP) symmetry[1].
High energy physics experiments aim to address the issues within the SM using com- plementary approaches. At the energy frontier, the high-energy colliders such as the LHC generate high energy collisions to observe new particles that provide information on the makeup of matter and space. At the intensity frontier, the precision experiments such as the B factories, study rare subatomic processes, suppressed in the SM.
One such precision experiment is the Belle II Experiment, which aims to make precise measurements of CP Violation in the B meson sector as well as search for new sources of CP Violation in NP programs. Benefiting from the large cross-section of the pairwise τ-lepton production in e
+e
−collisions, Belle II has a broad program of τ physics, in par- ticular, searches of lepton flavor and lepton number violations in rare τ-decays forbidden in the SM.
Located in Tsukuba, Japan, Belle II is a second generation B factory, consisting of the high luminosity Belle II detector and the SuperKEKB double ring accelerator.
SuperKEKB is an asymmetric energy e
+e
−collider, mainly running at a Center of Mass (COM) energy corresponding to the Υ(4S) resonance, where large numbers of B mesons and their antiparticles, boosted in the direction of the high energy electron beam, are produced exclusively. CP violation leads to differences in the decay patterns of B mesons and their antiparticles.
Neutral B mesons are of particular interest for the study of CP violation. The neutral
xiii
B mesons produced by the decay of the Υ(4S) are locked in a quantum-entangled state until one of them decays. Thus identifying the flavor of one of the neutral B mesons at the time of its decay also identifies the flavor of the other B meson at the same time. With one B meson fully reconstructed from a CP-eigenstate (B
CP) and the other identified from flavor-specific final states (B
tag), the difference between the particle and the antiparticle can be studied using the shape of the distribution of the difference of their decay times.
The decay processes which are suitable for studying CP violation in B mesons are quite rare. For example, the branching fraction of the process B
0→ J/ΨK
S0is O (10
−5). This means that extreme luminosity is required to study CP violation in B mesons and other suppressed flavor physics reactions. To increase the precision of relevant measurements, Belle II was designed with an almost two orders of magnitude increase in luminosity from its predecessor experiment Belle. Such a massive increase in luminosity entails drastically increased background, which can cause damage to the electronic components of the detector, as well as make it more challenging to separate the signal from the background. To this end, the Belle II detector has undergone substantial upgrades, most importantly the tracking systems, including a precise silicon pixel vertex detector.
The beam crossing scheme at SuperKEKB has been upgraded from the so-called crab- crossing scheme at KEKB to a so-called nanobeam scheme which drastically squeezes the beams to a few tens of nanometers and constrains the interaction point to a few hundred micrometer scale, meaning that the primary particles originate from a much smaller region compared to KEKB where the beam spot was several millimeters long.
The goal of this thesis is to show that this constraint introduces a bias in decay vertex reconstruction of the flavor-tagged B meson due to the vertex fitting algorithms’ ten- dency to converge the fit of the B meson decay position towards the interaction point.
This bias was not observed at Belle and therefore the methods for determining the ex- perimental resolution functions need to be reconsidered for Belle II. It is shown with Monte Carlo (MC) simulations that, by relaxing or getting rid of this constraint at the origin, the bias disappears, however, relaxing the beamspot constraint results in loss of precision, defeating the intended purpose of the nanobeam scheme. Thus, the trade-off of bias vs. accuracy needs to be investigated in more detail.
The chapters of this thesis are divided as follows: Chapter 1 discusses some of the physics motivations behind the Belle II experiment, Chapter 2 gives an overview of the experiment, describing the SuperKEKB collider and the Belle II detector and their respective upgrades. An overview of ∆t resolution function is given in Chapter 3. Chap- ter 4 describes the role of Belle II software tools used to study time dependent analyses.
The results of this study are summarized in Chapter 5. The detailed plots, tables and
the Belle II software parameters used in this study are given in the Appendix.
1 Physics Motivations
1.1 The Standard Model
The Standard Model of Particle Physics (SM) (Figure 1.1) is a quantum field theory that describes the properties and interactions of fundamental building blocks of matter. The SM includes twelve elementary spin ±
12particles called fermions, four gauge bosons with spin 1: the gluon, the photon and the W and Z bosons, and a massive scalar particle, the Higgs boson. The gauge bosons correspond to the fundamental forces. The gluons are the force carriers of the strong interaction, the photons mediate electromagnetic interactions, and W and Z bosons are exchanged in weak interactions. The hypothetical quantum of the gravitational force, the graviton, has not yet been observed, which is one of the several shortcomings of the SM.
R/G/B2/3
1/2 2.3MeV
up
u
R/G/B−1/3
1/2 4.8MeV
down
d
−1
1/2 511keV
electron
e
1/2
<2eV
eneutrino
ν e
R/G/B2/3
1/2 1.28GeV
charm
c
R/G/B−1/3
1/2 95MeV
strange
s
−1
1/2 105.7MeV
muon
µ
1/2
<190keV
µneutrino
ν µ
R/G/B2/3
1/2 173.2GeV
top
t
R/G/B−1/3
1/2 4.7GeV
bottom
b
−1
1/2 1.777GeV
tau
τ
1/2
<18.2MeV
τneutrino
ν τ
±1
1 80.4GeV
W
±1 91.2GeV
Z
photon 1
γ
color
gluon 1
g
0 125.1GeV
Higgs
H
strongnuclearforce(color) electromagneticforce(charge) weaknuclearforce(weakisospin) charge
colors mass spin 6quarks(+6anti-quarks) 6leptons(+6anti-leptons)
12 fermions (+12 anti-fermions)
increasing mass→
5 bosons (+1 opposite chargeW)
standard matter unstable matter force carriers
Goldstone bosons
1
st2
nd3
rd generationFigure 1.1: The Standard Model of Elementary Particles [2].
The fermions of the SM are classified into quarks and leptons. There are six quarks
(up, down, charm, strange, top, and bottom), and six leptons (electron, electron neu-
trino, muon, muon neutrino, tau, and tau neutrino). The pairs from each classification
of fermions form generation-wise doublets, with corresponding particles exhibiting same
physical behavior under the weak and strong forces. A distinguishing property of the
quarks is that they carry color charges, and hence interact via the strong interaction. A
2 1. Physics Motivations
phenomenon called color confinement results in quarks being very strongly bound to one another, forming color-neutral composite particles (hadrons) containing either a quark and an antiquark (mesons) or three quarks (baryons). Quarks also carry electric charge and weak isospin, hence they interact with other fermions both electromagnetically and via the weak interaction. Leptons do not carry color charge and therefore don’t partici- pate in the strong interaction. The three neutrinos do not carry electric charge either, so they only interact via the weak interaction, making them notoriously difficult to detect.
The electron, muon, and tau, however, do interact electromagnetically. In the SM, the weak and electromagnetic forces are unified under the electroweak theory.
Each particle in the SM has an associated antiparticle with opposite quantum numbers such as electric charge, baryon number, lepton number and strangeness. The quarks and charged leptons have opposite-charge partners, neutrinos have partners with opposite helicity, photons, Z
0and Higgs bosons are their own antiparticles, W
−and W
+are antiparticles of each other, and gluons, since they not only mediate strong interactions but also carry color charges themselves, form a color octet. Charge conjugating a gluon leads to another gluon or a combination of gluons. Hence the whole color octet is sometimes referred to as its own antiparticle.
All standard (stable) matter is comprised of protons and neutrons, the baryons com- posed of first generation quarks. Second- and third-generation charged particles, on the other hand, decay quickly and are therefore observed only in very high-energy environ- ments of particle accelerators [3].
1.1.1 Open Questions in the Standard Model
The SM is currently one of the best verified physical theories, but despite its tremendous success in describing the basic forces of nature, many fundamental questions still remain unanswered. The problems the SM fails to address include neutrino oscillations, dark matter and dark energy, reconciliation of gravity with other fundamental forces, and asymmetry between matter and antimatter in the observable universe [4]. Considering the open questions that exist in the SM, it is fair to conclude that the present theory is an extremely successful but phenomenological description of subatomic processes at energy scales now experimentally tested up to O (1 TeV).
1.1.2 Search for New Physics
Many new physics (NP) scenarios have been proposed to explain these shortcomings of the SM, where new particles and new processes arise. Experiments in high energy physics are designed to address the above questions through searches of NP using com- plementary approaches. At the energy frontier, the LHC experiments are able to discover new particles produced in proton-proton collisions at a centre-of-mass energy of up to 14 TeV. On the other hand, sensitivity to the direct production of a specific new particle depends on the mass scale of the new particle spectrum and the size of the data sample.
Indirect searches for NP via loop effects require the ability to measure suppressed flavor
1.2 CP Violation 3
physics reactions and deviations from SM predictions. Belle II operates at the inten- sity frontier on energy scales of O (10 GeV), with principal sensitivities to loop effects up to several hundred TeV). The actual sensitivity of Belle II to NP depends on the strength of the flavor violating couplings of the NP. Belle II and SuperKEKB aim to move beyond a simple observation of a NP effect to its detailed characterization through over-constraining measurements in several related flavor physics reactions [5].
1.2 CP Violation
In particle physics, symmetries - and the violation of symmetries - play a fundamental role. According to the famous Noether theorem [6], symmetries are related to conserva- tion laws. For example, the translational symmetry of space leads to the conservation of momentum, the rotational symmetry of space leads to the conservation of angular mo- mentum, finally the symmetry under translation of time leads to energy conservation.
All these symmetries are continuous symmetries. There are also discrete symmetries, such as the inversion of spatial coordinates, which is called “parity transformation” and is denoted by the letter “P”. Conservation of parity (or mirror symmetry) means that a physical state, or particle, with a certain spin direction can also be realized with the opposite spin direction. While P is conserved for the strong and the electromagnetic interactions, it turns out the weak interaction violates P in a maximal way: A neutrino has its spin always against its direction of motion (“left-handed”), while a right-handed neutrino does not exist.
Another discrete symmetry is the charge conjugation, denoted by the letter “C”, which transforms a particle to its antiparticle. Again, the weak interaction violates C in a maximal way: A left-handed neutrino would be transformed to a left-handed antineutrino, which does not exist (Figure 1.2). There is a third fundamental discrete
ν L ν R
ν L ν R
C
P
CP
Figure 1.2: The effect of C, P, and CP transformations on a left-handed neutrino ν
L.
Only the states shown in boxes have been observed in nature.
4 1. Physics Motivations
symmetry, namely time reversal, denoted by “T”. Time reversal means to “run the film backwards”. In the weak interaction, time reversal seems to be conserved: A left- handed neutrino running in +z-direction (the spin of the neutrino points into the − z direction) is transformed under T into a neutrino running into the − z-direction, with its spin pointing into the +z-direction, meaning the neutrino remains left-handed.
1.2.1 CP Transformation
The CP transformation consists of successive C and P transformations, where the C transformation conjugates all internal quantum numbers of a particle and the P trans- formation reverses handedness. Under CP, a left handed neutrino transforms into a right-handed antineutrino (ν
L→ ν
R), which is allowed in the SM (1.2). Long thought of as an exact symmetry, a CP symmetry is indeed conserved in strong and electromagnetic interactions, but has been shown to be violated in weak interactions.
1.2.2 Flavor Mixing
In particle physics, flavor mixing refers to oscillations of a neutral particle between the particle and antiparticle states. The only hadrons that exhibit mixing with their antiparticles are the mesons K
0(sd), B
0d(bd), B
s0(bs), D
0(cu), and their antiparticles.
The meson states are flavor eigenstates and the corresponding antimesons have op- posite flavor quantum numbers. The mesons are eigenstates of the strong interactions, and in the absence of weak interaction, they are also mass eigenstates. In the SM all interaction vertices conserve flavor, except for the couplings of W bosons to fermions.
Meson-antimeson mixings belong to the class of flavor-changing neutral current (FCNC) processes, which involve different flavors with the same electric charge. In the SM such processes are forbidden at tree level, but are allowed at loop level (Figure 1.3). Time evolution and mixing of neutral mesons are discussed in more detail in Chapter 3.
Figure 1.3: Dominant box diagrams for the B
q0→ B
0qtransitions (q = d or s). Similar diagrams exist where one or both t quarks are replaced with c or u quarks.
1.2.3 Types of CP Violation
CP violation can occur via different mechanisms and can thus be classified into three
types. For the purpose of such classification, it is useful to consider four pure quantum
1.2 CP Violation 5
mechanical states: the meson | M i and its charge conjugate state (antiparticle) | M i , as well as a final state particle | f i and its CP conjugate | f i . We have the following quantities of interest:
A
M,f≡ A ( | M i → | f i ), A
M ,f≡ A ( | M i → | f i ), A
M,f≡ A ( | M i → | f i ), A
M ,f≡ A ( | M i → | f i ),
(1.1)
Here, the symbol A denotes the amplitude of the respective process.
Indirect CP Violation
This type of CP violation manifests itself in processes where flavor mixing is involved.
It means that a transformation does not occur with exactly the same probability in both directions, for example, h B
d0| B
0di 6 = h B
0d| B
d0i . In this case, CP violation arises as a consequence of an asymmetry in the flavor oscillation | M i → | M i → | M i , meaning that physical mass eigenstates are not CP eigenstates.
Violation of the CP symmetry in weak interactions due to mixing was first observed in neutral K mesons in 1964 [7]. In 1964, Christenson, Cronin, Fitch and Turlay designed an experiment to search for 2π decays of the K
Lmeson. To conserve CP symmetry, K
Lshould only decay to three pions. The observed O (10
−3) branching fraction of K
Lmesons decaying to two-pion final states could not be explained away as it would require highly unphysical behavior in three-pion decays, which proved that K
Lis not a pure CP eigenstate, hence there is mixing in the K-meson system.
For neutral B mesons mixing was first observed in late 1980’s at UA1 experiment at CERN [8], where the rates of muon pairs with same(++ or −− ) and opposite(+ − ) charges were studied in final states of reactions where bb states decayed to
1. (+ − ): b → c µ
−ν
µand b → c µ
+ν
µ.
2. (++): b → c µ
+ν
µand b → cX, where c → s µ
+ν
µ, or ( −− ): b → c µ
−ν
µand b → cX where c → s µ
−ν
µ.
The ratio of same to opposite charged muon pairs was found to be substantially larger than the prediction,
R
exp= N (++) + N ( −− )
N (+ − ) = 0.42 ± 0.07(stat) ± 0.03(syst) (1.2)
R
pred= 0.26 ± 0.03, (1.3)
and this difference was interpreted as evidence for B
0B
0oscillation. The same year, the
ARGUS collaboration also published the first observation of the B
0− B
0oscillations [9].
6 1. Physics Motivations
These papers led to the realization that a precise measurement of this phenomenon could pin down the Unitarity Triangle [Section 1.2.4] and perhaps explain the excess of matter over antimatter in the universe. To this end, the construction of the first generation B-factories Belle and BaBar ensued, which over a decade of operation amassed over 1.5 ab
−1of data, corresponding to roughly 1.2 billion B
0B
0pairs [10]. This resulted in an experimental confirmation of CKM mechanism as source of CP violation in the SM.
For neutral D mesons mixing was observed in 2007 [11]. The CDF II detector at the Fermilab Tevatron measured the time dependence of the ratio of decay rates for the rare decay D
0→ K
+π
−to the Cabibbo-favored decay D
0→ K
−π
+, and found the data to be inconsistent with the no-mixing hypothesis with a probability equivalent to 3.8σ.
Direct CP Violation
Direct CP violation, also called CP violation in decay, is related to asymmetry in decays of charge-conjugate processes, meaning that a meson decay to a final state | f i does not occur with the same probability as an antimeson decay to the charge conjugate state
| f i . In terms of the amplitudes defined in Eqn. 1.1, this means
A
M,fA
M ,f6
= 1 or
A
M ,fA
M,f6
= 1. (1.4)
This is the only kind of CP violation that is possible for both, neutral mesons and charged mesons. Other types of CP violation exclude charged mesons, since they do not mix with their antiparticles.
The first attempt to prove the existence of direct CP violation was executed at CERN by the NA31 experiment. The experiment was proposed in 1982 with the explicit goal of establishing whether the ratio of direct and indirect CPV parameters,
0/, was nonzero.
If the mixing parameter were the only source of CP violation, the fraction of K
Ldecays with a two-pion final state normalized to K
Swould be independent of whether the two pions were π
+π
−or a π
0π
0. Any observed difference between the amplitude ratios with charged and neutral pions as final states would be evidence for direct CP violation.
Therefore, to make a measurement of the direct CP violation parameter, all four decay rates of K
Sand K
Lto π
+π
−and π
0π
0had to be measured.
Because
0/ is of the order of 10
−3, the measurements were particularly difficult. In 1988, NA31 found the first evidence for direct CP violation, with a result that was about three standard deviations from zero. However, shortly after this the E731 experiment at Fermilab reported a measurement that was consistent with zero. These conflicting results prompted the design of a new generation of detectors, both at CERN (NA48) and at Fermilab (kTeV), which were able to, through a significant increase in beam intensity and event rates, confirm direct CP violation in K mesons in 1999 [12, 13].
For the B meson sector, direct CP violation wasn’t observed until 2004, when the
BaBar collaboration published their study of B
0→ K
+π
−and B
0→ K
−π
+decays. If
CP symmetry were conserved in these processes, then the two decays would be equally
likely to occur, and by starting with equal numbers of B
0and B
0the experiment would
1.2 CP Violation 7
end up with equal numbers of K
+π
−and K
−π
+pairs. However, BaBar found more K
+π
−pairs than K
−π
+pairs in a total of about 1600 events. The resulting asymmetry
A
CP= N (K
−π
+) − N (K
+π
−)
N (K
−π
+) + N (K
+π
−) = − 0.133 ± 0.030(stat) ± 0.009(syst) (1.5) established direct CP violation in the B
0-meson system at the level of 4.2σ [14]. That same year, Belle reported A
CP= − 0.101 ± 0.025(stat) ± 0.005(syst) in about 2140 events, corresponding to a significance of 3.9σ [15]. As expected theoretically, both experiments confirmed that the CP violation is large in the B meson sector. At 10-13% asymmetry, the effect is about 10
5times larger in neutral B mesons than in K mesons.
The size of CP violation in charm decays is tiny in the SM, with asymmetries typically of the order of 10
−4to 10
−3. Decades of experimental searches for CP violation in D
0→ K
−K
+and D
0→ π
−π
+modes by the BaBar, Belle, CDF, and LHCb collaborations reported values of CP asymmetries consistent with zero within a precision of a few per mille. In 2019, the LHCb collaboration managed to measure CP violation in charm decays with a precision 5.3σ [16].
Mixing-Induced CP Violation
Mixing-induced CP violation, which occurs due to interference of mixing and decay can be observed when the neutral mesons | M i and | M i have a common final state | f i , preferentially a pure CP eigenstate | f
CPi . Even if there is no CP violation in mixing and decay separately, i.e. if |A
M ,fCP/ A
M,fCP| = 1, the sum of the decay and the mixing phases can give rise to a total phase difference and thus to an interference between these two processes, violating the CP symmetry.
In 2001, Belle presented a measurement of the Standard Model mixing-induced CP violation parameter sin(2φ
1) based on a 29.1f b
−1data sample collected at the Υ(4S) resonance using signal channels J/ψK
S, ψ(2S)K
S, χ
c1K
S, η
cK
S, J/ψK
L, and J/ψK
∗0. From the asymmetry in the distribution of the time intervals between the two B meson decays sin(2φ
1) = 0.99 ± 0.14(stat) ± 0.06(syst) was determined, which was an indication for an observed mixing-induced CP violation in the neutral B meson system [17].
1.2.4 CKM Matrix and the Unitarity Triangle
In the SM quarks can only change flavor through emission of a W boson. For example, a top quark can decay to a bottom, strange or down quark: These decays are not equally likely. The labels V
tb, V
ts, V
tdin Figure 1.4 represent the relative probabilities of these transitions, which are encoded in the so-called CKM matrix:
V
CKM=
| V
ud| | V
us| | V
ub|
| V
cd| | V
cs| | V
cb|
| V
td| | V
ts| | V
tb|
=
0.97427 ± 0.00015 0.22534 ± 0.00065 0.00351
+0.00015−0.000140.22520 ± 0.00065 0.97344 ± 0.00016 0.0412
+0.0011−0.00050.00867
+0.00029−0.000310.0404
+0.0011−0.00050.999146
+0.000021−0.000046
[18].
(1.6)
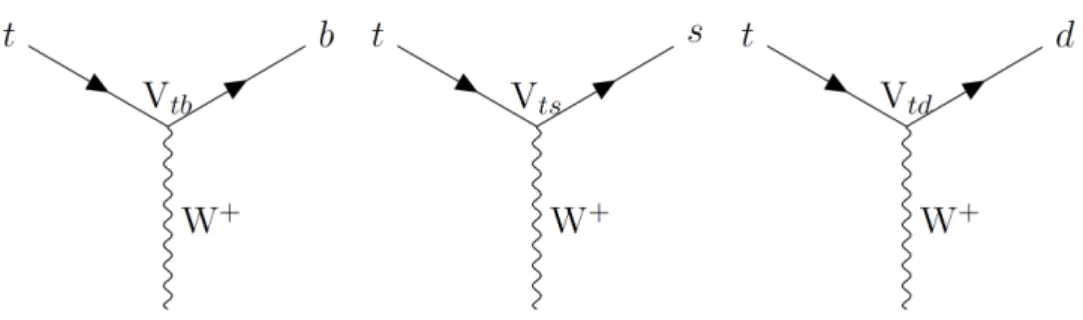
8 1. Physics Motivations
Figure 1.4: Top quark decaying to bottom, strange and down quarks by emitting a W
+boson.
It can be seen from the CKM matrix that the probability of t → b is much higher (V
tb≈ 0.999146) than of t → s (V
ts≈ 0.0404) and t → d (V
td≈ 0.00867). In general, the magnitude of the matrix elements follows a decreasing order, transitions within the same generation having the highest strength, followed by the transitions from first to second generation, then second to third generation and lastly, first to third generation.
This hierarchy is visualized in Figure 1.5.
Figure 1.5: Relative sizes of the CKM matrix elements [19]
The CKM matrix is named after the Italian physicist Nicola Cabibbo, who postulated weak universality in 1963, and the Japanese physicists Makoto Kobayashi and Toshihide Maskawa, who, a decade after, established a method to keep track of the weak decays of three generations of quarks that is still widely used today.
Quarks had not yet been theorized when Cabbibo published his major work on weak
interaction in 1963. His concept of weak universality [20] involves a similarity in weak
interaction coupling strength between different generations of particles. Cabbibo was
trying to explain, comparing the decays of charged pions and kaons, why the transitions
1.2 CP Violation 9
with a change in strangeness (∆S = 1) had a likelihood equal to one fourth of those with no change in strangeness (∆S = 0).
To explain this discrepancy, he introduced a mixing angle, now called the Cabibbo angle (Figure 1.6), which is related to the relative probability that down and strange quarks decay into up quarks ( | V
ud|
2and | V
us|
2respectively). The object that couples to the up quark via charged-current weak interaction is a superposition of down-type quarks, here denoted by d
0. Mathematically this is
| d
0i = V
ud| d i + V
us| s i = cos θ
C| d i + sin θ
C| s i . (1.7) Using the currently accepted values for | V
ud| and | V
us| , the Cabibbo angle can be calculated using
tan θ
C= | V
us|
| V
ud| = 0.22534
0.97427 ⇒ θ
C= 13.02
◦. (1.8) When the charm quark was theorized [21], it was noticed that the down and strange quark could decay into either the up or charm quark, leading to a 2x2 Cabbibo matrix:
d
0s
0=
V
udV
usV
cdV
csd s
=
cos θ
csin θ
c− sin θ
ccos θ
cd s
, (1.9)
where | V
ij|
2represent the probability that the quark j decays into a quark i.
In 1973, observing that CP-violation could not be explained in a four-quark model, Kobayashi and Maskawa generalized the Cabibbo matrix to keep track of the weak decays of three generations of quarks, a year before the charm quark was discovered.
θc
θc
Figure 1.6: The Cabbibo Angle.
Thus, the Cabibbo-Kobayashi-Maskawa matrix (V
CKM) is a unitary matrix (V
CKMV
CKM†= 1) containing strengths of flavor-changing weak interactions for the quark sector. It is usually written as
d
0s
0b
0
=
V
udV
usV
ubV
cdV
csV
cbV
tdV
tsV
tb
d s b
. (1.10)
10 1. Physics Motivations
The choice of usage of down-type quarks in the definition is a convention, and does not represent a physically preferred asymmetry between up-type and down-type quarks.
The CKM matrix can be parametrized by three mixing angles and the CP-violating phase. A ”standard” parameterization (Eqn. 1.11) uses three Euler angles (θ
12, θ
23, θ
13) and one CP-violating phase (δ).
V
CKM=
c
12c
13s
12c
13s
13e
−iδ− s
12c
23− c
12s
23s
13e
iδc
12c
23− s
12s
23s
13e
iδs
23c
13s
12s
23− c
12c
23s
13e
iδ− c
12s
23− s
12c
23s
13e
iδc
23c
13
, (1.11)
Here, s
ij= sin θ
ij, c
ij= cos θ
ijand δ is the CP-violating phase. Couplings between quark generation i and j vanish if θ
ij= 0. θ
12is the Cabibbo angle.
The CKM matrix can be written using a conventient Wolfenstein parametrization [22]
that shows the sizes of matrix elements, with s
12≡ λ, s
23≡ Aλ
2, s
13e
iδ≡ Aλ
3(ρ + iη).
The parameters λ, A, ρ, η are all real and of order 1.
λ = 0.2257
+0.0009−0.0010, A = 0.814
+0.021−0.022,
ρ = 0.135
+0.031−0.016, η = 0.349
+0.015−0.017[18]. (1.12) The CKM matrix then becomes
V
CKM=
1 − λ
2/2 λ λ
3A(ρ − iη)
− λ 1 − λ
2/2 λ
2A λ
3A(1 − ρ − iη) − λ
2A 1
+ O (λ
4). (1.13) The CKM matrix elements are fundamental parameters of the SM, so their precise determination is important. In general, a unitary N × N matrix has (N − 1)
2free variables. The unitarity of the CKM matrix imposes Σ
iV
ijV
ik∗= δ
jkand Σ
jV
ijV
kj∗= δ
ik. The six vanishing combinations can be represented as triangles in a complex plane. All these triangles have equal areas, A = J/2, with J corresponding to Jarlskog invariant:
J = c
12c
23c
213s
12s
23s
13sin δ ∼ 4 × 10
−5. (1.14) In the matrix element notation,
| J | = Im(V
ijV
klV
kj∗V
il∗) (for any ijkl, i 6 = k, j 6 = l). (1.15) The most commonly used unitarity triangle, relevant for B physics, is determined by
V
ud∗V
ub+ V
cd∗V
cb+ V
td∗V
tb= 0, (1.16) divided by V
cdV
cb∗, this is equivalent to
1 + V
ud∗V
ubV
cdV
cb∗+ V
td∗V
tbV
cdV
cb∗= 0. (1.17)
Introducing the parametrization ρ + iη ≡ −
VVud∗∗VubcdVcb
gives a nice graphical representation
of the matrix in the form of the Unitarity Triangle, where the horizontal axis is real and
the vertical axis is imaginary (Figure 1.7).
1.2 CP Violation 11
VudV∗
V ub cdV∗
cb
VtdV∗
V tb cdV∗
cb
γ= φ3 β =φ1
α=φ2
(0, 0) (1, 0)
(ρ, η)
Figure 1.7: The Unitarity Triangle
The area of the triangle can be thought of as a qualitative measure of the CP violation:
a vanishing complex phase (no CP violation) would cause the triangle to collapse into a zero-area line, while a non-vanishing phase (CP violation) is required to have a non- zero area triangle. Since the triangle in Figure 1.7 has sides and angles of comparable magnitude, more so than other unitarity triangles stemming from the constraints of CKM matrix, an equivalent statement is that CP violation is largest in the B sector, which is indeed what has been observed [17, 14].
1.2.5 CP Violation at Belle II
The general strategy for CP violation measurements is to take advantage of the entangled production of the B
0B
0meson pair through the reaction e
+e
−→ Υ(4S) → B
0B
0. The B meson pair evolves in a coherent state, with exactly one B
0and one B
0at any given time, until one of the mesons decays. When one of the B mesons decays, the other B meson continues to propagate and oscillate between a B
0and a B
0state until its own decay. Identifying the flavor of one B meson, the tagging B, as B
0or B
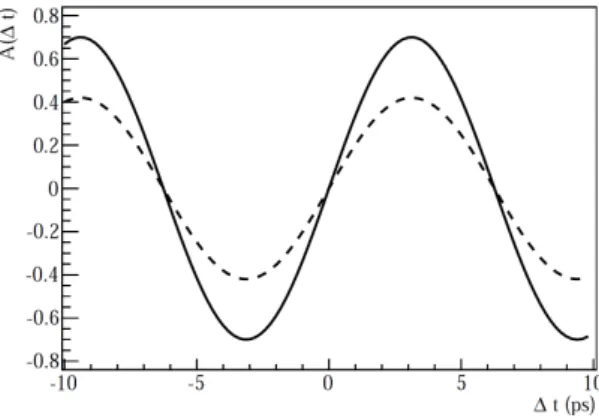
0, defines the flavor of the other B meson at the same time. The time dependent asymmetry for the decay of the other B meson, the signal B, to a CP eigenstate, can be written as
a
fCP= Γ(B
0(∆t)) − Γ(B
0(∆t)) Γ(B
0(∆t)) + Γ(B
0(∆t))
= S sin (∆m∆t) − C cos (∆m∆t), (1.18) where ∆t is the difference in decay time between the moment the flavor of the B meson is observed and the moment the other meson decays into a CP eigenstate, and
∆m is the mass difference. The difference in decay time can be calculated measuring the decay length through ∆t = ∆z/βγc. The coefficients S and C are proportional to different types of CP violation: C accounts for “direct” CP violation while S accounts for the “mixing induced” CP violation.
The best way to measure φ
1at B-factories is the time-dependent CP violation analysis
of b → ccs and b → qqs transitions. While the tree-level process b → ccs results in a
12 1. Physics Motivations
more precise measurement, especially using the golden mode B
0→ J/ψK
S0, b → ccs, being a loop process, is also sensitive to NP contributions.
In this kind of measurement the main source of systematic uncertainty comes from the resolution on the vertex of the tagging B meson and the performance of the flavor tagging algorithm. The new flavor tagger of Belle II developed by F. Abudin´ en has already shown about 10% improvement in flavor tagging efficiency when used on the Belle data [23].
Because the B meson pair is produced almost at rest in the Υ(4S) COM frame, the boost is required to increase the separation and and thereby allow for time-dependent CP violation measurements. The boost factor has been reduced from about 0.43 at KEKB to about 0.28 at SuperKEKB in order to provide better hermeticity for missing energy decays, which reduces the separation between the B mesons from 200 µ m to 130 µ m . This would make it more challenging to separate the vertices, but the improved vertex detector is expected to not only compensate for the reduced B-vertex separation, but also improve the resolution. For the benchmark channel B → J/ψK
S, the resolution on
∆t is expected to improve from 0.92 ps to 0.77 ps (Figure 1.8).
Figure 1.8: Tag vertex fit residuals (left): bias = 6 µm, resolution= 53 µm, and ∆t resid- uals(right): bias=-0.03 ps, resolution = 0.77 ps, of the fully reconstructed B
0→ (J/ψ → µ
+µ
−)(K
S0→ π
+π
−). Both fits are performed using the sum of three Gaussian functions [24].
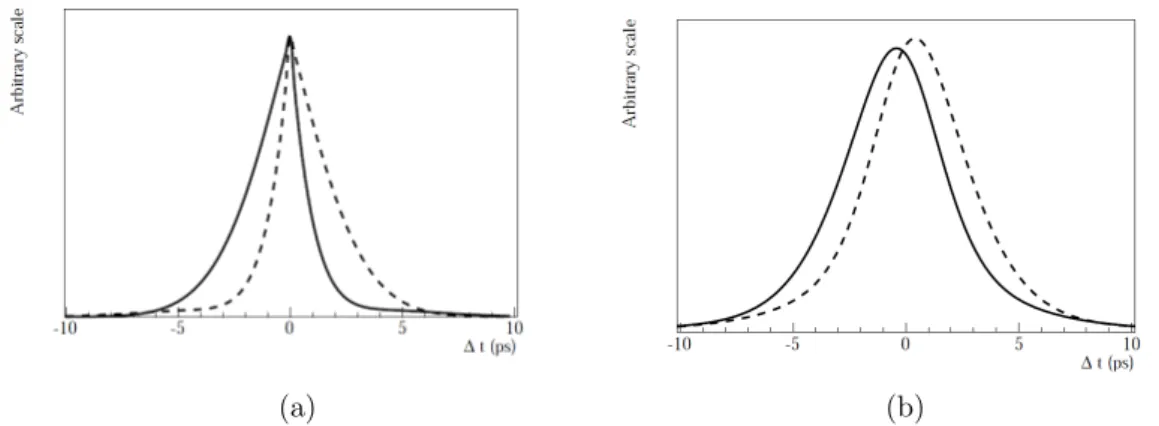
The measured distribution of ∆t includes a physics contribution arising from time
evolution of a neutral meson pair, and a contribution due to the detector effects, which
has a smearing effect on the true physics distribution. The detector effects are modeled
as the ∆t resolution function, which is to the first order, a Gaussian distribution. In
practice, the deviations from the Gaussian are important since precise determination
of the resolution on ∆t is crucial for carrying out time-dependent measurements, such
as determining the B meson lifetimes, BB oscillation frequency, and time-dependent
CP-asymmetries [25]. The upgrades to Belle II and SuperKEKB have made it impos-
sible to fully separate the experimental resolution and dilution effects from the physics
distribution. The interpretation of the observed ∆t distribution will be one of the major
challenges for the collaboration (Chapter 3).
1.3 Other Physics Prospects at Belle II 13
1.3 Other Physics Prospects at Belle II
In addition to searching for CP violation in the B-meson sector and other B-physics analyses, Belle II has an extensive NP program that aims to over-confine SM parameters and search for hints of Physics Beyond the Standard Model (BSM). The experiment will provide possibilities to study a wide range of areas in b-quark, c-quark, τ -lepton, two- photon, quarkonium and exotic physics, as well as searches for lepton flavor violation, dark matter, and axion-like particles. Since the sides of the triangles are products of CKM matrix elements, their sides and angles can be quantified by measuring proper decay rates. This definition of the UT with three sides and three angles seems to be too constraining, since any triangle can be defined by three of its six parameters, as long as at least one side is known. However, these measurements offer an excellent test of the SM: if the SM fully describes the mechanism for the CP violation, the unitarity of the CKM matrix would require each unitarity triangle to close, and the deviation from this condition would suggest a source of NP. Thus, an important goal of flavor physics is to overconstrain the CKM elements, and either close the unitarity triangle, or show the contrary with sufficient certainty.
1.4 Summary
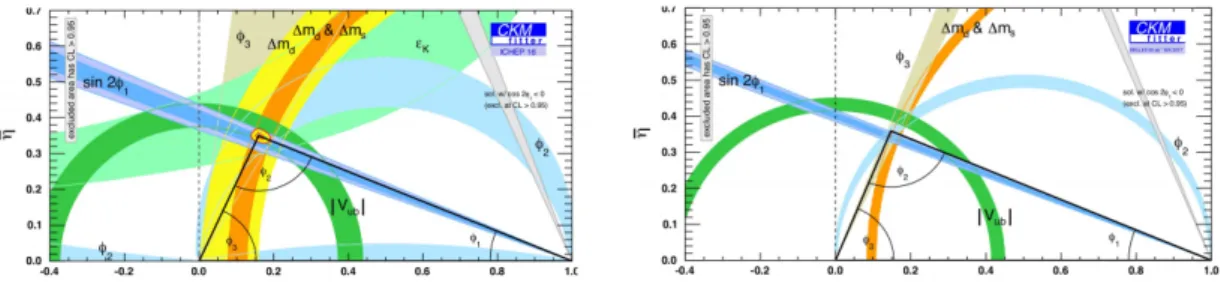
The results of the first generation B factories Belle and BaBar confirmed the theory for the origin of CP violation by Kobayashi and Maskawa, who received the Nobel Prize for their theory in 2008 [26]. Until now, all measurements of CP violation in the meson sector agree with the CKM mixing mechanism of the SM, however, recent years have shown great progress in experiments that refine the measured parameters. Belle II is projected to greatly improve the accuracy of the angles and sides of the Unitarity Triangle, as shown in Figure 1.9. Belle II has a clear advantage over its competitor LHCb for measuring decays with missing energy, and searches for dark sector particles will happen in a mass window that is complementary to the searches at ATLAS and CMS [27]. It remains to be seen whether a significant deviation from the SM will be observed.
Figure 1.9: Constraints on the UT (a) 2016 (b) Projected: after 50ab
−1from Belle II.
2 The Belle II Experiment
The Belle II experiment consists of the 3 km SuperKEKB accelerator ring and the high luminosity Belle II detector. While the Belle II experiment has a rich physics program aiming at a number of exotic BSM scenarios, it is first and foremost a B factory: a facility where large quantities of B mesons are produced alongside their antiparticles to study CP violation in the B meson sector. The e
+e
−colliders are advantageous for this purpose because of the relatively clean environments they harness, typically producing only a few tracks in each event. In contrast, at hadron colliders such as the LHC the processes of interest are harder to identify due to the omnipresent QCD background [28].
This chapter will outline main features of the SuperKEKB accelerator and the Belle II detector, and discuss some of the main upgrades that are most relevant for precise vertexing and consequently the ∆t resolution measurements.
Figure 2.1: (a) Luminosities of past, ongoing and scheduled e
+e
−colliders over the years [29] (b) Luminosity vs. COM energy of e
+e
−colliders [30]
2.1 A Short History of e + e − Colliders
The circular electron-positron colliders date back over 50 years (Figure 2.1.a). The first e
+e
−collider, the storage ring AdA (Anello di Accumulazione in Italian, meaning the accumulation ring), was built in Frascati, Italy, in 1960 and the first observation of electron-positron collisions took place in a laboratory, in Orsay, France, in 1963.
Following this first proof of feasibility, new particle colliders were planned and built,
leading to milestone discoveries such as the 1974 observation made independently at the
SLAC and Brookhaven laboratories of the J/ψ meson. These earlier machines opened
2.2 SuperKEKB 15
the way to the large particle accelerators of the 1980’s, and to more discoveries that established the Standard Model of elementary particles as a well-tested physics theory.
In 1976, in light of the discovery of J/ψ and other heavy particles, B. Richter argued that an e
+e
−machine with several hundred GeV COM energy would enable one to
“understand the structure of the weak force itself by a study of reactions that involve only leptons in the initial and final states in an energy region where the weak interac- tions dominate”, and that such a machine would be “the most useful project on the horizon” [31]. An accelerator meeting these requirements, the Large Electron-Positron Collider (LEP) with a maximum COM energy of 209 GeV, was built at CERN. It ran from 1989 to 2000, and to this day it’s the most powerful e
+e
−accelerator ever built. In 1996, LEP produced its first pair of fundamental particles known as W
+and W
−today, taking particle physics research into new and unexplored territory.
A further important step forward was made by the two B factories, PEP-II and KEKB.
They established collider operation at very high beam current (well above 1 A per beam), world record luminosities, and top-up injection as a routine mode of operation. Another machine, DAΦNE, demonstrated the merits of crab-waist collisions, with a small vertical beta function β
y∗at the interaction point (IP), and a large vertical beam-beam tune shift [32].
The next big step in luminosity upgrades has been the SuperKEKB, whose beam commissioning started in 2016. SuperKEKB was designed to operate with a “nanobeam collision scheme” (Section 2.2.2), which is similar to the crab waist, but without any crab- waist sextupoles. It features a β
y∗of only 0.3 mm, and aims to achieve a 40-fold increase in luminosity compared to the previous world record achieved by its own predecessor, KEKB.
2.2 SuperKEKB
At SuperKEKB, electrons and positrons collide to create a COM energy in the region of the Υ-resonances. The Υ meson is comprised of a b and a b quark in a bound state, similar to a hydrogen atom. It has a mass of about 9.46 GeV in the ground state, but several excited states can also be produced. Figure 2.2 shows hadronic cross section for e
+e
−collisions as a function of e
+e
−COM energy close to the Υ-range. At the first three resonances, the Υ meson can only decay by the annihilation of b and a b quark, but at the fourth resonance, called the Υ(4S), there is enough energy in the excited stated to create a light quark/anti-quark pair, which results in production of a pair of B mesons.
Most data at Belle II is taken at Υ(4S) resonance, which is just enough energy for a B-meson pair production where no fragmentation particles are produced, however, the SuperKEKB accelerator has the capacity to deliver collisions in the COM energy range from just below the Υ(1S) (9.46 GeV) to just above the Υ(6S) (11.24 GeV) by tuning the energies of the colliding beams [5].
The SuperKEKB accelerator consists of two main storage rings, called the high energy
ring (HER) for the 7 GeV-electrons, and the low energy ring (LER) for the 4 GeV-
positrons. The positrons and electrons to be injected into their respective rings, are
16 2. The Belle II Experiment
Figure 2.2: Υ resonances cross sections [33]
provided by the linear accelerator (LINAC) and the 1 GeV positron Damping Ring (DR). The LINAC accelerates bunches of e
+/e
−to their target energies before they are injected into the main rings. Positrons need to be passed through the DR first since they are produced with too large an emittance for the nanobeam scheme (Section 2.2.2).
The electron and positron bunches collide at the center of the detector, at the so-called interaction point (IP) or the beamspot, at an angle of 83 mrad, allowing for ease of beam separation before and after collisions.
Figure 2.3: Projected luminosity of Belle II [34]
2.2.1 Luminosity
The target luminosity of SuperKEKB is a factor 40 larger than that of KEKB (Fig- ure 2.3), requiring a substantial upgrade to the accelerator complex. The essential elements in the increase of the luminosity are a reduction in the the beam size at the collision point by a factor of 20, from about 1 µ m to 50 nm, and an increase in the beam currents by a factor of 2 compared to the KEKB values.
This is known as a nanobeam scheme, and was invented by P. Raimondi for the
2.2 SuperKEKB 17
Figure 2.4: The SuperKEKB Schematic
Italian Super B Factory. Compared to KEKB, the two beams collide at an even larger angle of 83 mrad (22 mrad in KEKB). A somewhat lower beam energy asymmetry of 7 GeV (electrons) and 4 GeV (positrons), instead of 8 GeV and 3.5 GeV, was chosen to reduce the beam losses due to Touschek scattering in the lower energy beam. This leads to slight improvements in solid angle acceptance for missing energy decays, but it also reduces the spatial separation between the B mesons. Because of the reduced separation it is even more important to understand the vertex resolution in order to carry out time-dependent CP violation measurements.
The first generation B factories, KEKB and PEP-II achieved peak luminosities of 2.1 × 10
34cm
−2s
−1and 1.2 × 10
34cm
−2s
−1, respectively. To understand how the SuperKEKB design accounted for an almost two orders of magnitude increase, one must consider the factors determining the luminosity of a ring collider. The instantaneous luminosity achieved by ring colliders, including asymmetric ones, can be written as
L = γ
±2er
e1 + σ
∗yσ
∗xIξ
yβ
y∗±
![Figure 1.1: The Standard Model of Elementary Particles [2].](https://thumb-eu.123doks.com/thumbv2/1library_info/3998629.1540307/15.892.224.595.544.846/figure-standard-model-elementary-particles.webp)
![Figure 2.2: Υ resonances cross sections [33]](https://thumb-eu.123doks.com/thumbv2/1library_info/3998629.1540307/30.892.292.662.114.360/figure-υ-resonances-cross-sections.webp)
![Figure 2.6: The Belle II Detector [38]](https://thumb-eu.123doks.com/thumbv2/1library_info/3998629.1540307/34.892.282.670.287.559/figure-the-belle-ii-detector.webp)