Methods to quantify the performance of the primary vertex reconstruction in the ATLAS experiment under high luminosity conditions
This article has been downloaded from IOPscience. Please scroll down to see the full text article.
2012 J. Phys.: Conf. Ser. 396 022041
(http://iopscience.iop.org/1742-6596/396/2/022041)
Download details:
IP Address: 134.107.2.210
The article was downloaded on 24/01/2013 at 09:03
Please note that terms and conditions apply.
View the table of contents for this issue, or go to the journal homepage for more
Methods to quantify the performance of the primary vertex reconstruction in the ATLAS experiment
under high luminosity conditions
K. Grimm
a, E. Guido
b, F. Meloni
c, S. Pagan Griso
d, K. Prokofiev
e, M. Rudolph
f, A. Wildauer
gaUniversity of Lancaster, UK,bINFN, Italy,cUniversity of Milano, Italy,dLBNL, USA,eNew York University, USA,fUniversity of Toronto, Canada,gMax-Planck Institut f¨ur Physik, Munich, Germany
E-mail: Kirill.Prokofiev@cern.ch
Abstract. Presented in this contribution are methods currently developed and used by the ATLAS collaboration to measure the performance of the primary vertex reconstruction algorithms. With the increasing instantaneous luminosity at the LHC, many proton-proton collisions occur simultaneously in one bunch crossing. The correct identification of the primary vertex from a hard scattering process and the knowledge of the number of additional pile-up interactions is crucial for many physics analyses. Under high pile-up conditions, additional effects like splitting one vertex into many or reconstructing several interactions as one also become sizable effects. The mathematical methods, their software implementation, and studies presented in this contribution are methods currently developed and used by the ATLAS collaboration to measure the performance of the primary vertex reconstruction algorithms.
Statistical methods based on data and Monte Carlo simulation are both used to disentangle and understand the different contributions.
1. Introduction
During the data taking periods of 2011 and 2012 the ATLAS detector has first met the challenge of primary vertex reconstruction at high luminosity. Due to the large multiplicity of
ppcollisions overlapping in the same bunch crossing of the LHC, precise understanding of the reconstruction of collision vertices and collective effects due to the overlap of multiple vertices become crucial for successful physics analysis. The maximum mean numbers of events per bunch crossing during data taking in 2011 and 2012 are shown in Figure 1. The peak values reach 20 and 40 simultaneous
ppcollisions, respectively. These interactions are so called in-time pile-up; they are treated together as a single physics event by ATLAS trigger and reconstruction algorithms.
The presence of additional minimum-bias interactions in each bunch crossing obscures the hard-scatter physics signal of interest and makes the corresponding analysis more difficult.
Determination of the jet energy scale, missing
ET, tracker and calorimeter isolation variables
are all very sensitive to the presence of pile-up. In addition, the probability of reconstructing
fake tracks (random combination of detector hits) and using them for the vertex reconstruction
is increased. The correct identification of the hard-scatter primary vertex among all those
Day in 2011
28/02 30/04 30/06 30/08 31/10
Peak Interactions per Crossing
0 5 10 15 20 25 30 35
= 7 TeV s ATLAS Online
Single BCID BCID Average
(a)
Day in 2012 29/03 05/04 12/04 19/04 26/04 03/05 10/05 17/05
Peak Interactions per Crossing
0 10 20 30 40 50 60
= 8 TeV s ATLAS Online
Single BCID BCID Average
(b)
Figure 1: The maximum mean number of events per bunch crossing versus day in 2011 (a) and 2012 (b). The maximum pile-up for a bunch crossing is shown in green; the pile-up averaged over all the colliding bunches is shown in blue.
reconstructed depends both on the event multiplicity and the nature of the hard-scatter process.
Understanding the properties of the pile-up collisions improves the efficiency to identify the vertex corresponding to the hard-scatter process and thus improves efficiency of physics analyses that depend on this identification.
A straightforward way to measure the amount of in-time pile-up in each bunch crossing is to study the corresponding number of reconstructed primary vertices. With corrections for the detector acceptance, reconstruction efficiency and diffractive composition of the minimum bias events, this quantity represents a measure of the number of simultaneous collisions and thus of the luminosity. As we will demonstrate below, the relation between the number of reconstructed primary vertices and the number of
ppcollisions in a bunch crossing is not straightforward. It appears to be subject to several processes both dependent on and independent of the true event multiplicity for which we will employ hereafter the generic term “collective effects”.
2. Collective effects in primary vertex reconstruction
The presence of many minimum bias (pile-up) interactions in a bunch crossing gives rise to several effects previously rarely observed in collider experiments:
•
Production of fake primary vertices. Fake primary vertices are composed mostly of fake tracks. Fake tracks are random combinations of detector hits which happened to be identified as tracks by the pattern recognition algorithm.
•
Splitting of primary vertices A single
ppinteraction is reconstructed as several distinct primary vertices due to the resolution of the detector, secondary interactions, presence of jets and other relevant effects.
•
Merging and shadowing of primary vertices Several
ppinteractions contribute to a single reconstructed primary vertex, or the tracks produced in a hard-scatter
ppinteraction are divided between close-by pile-up vertices or merged with one of them, preventing the efficient reconstruction and identification of the primary vertex in question.
Taking into account all mentioned effects, the average number of reconstructed primary vertices,
N, given
G ppcollisions producing enough quality tracks within the detector acceptance can be written as:
< N >
(G) =
ρ(G) +φ(G) +σ(ρ(G))−µ(ρ(G)),(1)
2
where the individual terms are defined as follows:
• ρ(G) is the average number of reconstructible vertices due to the acceptance of the
detector and single-interaction reconstruction efficiency, assuming they are independently reconstructed.
• φ(G) is the average number of fake vertices, which depends on pile-up and, being related
to occupancy in the detector, is related to the number of interactions
G.• σ(ρ(G)) is the average number of vertices which are subject to splitting. This depends on
the number of reconstructible vertices
ρ(G).• µ(ρ(G)) is the average number of reconstructible vertices which are lost due to merging and
shadowing effects.
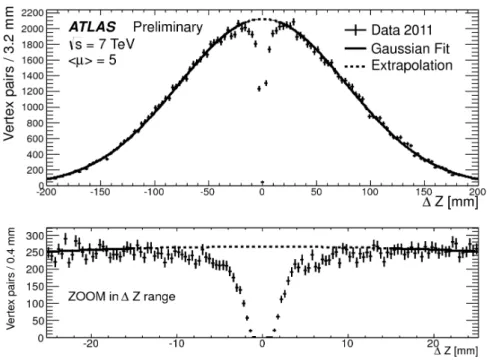
The effects of merging and shadowing can be seen in Figure 2, showing the longitudinal separation between the primary vertices for minimum bias events with exactly two reconstructed primary vertices. If the detector had infinitely good resolution, the expected distribution would be a Gaussian
1with a width
√2 times larger than the beamspot width. The shadowing effect is apparent, where the missing fraction of vertices in the region of small ∆z values shows the lack of reconstructed vertices corresponding to interactions too close to each other. The turn-on shape around the missing fraction is also slightly distorted because of split vertices. This distribution is used to estimate the fraction of vertices lost due to the shadowing effect,
µ(ρ(G)). The effectsof merging and splitting on hard-scattering interactions are studied further in simulation in Section 2.1.
Figure 2: Longitudinal separation between primary vertices for the minimum bias events with two reconstructed primary vertices. The data were collected using a minimum bias trigger in March-April 2011. The extrapolated Gaussian fit underlines the fraction of primary vertices missing due to merging of primary vertices at close distances.
1 Assuming the distribution of interaction to be Gaussian as well, as it is very well verified in data.
2.1. Data and Monte Carlo-based studies
To perform detailed studies of the performance of the vertex reconstruction in simulation, a track-based truth matching algorithm has been employed. For each reconstructed vertex in an event, all contributions to it from simulated proton-proton interactions and from fake tracks are determined. The procedure is as follows:
•
For each track in the event, its compatibility with a simulated stable charged particle from a proton-proton interaction is determined based on hit matching;
•
Unmatched tracks are considered fakes.
•
For a reconstructed vertex, each track used in the fit is associated with the corresponding simulated proton-proton interaction or labelled fake.
•
Contributing interactions (and the fake contribution) are ordered in terms of relative track weight; the largest contribution is said to dominate the vertex.
The results of this algorithm are used to classify and study different effects in the vertex reconstruction as a function of the number of interactions in an event for different physics processes. This is of primary interest in the case of the hard-scatter collision for different physics processes. The following categories of reconstructed hard-scatter vertices are identified:
•
Clean reconstruction - the event contains a vertex for which the generated hard-scatter interaction contributes at least 70% of the track weight, and this is the only vertex dominated by the hard-scatter.
•
Low pile-up contamination - the event contains a vertex with the generated hard-scatter interaction as dominant contributor with less than 70% of the track weight, and this is the only vertex dominated by the hard-scatter.
•
High pile-up contamination - the hard-scatter interaction contributes to some reconstructed vertex, but is merged with a pile-up interaction and provides less than half of the track weight.
•
Splitting - the hard-scatter vertex was split between two or more vertices, providing the dominant contribution to all of them, and the main split is considered as the reconstructed hard-scatter vertex.
•
Inefficiency - the hard-scatter interaction does not contribute to any reconstructed vertex.
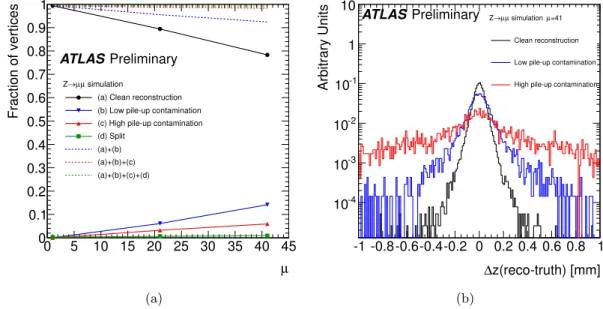
The first four categories are considered efficient; the hard-scatter reconstruction efficiency as a function of the number of interactions in the event for different physics processes is found in Figure 3. The relative importance of the different categories varies depending on the physics process of interest. The rates for each in the case of
Z→µ+µ−is seen in Figure 4 along with the effect on the resolution for the
zvertex position. For this process, the impact of splitting is small, but the effects of pile-up contamination are significant. As pile-up contamination increases, the resolution on teh vertex position degrades. For other processes with larger numbers of tracks and momentum like
t¯
tdecays these effects are less pronounced.
3. Identification of the hard-scatter primary vertex
After a successful reconstruction of the vertex associated to the hard-scattering interaction, it is of primary importance to be able to distinguish it from many other collisions that take place in the same bunch crossing, and therefore in the same recorded event. The preferred
2method currently used is based on the square root of the sum of the squared transverse momenta of the tracks used in the vertex reconstruction
qP
p2T
. The vertex with highest
qPp2T
is labeled
2 Other methods are also used in particular analyses, notably forH →γγsearches, leading to better results than what is shown here.
4
µ 0 5 10 15 20 25 30 35 40 45
Vertex Reconstruction Efficiency
0.98 0.985 0.99 0.995 1
Simulation t t
µ µ Z→
ee
Z→ ATLASPreliminary
Figure 3: Efficiency to reconstruct the hard-scatter interaction vertex as a function of the average number of
ppinteractions per bunch crossing for three distinct physics signatures. The points are calculated using the Monte Carlo simulation without analysis event selection.
µ 0 5 10 15 20 25 30 35 40 45
Fraction of vertices
0 0.1 0.2 0.3 0.4 0.5 0.6 0.7 0.8 0.9 1
simulation µ µ Z→
(a) Clean reconstruction (b) Low pile-up contamination (c) High pile-up contamination (d) Split
(a)+(b) (a)+(b)+(c) (a)+(b)+(c)+(d)
ATLASPreliminary
(a)
z(reco-truth) [mm]
∆
-1 -0.8-0.6-0.4-0.2 0 0.2 0.4 0.6 0.8 1
Arbitrary Units
10-4
10-3
10-2
10-1
1 10
=41 simulation µ µ µ Z→
Clean reconstruction
Low pile-up contamination
High pile-up contamination
ATLASPreliminary
(b)
Figure 4: (a): Fractions of reconstructed
Z → µ+µ−hard-scatter vertices categorized by different effects of the pile-up interactions as a function of the average number of
ppinteractions per bunch crossing. Low pile-up contamination refers to relative vertex weights between 30%
and 50% from non-hard-scatter tracks; high contamination occurs when the non-hard-scatter tracks contribute more than 50% of the weight. Split vertices are from events containing several vertices dominated by the hard-scatter interaction. Dashed lines show the sum of clean reconstruction and other individual contributions. The points are calculated using the Monte Carlo simulation without analysis event selection. (b): Residuals of the
zcoordinates of reconstructed primary vertices
Z → µ+µ−interactions overlayed with 40 pile-up interactions.
The three categories of clean reconstruction, low pile-up contamination, and high pile-up
contamination show progressively degrading resolution. The results are obtained using the
Monte Carlo simulation without analysis event selection.
as the hard-scattering vertex. In addition to full simulation studies, we use a semi-data-driven method to quickly estimate the performance of this algorithm and extrapolate it to higher numbers of pile-up interactions.
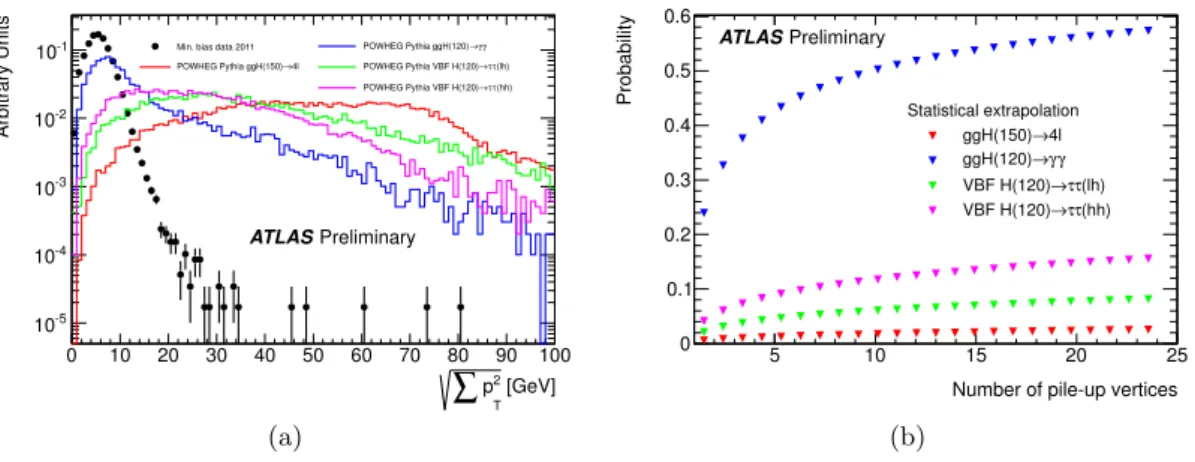
Figure 5a shows the distribution of
qPp2T
for vertices in minimum bias data with low pile- up contribution compared to the expected distribution for a few selected physics signatures.
The latter are obtained using a full simulation and plotting the
qPp2T
of the reconstructed vertex closest in position to the generated hard-scattering interaction. We then calculate the probability that in an event with a given number of reconstructed pile-up interactions
Nat least one of them has higher
q
Pp2T
than the one for the given physics signature. This probability is given by:
psignal
=
Z +∞0
Ssignal
(x)
·1
−1
− Z +∞x
SMB
(y)dy
N!dx (2)
where
Ssignaland
SMBare the normalized distribution of
qPp2T
for, respectively, the hard- scattering vertex considered and a minimum bias vertex. The results are shown in Figure 5b.
Physics signatures with many high-p
Tobjects in their final state, as in the case of
H→4`, show a probability of mis-identification less than 3% up to 25 reconstructed pile-up vertices. Other signatures, like
H → τ τ(hh), where the Higgs boson is produced through vector boson fusion, show a probability up to 15%. These numbers are obtained prior to any analysis selection, and we expect them to change if stricter analysis selections are applied, biasing considerably the
qPp2T
distribution of the reconstructed hard-scattering vertex. However this result offers a quick and easy way of estimating the performance of this algorithm up to a high number of interactions by means of a simple statistical extrapolation and can be used when full simulation is not yet available for such pile-up conditions.
[GeV]
2 T
∑
p0 10 20 30 40 50 60 70 80 90 100
Arbitrary Units
10-5
10-4
10-3
10-2
10-1 Min. bias data 2011
4l POWHEG Pythia ggH(150)→
γ γ POWHEG Pythia ggH(120)→
(lh) τ τ POWHEG Pythia VBF H(120)→
(hh) τ τ POWHEG Pythia VBF H(120)→
ATLASPreliminary
(a)
Number of pile-up vertices
5 10 15 20 25
Probability
0 0.1 0.2 0.3 0.4 0.5 0.6
Statistical extrapolation 4l ggH(150)→
γ γ ggH(120)→
(lh) τ τ VBF H(120)→
(hh) τ τ VBF H(120)→ ATLASPreliminary
(b)
Figure 5: (a): The distribution of
qPp2T
of tracks fitted to a primary vertex for single minimum bias interaction events recorded in 2011 and various hard scatter processes simulated with
powhegMonte Carlo generator. (b): Probability for a minimum bias pile-up vertex to have
qPp2T
of tracks greater than the one calculated for the hard-scatter primary vertex as a function of collision multiplicity. The points are obtained by statistical extrapolation of minimum bias data collected in 2011 and Monte Carlo simulation of hard scatter processes produced with the
powhegMonte Carlo generator.
6
4. Number of reconstructed vertices in high pile-up runs
The reconstruction of pile-up vertices is affected by several collective effects in the presence of pile-up, as described in Section 2 and summarized by Equation 1. A good reproduction of data by the Monte Carlo simulation is essential for studying the hard-scattering process as well.
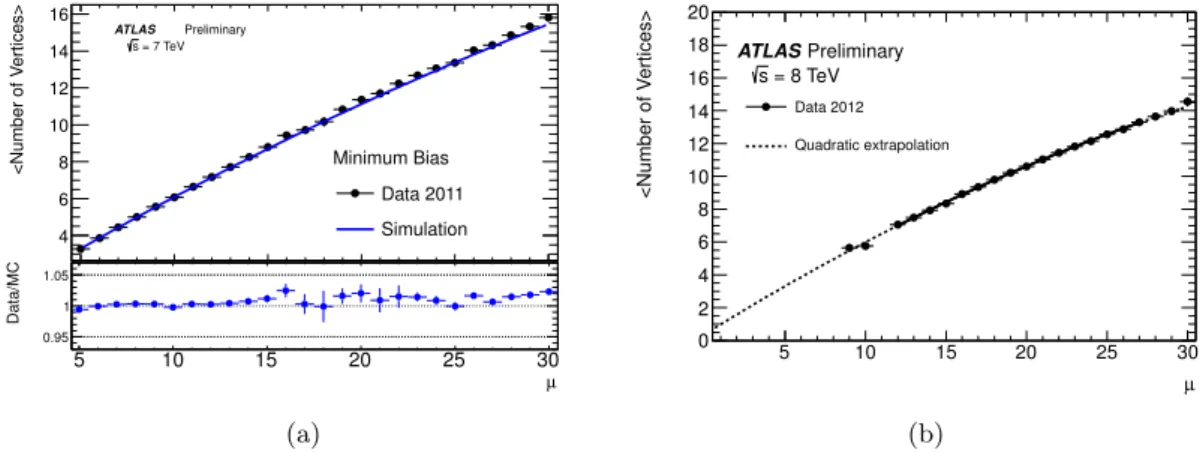
The average number of reconstructed vertices in a minimum bias sample is shown in Figure 6 as a function of the average number of interactions
µ, measured with independent luminositydetectors. For data collected in 2011 the range of
µvalues probed reaches
µ ∼30, including special LHC fills dedicated to study performance with high pile-up conditions. Figure 6a shows the agreement with Monte Carlo simulation for data collected in 2011. Simulation describes data within 2%, which is also within the uncertainties for the measured
µvalue in data [7]. The same range is also shown using the first data collected in 2012 in Figure 6b. For 2012 data we expect the fake vertex contribution to be negligible even at high pile-up, due to tighter quality selections of the input tracks used in the vertex reconstruction this year [8].
5 10 15 20 25 30
<Number of Vertices>
4 6 8 10 12 14 16
Minimum Bias Data 2011 Simulation
ATLAS Preliminary = 7 TeV s
µ
5 10 15 20 25 30
Data/MC
0.95 1 1.05
(a)
µ
5 10 15 20 25 30
<Number of Vertices>
0 2 4 6 8 10 12 14 16 18 20
Data 2012 Quadratic extrapolation ATLASPreliminary
= 8 TeV s
(b)
Figure 6: Average number of reconstructed primary vertices as a function of the average number of
ppinteractions per bunch crossing measured for the data of 2011 (a) and 2012 (b). Data are collected using the minimum bias trigger. The Monte Carlo estimation produced using the
pythia6AMBT2 tune as event generator is shown for the 2011 data. For the data of 2012, a second order polynomial fit is performed in the upper range of
µ. For the lower values of µthe result of mathematical extrapolation is shown. The requirements on reconstructed tracks considered for primary vertex reconstruction are tighter comparing to those used in 2011.
5. Conclusion
Presented in this contribution are methods used by the ATLAS collaboration to quantify pile- up related effects in primary vertex reconstruction. Various collective effects affecting the number of reconstructed primary vertices in pile-up conditions are observed in data. The factors influencing reconstruction efficiencies and resolutions are studied using Monte Carlo simulation.
The comparison of the number of primary vertices reconstructed in data to the average event multiplicity obtained from the luminosity detectors is performed. The minimum bias Monte Carlo is tuned accordingly, and excellent agreement with data for the whole sample collected in 2011 is observed.
6. References
[1] Strite S and Morkoc H 1992J. Vac. Sci. Technol.B101237
[2] Jain S C, Willander M, Narayan J and van Overstraeten R 2000J. Appl. Phys.87965
[3] Nakamura S, Senoh M, Nagahama S, Iwase N, Yamada T, Matsushita T, Kiyoku H and Sugimoto Y 1996 Japan. J. Appl. Phys.35L74
[4] Akasaki I, Sota S, Sakai H, Tanaka T, Koike M and Amano H 1996Electron. Lett.321105 [5] O’Leary S K, Foutz B E, Shur M S, Bhapkar U V and Eastman L F 1998J. Appl. Phys.83826 [6] Jenkins D W and Dow J D 1989Phys. Rev.B393317
[7] ATLAS Collaboration 2011 ATLAS-CONF-2011-116 [8] ATLAS Collaboration 2012 ATLAS-CONF-2012-042
8