Towards Defining the Role of CNS Circuits in Control of Energy
Homeostasis
I n a u g u r a l – D i s s e r t a t i o n
zur Erlangung des Doktorgrades
der Mathematisch-Naturwissenschaftlichen Fakultät der Universität Köln
vorgelegt von
Simon Heß
aus Adenau
Köln 2011
Prof. Dr. Jens Brüning
Tag der mündlichen Prüfung: 19 . 10 . 2011
Abbreviations ix
Abstract x
Zusammenfassung xii
1 Introduction 1
1 . 1 The central nervous system in control of energy homeostasis . . . . 2
1 . 2 Insulin and leptin signaling in the CNS . . . . 5
1 . 3 The ventromedial hypothalamus (VMH) . . . . 7
1 . 4 The dopaminergic system in control of energy homeostasis . . . . 10
1 . 4 . 1 Dopamine and the anatomy of the dopaminergic system . . . . 11
1 . 4 . 2 Physiology of dopaminergic signaling . . . . 13
1 . 4 . 3 The role of the dopaminergic system in food reward . . . . 16
1 . 5 The fat mass and obesity-associated protein (Fto) . . . . 20
1 . 6 Technical aspects . . . . 21
1 . 6 . 1 The perforated patch clamp technique . . . . 21
1 . 6 . 2 Pore-forming agents . . . . 22
1 . 7 Objectives . . . . 29
2 Materials and Methods 32 2 . 1 Animal care . . . . 32
2 . 2 Brain slice preparation . . . . 32
2 . 3 Patch-clamp clamp recordings . . . . 33
2 . 3 . 1 Whole cell recordings . . . . 35
2 . 3 . 2 Measurements of postsynaptic currents . . . . 35
2 . 3 . 3 Perforated-patch clamp recordings . . . . 36
2 . 3 . 4 Single cell labeling . . . . 36
. . Data analysis . . . .
3 Results 39
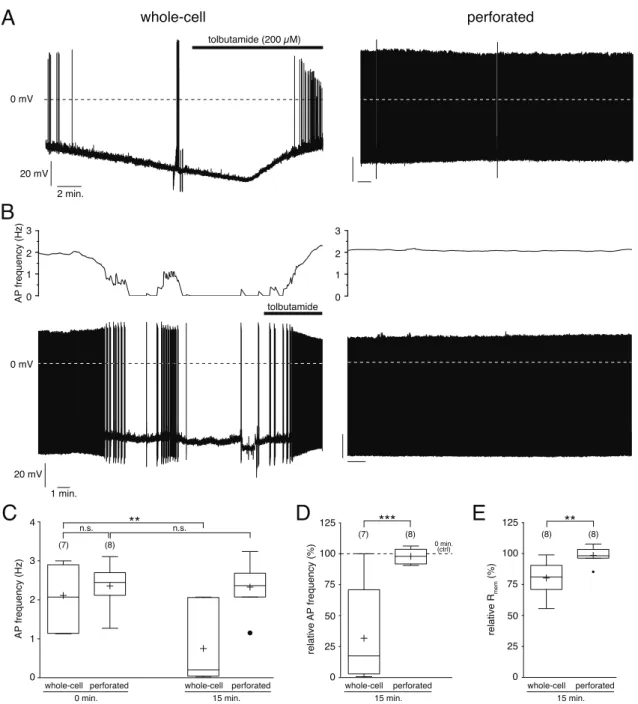
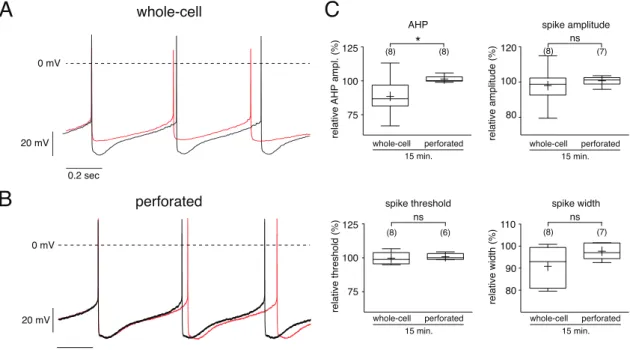
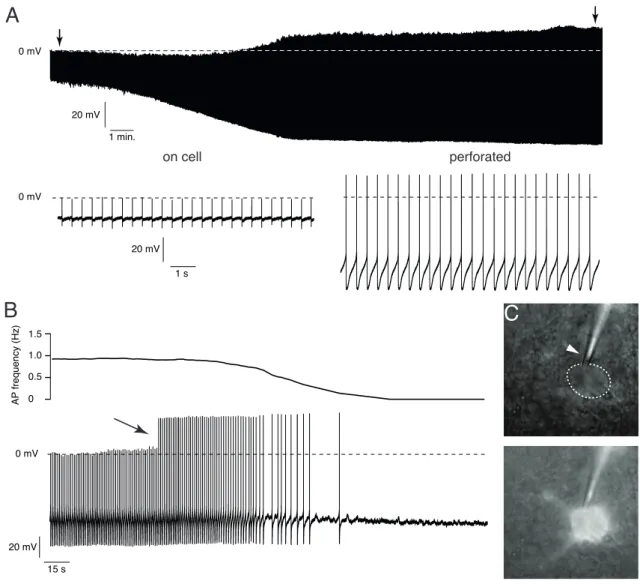
3 . 1 The perforated patch technique . . . . 39
3 . 1 . 1 Whole cell vs. perforated-patch clamp . . . . 39
3 . 1 . 2 Technical considerations . . . . 44
3 . 1 . 3 Ionophores . . . . 45
3 . 2 Regulation of SF-1 neurons in the ventromedial hypothalamus by fuel sensing signals . . . . 47
3 . 2 . 1 Properties of SF-1 neurons . . . . 47
3 . 2 . 2 Insulin hyperpolarizes and decreases the firing rate of SF-1 neurons 50 3 . 2 . 3 Ablation of insulin receptors in SF-1 neurons alters synaptic con- nectivity in HFD mice . . . . 53
3 . 3 Regulation of mesencephalic dopaminergic midbrain neurons by fuel sens- ing signals . . . . 55
3 . 3 . 1 Properties of mesencephalic dopaminergic neurons . . . . 55
3 . 3 . 2 Insulin activates the PI3-kinase pathway and increases the activity of mesencephalic dopaminergic neurons . . . . 58
3 . 3 . 3 The excitatory effect of insulin on mesencephalic dopaminergic neurons is cell-intrinsic . . . . 62
3 . 3 . 4 Wortmannin reverses the excitatory effect of insulin . . . . 64
3 . 4 Regulation of mesencephalic dopaminergic midbrain neurons by the obesity- associated Fto gene . . . . 66
3 . 4 . 1 Fto alters cocaine-induced responses of mesencephalic dopamin- ergic neurons . . . . 66
3 . 4 . 2 Fto regulates D
2-receptor-dependent control of firing in mesen- cephalic DA neurons in a cell-autonomous manner . . . . 70
3 . 4 . 3 D2R-signaling is necessary for cocaine-induced ‘rebound’ . . . . . 72
3 . 4 . 4 Fto affects the pacemaker efficacy in mesencephalic dopaminergic
neurons of cocaine-sensitized animals . . . . 74
4 . 1 The Perforated-Patch Configuration revisited . . . . 78 4 . 2 The ventromedial hypothalamus in control of energy homeostasis . . . . 80 4 . 2 . 1 Properties of SF-1 neurons . . . . 81 4 . 2 . 2 Insulin signaling modulates the neuronal activity of SF-1 neurons
and alters the synaptic connectivity in HFD mice . . . . 82 4 . 2 . 3 Outlook . . . . 85 4 . 3 Regulation of mesencephalic dopaminergic neurons by feeding-related
signals . . . . 87 4 . 3 . 1 Properties of mesencephalic dopaminergic neurons . . . . 88 4 . 3 . 2 Insulin signaling modulates the neuronal activity and alters the
synaptic connectivity of mesencephalic dopaminergic neurons . . 90 4 . 3 . 3 Outlook . . . . 92 4 . 4 Regulation of mesencephalic dopaminergic midbrain neurons by the obesity-
associated Fto gene . . . . 95 4 . 4 . 1 Fto alters cocaine-induced responses of mesencephalic dopamin-
ergic neurons . . . . 95 4 . 4 . 2 Fto regulates D
2-receptor-dependent control of firing in mesen-
cephalic DA neurons in a cell-autonomous manner . . . . 97 4 . 4 . 3 Fto affects the pacemaker efficacy in mesencephalic dopaminergic
neurons of cocaine-sensitized animals . . . . 98 4 . 4 . 4 Outlook . . . . 99
5 Appendix 101
5 . 1 SK currents decrease during whole cell recordings . . . . 101 5 . 2 Insulin activates the PI3-kinase pathway . . . . 102 5 . 3 Population response of mesencephalic DA neurons upon insulin treatment 103 5 . 4 Fto regulates the activity of the dopaminergic circuitry . . . . 104 5 . 5 Fto regulates D
2-receptor-dependent control of firing in mesencephalic
DA neurons in a cell-autonomous manner . . . . 104
List of Tables 109
Bibliography 110
Danksagung 130
Erklärung 132
Teilpublikationen 133
Curriculum Vitae 136
AB Antibody
AADC Aromatic amino acid decarboxylase AC Adenylate cyclase
ACTH Adrenocorticotrophic hormone AgRP Agouti-related protein
ARC Arcuate nucleus
ATP Adenosine triphosphate BBB Blood-brain-barrier BMI Body mass index
CA Catecholamine
cAMP cyclic adenosine monophosphate
CART Cocaine-amphetamine regulated transcript
CNQX 6-Cyano-7-nitroquinoxaline-2, 3-dione (AMPA/kainate receptor antagonist) CNS Central nervous system
CPP Conditioned place preference
CPu Caudate putamen
D2R Dopamine type 2 receptor
DA Dopamine/dopaminergic
DAG diacylglycerine
DAP-5 DL-2-amino-5-phosphopentanoic acid (NMDA receptor antagonist) DARPP-32 32 kD dopamine and cAMP-regulated phosphoprotein
DAT Dopamine transporter
DR Dopamine receptor
DBH Dopamine β-decarboxylase
DMSO Dimethyl sulfoxide DMT2 Diabetes mellitus type 2 FFA Free fatty acids
GABA γ-Aminobutyric acid
GHRH Growth hormone-releasing hormone
GIRK G-Protein activated inwardly rectifying potassium channel GPCR G-Protein coupled receptor
GR Ghrelin receptor HFD High-fat diet
i.c.v. intracerebroventricular IP
3Inositoltrisphosphate IR Insulin receptor
IRS Insulin-receptor-substrate JAK2 Janus kinase 2
K
ATPATP-dependent potassium channel LepR Leptin receptor
LH Lateral hypothalamus
MC3/4 Melanocortin receptor 3 and 4 MSN Medium spiny neuron
NA Numerical aperture NAc Nucleus accumbens NCD Normal chow diet NPY Neuropeptide Y
PDK Phosphatidylinositol-dependent kinase PFC Prefrontal cortex
PI3K Phosphatidylinositol-3-kinase
PIP Phosphatidylinositolphosphate
PIP
3phosphatidylinositol-3,4,5-bisphosphate PKC Protein kinase C
PLC Phospholipase C
PTX Picrotoxin (GABA
Areceptor antagonist) POMC Proopiomelanocortin
PP-1 Protein phosphatase 1
PTEN Phosphatase and tensin homolog PVN Paraventricular nucleus
RRA Retrorubral area R
SSeries resistance SF-1 Steroidogenic factor 1
SNP single nucleotide polymorphisms SNpc Substantia nigra pars compacta TH Tyrosine hydroxylase
TRPC Transient receptor potential channel VMAT2 Vesicular monoamine transporter 2 VMH Ventromedial hypothalamus VTA Ventral tegmental area WD Working distance
WHO World health organization
Healthy individuals are able to maintain a steady body weight over a long period of time due to an active process called energy homeostasis in which food intake is matched to energy expenditure with great precision. Once this tightly regulated system becomes unbalanced, weight gain and, on a longer time scale, obesity will develop. The control of energy homeostasis is accomplished by neuronal circuits within the CNS. These cir- cuits‚ are able to modulate food intake and energy expenditure in response to various peripheral signals related to energy stores.
Among the peripheral signals which have been found to directly act on the CNS cir- cuits in control energy of homeostasis is the pancreas-derived hormone insulin (Brüning et al. , 2000 ). Although, most studies focused on the role of insulin in neurons of the ar- cuate nucleus of the hypothalamus (ARC), insulin receptors are also expressed in other brain areas involved in the control of energy homeostasis such as the ventromedial hy- pothalamus (VMH) and the mesencephalon (Havrankova et al. , 1978 ).
In this thesis, the effect of insulin signaling on the electrophysiological properties of SF-1 neurons of the VMH and dopaminergic neurons of the mesencephalon was investigated. Perforated-patch recordings were performed to characterize insulin’s effect on the single-cell level and whole cell recordings were performed to investigated insulin signaling dependent alterations on a network level.
In the VMH, insulin directly hyperpolarizes a subset of SF-1 neurons via a PI3-kinase
signaling cascade. The reduction in firing rate is largely dependent on the activation of
ATP-dependent potassium channels (K
ATP). In contrast, insulin did not reduce the firing
rate of SF-1 neurons in which the insulin receptor was specifically deleted. On a network
level, ablation of insulin receptors in SF-1 neurons alters the synaptic connectivity in
mice subjected to a high-fat diet (HFD). Ablation of the insulin receptor results in the
increase of excitatory drive on anorexigenic POMC neurons in the ARC. Accordingly,
mice with a SF-1 neuron specific ablation of the insulin receptor are at least in part
protected against HFD-induced alterations of metabolic parameters.
of a subset of dopaminergic neurons. The excitatory effect of insulin is cell-intrinsic and is mediated via PI3K-dependent signaling. Ablation of the insulin receptor in dopaminergic neurons abolished this response. Furthermore, this ablation decreases the excitatory input on dopaminergic neurons. Thus, insulin signaling is involved in the establishment or maintenance of excitatory synaptic connections in mesencephalic dopaminergic neurons.
In spite of the dysregulation of fuel-related signals, variations of certain genetic fac- tors are also associated with the development of obesity and obesity-associated co- morbidities like type 2 diabetes. Among those variations, single nucleotide polymor- phisms within the FTO gene showed one of the most robust correlations with an in- crease in body mass index (Frayling et al. , 2007 ). The role of Fto was investigated in mesencephalic dopaminergic neurons using the perforated-patch configuration.
Ablation of Fto in mesencephalic dopaminergic neurons leads to profound alter-
ations in cocaine-evoked responses in such a way that the cocaine-induced inhibition
was strongly reduced in Fto-deficient mice. This altered response is also seen in mice
with a Fto-deletion specifically in dopaminergic neurons showing the effect of Fto is
cell-autonomous. Further pharmacological characterization could demonstrate that Fto
regulates the activity of dopaminergic neurons via alterations of dopamine receptor type
2 signaling. This notion is further supported by behavioral experiments and quantita-
tive realtime PCR. In summary, these findings reveal an Fto-dependent alteration of the
function of the mesencephalic dopaminergic circuitry.
Aufgrund des aktiven Prozesses der Energie-Homöostase bleibt das Körpergewicht bei gesunden Individuen über lange Zeit auf einem konstanten Niveau. Nahrungsauf- nahme und Energieverbrauch sind in diesem System präzise reguliert. Gerät dieser Regelkreis aus dem Gleichgewicht, kann dies zu einer Gewichtszunahme und über einen längeren Zeitraum zu Fettleibigkeit führen.
Die Energiehomöostase wird durch zentrale neuronale Netzwerke kontrolliert. Diese Netzwerke integrieren und verarbeiten periphere Signale, die in Abhängigkeit des En- ergiestatus ausgeschüttet werden. Dazu gehört das im Pankreas ausgeschüttete Hor- mon Insulin, welches neben vielfältiger peripherer Wirkungen auch direkt die ZNS- abhängige Kontrolle der Energiehomöostase beeinflusst (Brüning et al. , 2000 ). Insulin- rezeptoren werden in einer Reihe zentralnervöser Strukturen wie dem ventromedialen Hypothalamus (VMH) und dem Mesencephalon exprimiert (Havrankova et al. , 1978 ).
Die meisten Studien über die Rolle des Rezeptors konzentrierten sich bislang jedoch auf den Nucleus arcuatus (ARC).
In der vorliegenden Arbeit wurde daher die Wirkung von Insulin auf die elektrophys- iologischen Eigenschaften von SF-1 Neuronen des VMH und auf dopaminerge Neu- rone im Mesencephalon der Maus mittels der patch-clamp-Technik untersucht. Eines der wichtigsten Ergebnisse dieser Studien ist die durch Insulin verursachte, PI3-Kinase ab- hängige Hyperpolarisation und damit Inhibition einer Unterpopulation von SF-1 Neu- ronen im VMH. Weiterhin konnte gezeigt werden, dass der inhibitorische Effekt von In- sulin hauptsächlich auf die Aktivierung ATP-abhängiger Kaliumkanäle (K
ATP) zurück- zuführen ist. Im Gegensatz dazu ändert sich die Aktivität von SF-1 Neuronen mit einer spezifischen Deletion des Insulinrezeptors nach Insulinapplikation nicht. Auf der Net- zwerkebene konnte mittels whole cell patch-clamp Messungen gezeigt werden, dass die Deletion des Insulinrezeptors einen Einfluss auf die synaptische Konnektivität im VMH von Mäusen hat, die zuvor mit einer fettreichen Diät (HFD) gefüttert wurden.
Bei diesen Mäusen führt die Rezeptordeletion zu einem erhöhten exzitatorischen Ein-
hat. Somit sind Mäuse mit einer SF-1-spezifischen Insulinrezeptordeletion zumindest teilweise gegen HFD-induzierte Veränderungen metabolischer Parameter geschützt.
Im dopaminergen System des Mesencephalon konnte gezeigt werden, dass Insulin die elektrische Aktivität einer Unterpopulation dopaminerger Neurone erhöht. Weiter- hin konnte gezeigt werden, dass dieser Insulin-Effekt auf die Aktivierung des PI3-Kinase Signalweges zurückzuführen ist. Insulinrezeptordeletion in dopaminergen Neuronen hebt den Insulin-Effekt auf und führt zu einer Abnahme exzitatorischer Eingänge auf dopaminerge Neurone. Zusammenfassend konnte gezeigt werden, dass das Hormon Insulin die Aktivität dopaminerger Neurone beeinflusst. Es ist an der Etablierung und Aufrechterhaltung exzitatorischer Eingänge auf dopaminerge Zellen beteiligt.
Neben der Dysregulation peripherer Signale spielen auch Variationen bestimmter genetischer Faktoren eine Rolle bei der Entstehung von Fettleibigkeit. Die genetische Prädisposition begünstigt daher die Entstehung von Fettleibigkeit und die Manifesta- tion mit Fettleibigkeit verbundener Krankheiten wie Typ 2 Diabetes. Einzelnukleotid- Polymorphismen (SNPs) innerhalb des FTO-Gens zeigten dabei die stärksten Korrelatio- nen mit einem erhöhten body mass index (Frayling et al. , 2007 ). Mittels nicht-invasiver perforated-patch-Messungen an Gehirnschnitten von Mäusen wurde in dieser Arbeit die Rolle des Fto Gens in dopaminergen Neuronen des Mesencephalon untersucht.
Es konnte gezeigt werden, dass die Deletion von Fto zu tiefgreifenden Veränderungen
auf Kokain-vermittelter Effekte führt. Die Kokain-induzierte Inhibition dopaminerger
Neurone war in ubiquitär Fto-deletierten Mäusen geringer als in Kontrolltieren. Dieser
Effekt trat auch in Mäusen auf, die eine Fto-Deletion exklusiv in dopaminergen Neuro-
nen besaßen. Das deutet darauf hin, dass es sich um einen zellautonomen Effekt han-
delt. Anhand einer pharmakologischen Charakterisierung konnte gezeigt werden, dass
die Fto-abhängigen Veränderungen der Aktivität dopaminerger Zellen auf Veränderun-
gen des Dopaminrezeptor Typ 2-abhängigen Signalweges zurückzuführen ist. Diese
Ergebnisse wurden durch quantitative realtime PCR und Verhaltensversuche unter-
stützt. Zusammenfassend zeigen die Ergebnisse, dass Fto die Funktion des dopaminer-
gen Systems beeinflusst.
O besity is a health condition which has dramatically increased over the last decades and is now being regarded as an epidemic of global proportions. First noted in the United States, obesity has spread to other industrialized countries and is becoming a major health threat in economically developing nations such as China, Mexico and Brazil (Caballero, 2007 ; Popkin & Gordon-Larsen, 2004 ). In 2008 , 1 . 5 billion adults worldwide with an age of 20 years and older were overweight (defined as body mass index (BMI) ≥ 25 kg/m2; World Health Organization (WHO), 2007 ) and of these, nearly 500 million adults were obese (BMI ≥ 30 kg/m
2; WHO fact sheet no. 311 ). These alarming numbers have also been appreciated in a report by the WHO Regional Office for Europe which states that “excess body weight poses one of the most serious health challenges of the 21
stcentury for the WHO European Region” (WHO, 2009 ).
Hand in hand with the pandemic occurrence of overweight and obesity, associated co-morbidities like hypertension, stroke, cancer or diabetes mellitus type 2 (DMT2) are steadily increasing (Huxley et al. , 2009 ; Mosher et al. , 2009 ; Must et al. , 1999 ; Osmond et al. , 2009 ). Furthermore, a large body of evidence indicates that obesity and obesity- linked diseases like DMT2 negatively affect brain function (reviewed in Bruce-Keller et al. , 2009 ). Obesity leads to accelerated cognitive aging and age-related neurodegen- erative diseases, such as Alzheimer’s and Parkinson’s disease (reviewed in Luchsinger
& Mayeux, 2007 ; O’Rahilly, 2009 ; Yaffe, 2007 ). Therefore, factors contributing to the de- velopment of obesity are of great interest. Genetic predispositions in combination with environmental and behavioral factors, such as a sedentary lifestyle and unlimited avail- ability of highly nutritious energy-dense food result in a mismatch of food intake versus energy expenditure — the root cause of overweight and obesity. Once this tightly reg- ulated and fine-tuned system becomes unbalanced, weight gain, and on a longer time scale, obesity will develop (Morton et al. , 2006 ).
Hence, it is of greatest importance to define the homeostatic control mechanisms
involved in regulation of body weight and energy homeostasis in order to gain a full understanding of the development of obesity and related co-morbidities.
1.1 The central nervous system in control of energy homeostasis
Owing to environmental factors like emotions, time of day, convenience etc., energy intake as well as expenditure is subjected to day-to-day fluctuations. Despite these short-term imbalances, healthy individuals are able to maintain a steady body weight over very long time periods. This phenomenon reflects an active process called energy homeostasis in which cumulative food intake is matched with great precision to energy expenditure.
Nearly 60 years ago, Kennedy ( 1953 ) was the first who postulated that signals pro- portional to the amount of body fat modulate food intake and energy expenditure, thus maintaining energy homeostasis. A series of pioneering lesion studies in which different regions of the hypothalamus were destroyed demonstrated the pivotal role of the central nervous system (CNS) in the maintenance of energy homeostasis. Lesions of the ven- tromedial hypothalamus (VMH), paraventricular nucleus (PVN) and the dorsomedial hypothalamus (DMH) caused hyperphagia (excessive food intake) and obesity (Brobeck
& Tepperman, 1943 ; Hetherington, 1940 , 1944 ), whereas lesions of the lateral hypothala- mus (LH) led to hypophagia (reduced food intake; Brobeck, 1951 ). Further evidence in favor of Kennedy’s hypothesis came from parabiosis
1studies on hypothalamic lesioned rats. Rats with lesions in the VMH were merged with normal rats. While the animals which lacked the VMH developed obesity, the normal counterparts developed hypopha- gia and weight loss. These experiments demonstrated for the first time the presence of a satiety-mediating signal which provides a negative-feedback in proportion to body fat mass (Hervey, 1959 ).
During the following decades, the peripheral hormones insulin and leptin were iden-
tified as signals to convey the energy status to the brain. While insulin is produced
in pancreatic β-cells, leptin is derived from adipocytes. Both hormones are secreted
proportional to body fat content and cross the blood-brain-barrier (BBB) via a saturable
mechanism (Banks, 2006 ; Baura et al. , 1993 ). Insulin, as well as leptin, are satiety medi- ating (anorexigenic) and have been demonstrated to act directly on CNS neurons along with nutrients (i.e. glucose) and nutrient-related factors, such as free fatty acids (FFA;
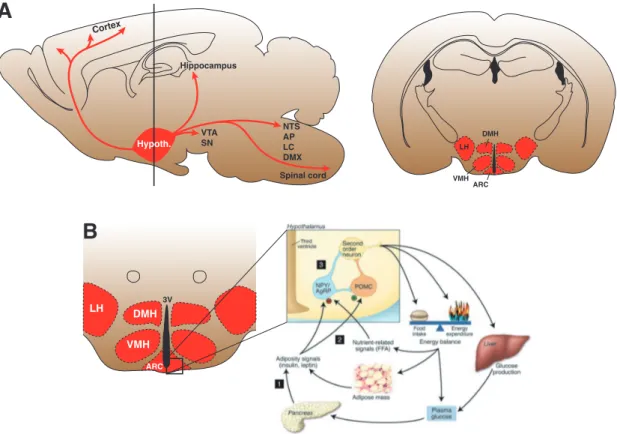
Brüning et al. , 2000 ; He et al. , 2006 ; Ibrahim et al. , 2003 ; Parton et al. , 2007 ; see figure 1 . 1 ). One of the brain regions with the highest expression of insulin and leptin receptors (IR, LepR) is the hypothalamus (see figure 1 . 1 ; Marks et al. , 1990 ). Within the hypotha- lamus, the arcuate nucleus (ARC) is anatomically uniquely positioned at the base of the hypothalamus. Here, the BBB is highly permeable and thus neurons which reside in the ARC are directly exposed to a large variety of bloodborne peripheral hormones (e.g.
leptin, insulin) and other fuel-related signals. Two neuronal subpopulations within the ARC are integral parts of a neuronal circuit called ’melanocortin system’ and are one of the best characterized pathways involved in the neuronal control of feeding and energy expenditure.
The first subpopulation expresses the anorexigenic peptides cocaine-amphetamine regulated transcript (CART) and the large precursor peptide proopiomelanocortin (POMC) which is further cleaved into melanocortins (α-, β-, γ-MSH), β-endorphin and adrenocorticotrophic hormone (ACTH). The second subpopulation expresses the hunger mediating (orexigenic) peptides agouti-related protein (AgRP) and neuropep- tide Y (NPY).
Current models suggest that POMC/CART neurons are stimulated by elevated levels of insulin and leptin which triggers the release of melanocortins. Of these, α- and β-MSH have been shown to potently reduce food intake and increase energy expenditure by activating melanocortin receptors (MC3/4R; Adan et al. , 1994 ). In contrast, AgRP/NPY neurons become activated by decreasing levels of insulin/leptin.
While NPY stimulates anabolic circuits, AgRP is a natural inverse agonist of MC3/4Rs
and thereby reduces the effect of POMC-derived melanocortins on these receptors
(Cone et al. , 1996 ; Stanley et al. , 1986 ). Furthermore, AgRP/NPY neurons provide uni-
directional GABAergic (inhibitory) input on POMC/CART neurons, thereby tonically
inhibiting POMC/CART-derived satiety signals. POMC/CART as well as AgRP/NPY
neurons project to a wide array of hypothalamic (i.e. PVN, LH, VMH and DMH) and
LH DMH
VMH
ARC 3V Hypoth.
Cortex
Spinal cord NTSAP LCDMX VTASN
Hippocampus
A
B
LH DMH
VMHARC
Figure 1.1: Diagram of hypothalamic projections and the melanocortin system. (A) left Saggital view of a mouse brain showing projections from the hypothalamus to target brain areas (red arrows). AP, area postrema; DMX, dorsal motor nucleus of the vagus; LC, locus coeruleus;
NTS, nucleus of the solitary tract; SN, substantia nigra; VTA, ventral tegmental area. right Coronal section of the mouse brain (vertical bar in A, left) showing the hypothalamic regions in control of energy homeostasis (not shown: PVN). ARC, nucleus arcuatus; DMH, dorsomedial hypothalamus; LH, lateral hypothalamus; PVN, paraventricular nucleus; VMH, ventromedial hypothalamus. (B) The melanocortin system. Food intake and energy expenditure are regulated by the brain in response to afferent input and signals from peripheral tissue, such as peripheral hormones like insulin and leptin and/or nutrient-related signals like FFA and glucose. In the ARC, a small neuronal network consisting of POMC and AgRP neurons integrates these signals accordingly. As a result, the output of “second-order neurons” is modulated which regulate food intake and energy expenditure. AgRP, agouti-related protein; FFA, free fatty acid; POMC, proopiomelanocortin; NPY, neuropeptide Y (Adapted from Gao & Horvath, 2007 ; Paxinos &
Franklin, 2008 ; Schwartz & Porte, 2005 ).
extrahypothalamic regions (Belgardt & Brüning, 2010 ; Cone, 2005 ). Here, POMC and AgRP neurons are reported to exert their effects on feeding via modulating the activity of “second-order neurons” located downstream of the ARC which in turn integrate and convey information to other brain regions such as the midbrain and the periphery.
However, the exact whereabouts of these neurons as well as the implicated neuronal
circuits in which these neurons act remain elusive.
1.2 Insulin and leptin signaling in the CNS
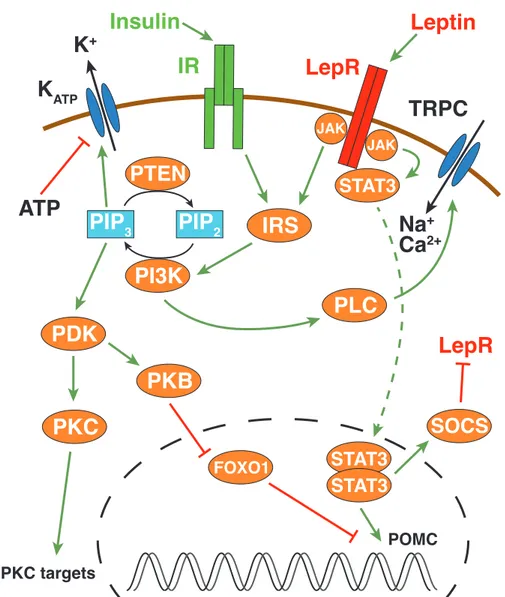
Insulin is a peptide hormone which is produced in pancreatic β-cells and its release is triggered by increased glucose concentrations (Polonsky, 2005 ). After its discovery in 1923 , insulin’s role in control of energy homeostasis was largely underestimated at first. It was thought to only act in the periphery, for instance in liver, muscle, or fat tissue without having any effect on the brain. However, almost 60 years later, it could be demonstrated in a primate model that insulin was able to reduce food intake and body weight when delivered to the brain by chronic intracerebroventricular (i.c.v.) infusion (Woods et al. , 1979 ). Further evidence emerged that insulin circulates in proportion to body fat mass (Bagdade et al. , 1967 ; Considine et al. , 1996 ) and that circulating insulin is transported across the BBB via a saturable mechanism (Baura et al. , 1993 ) render- ing insulin a key hormonal signal implicated in the CNS control of energy homeostasis (reviewed in Schwartz & Porte, 2005 ). In addition, studies in organisms like fruit flies (Drosophila melanogaster) point to an evolutionary conserved role for insulin’s action as an metabolic regulator (Garofalo, 2002 ). Initially, detailed knowledge of the insulin signaling cascade had been derived from peripheral tissue cells like muscle cells, pan- creatic β-cells, adipocytes and hepatocytes. During the last decade, it has been shown that insulin signaling works largely the same way in CNS neurons (Niswender et al. , 2003 ).
The insulin receptor belongs to the family of receptor tyrosine kinases and is a a disulfide-bonded dimer consisting of an α- and β-subunit. Upon activation by insulin, the intracellular β-subunit gets trans-autophosphorylated at multiple tyrosine residues thereby creating the binding site for insulin-receptor-substrate (IRS1 – 4) molecules, which then become phosphorylated by the intrinsic IR tyrosine kinase. In turn, IRS bind to and activates the 85kDa regulatory subunit (p85) of the phosphatidylinositol-3-kinase (PI3K) which releases the 110 kDa catalytic subunit (p110) from complex. Catalytically active PI3K is relocalized to the membrane and catalyzes the conversion of phosphatidyl- inositol-4,5-bisphosphate (PIP
2) into phosphatidylinositol-3,4,5-bisphosphate (PIP
3). Of note, the synthesis of PIP
3and therefore PI3K signaling is negatively regulated by the
‘phosphatase and tensin homolog’ (PTEN) which dephosphorylates PIP
3to PIP
2. PIP
3can exert immediate effects on neuronal activity by binding to ion channels, but also activates phosphatidylinositol-dependent kinase 1 (PDK1) which activates downstream targets such as protein kinase B (PKB a.k.a. AKT) and protein kinase C (PKC; Belgardt
& Brüning, 2010 ; Niswender & Schwartz, 2003 ; Plum et al. , 2006 b; Taniguchi et al. , 2006 ). In the ARC, insulin hyperpolarizes POMC as well as AgRP neurons via a PI3K–
dependent process which leads to an increase of the open probability of ATP-dependent potassium channels (K
ATP) following the local accumulation and binding of PIP
3(Kön- ner et al. , 2007 ; Plum et al. , 2006 a; Shyng & Nichols, 1998 ). Conversely, it has also been demonstrated that insulin depolarizes a subset of AgRP neurons in the ARC; however the involved ion channels have not yet been identified (Claret et al. , 2007 ). Besides immediate effect on neuronal excitability in hypothalamic neurons, insulin also plays a pivotal role in transcriptional regulation. As mentioned before, insulin signaling leads to the activation of PKB. Activation of PKB results in phosphorylation and nuclear ex- clusion of the forkhead transcription factor FOXO1 giving way for the binding of the signal transducer and activator of transcription (STAT3) to the POMC gene and subse- quent POMC transcription (Belgardt et al. , 2008 ). Consequently, generation of POMC leads to increased α-MSH levels resulting in a reduction of food intake.
Compared to insulin, the adipocyte-derived peptide hormone leptin is secreted by adipocytes, circulates proportional to the body fat mass (Frederich et al. , 1995 ) and has only been detected in several mammal species which suggests that it has evolved more recently (Doyon et al. , 2001 ). Leptin is the product of the ob gene and was first cloned in 1994 (Zhang et al. , 1994 ). Its anorexigenic effect was demonstrated in a series of experiments where chronic peritoneal injections of leptin were able to rescue the obese phenotype of ob/ob mice by normalizing metabolic parameters to values of lean controls (Pelleymounter et al. , 1995 ). Similar to insulin, leptin crosses the BBB via a saturable mechanism (Banks et al. , 1996 ).
The LepR belongs to the family of cytokine receptors and consists of a single mem-
brane spanning domain. While several isoforms exist, only the full length isoform is
capable of initiating intracellular signaling. Upon activation by leptin, LepRs trigger the
activation of janus kinase 2 (JAK2) which in turn phosphorylates the LepRs on several
residues creating a binding site for STAT3 molecules. STAT3 is also phosphorylated by JAKs and translocates to the nucleus following dimerization. Here, STAT3 induces the transcription of target genes – and in the case of POMC neurons – the POMC gene.
A negative feedback mechanism is provided by the supressors of cytokine signaling (SOCS) which are activated in response to STAT3 activation (Banks et al. , 2000 ; Bel- gardt & Brüning, 2010 ; Niswender & Schwartz, 2003 ). Similar to insulin, leptin also has immediate effects on neuronal activity. In the ARC it has been demonstrated that POMC neurons depolarize and increase their firing rate upon leptin stimulation (Cowley et al. , 2001 ). Conversely, it has also been reported that leptin hyperpolarizes glucose- responsive ARC and VMH neurons by activating K
ATPchannels (Spanswick et al. , 1997 ).
Evidence suggests that leptin’s excitatory effects are mediated by transient receptor po- tential channels (TRPC1,4,5), a non-selective cation channel in a PI3K-dependent process (Hill et al. , 2008 ; Qiu et al. , 2010 ). In fact, it has been reported that LepR-activated JAK2 phosphorylates IRS which in turn activates PI3K. Subsequently, PI3K activates phospho- lipase C (PLC) γ1 resulting in opening of TRPC (Qiu et al. , 2010 ).
Since insulin’s and leptin’s immediate effects on neuronal firing are both PI3K–
dependent, several studies suggest a “cross-talk” between insulin and leptin (Carval- heira et al. , 2005 ; Mirshamsi et al. , 2004 ; Niswender et al. , 2001 ). A recent report by Williams et al. ( 2010 ) has shown that IRs and LepR are differentially expressed in in- dividual POMC neurons of the ARC suggesting that the cross-talk between leptin and insulin occurs within a network of cells rather than within individual POMC neurons.
1.3 The ventromedial hypothalamus (VMH)
Early studies on the role of the CNS in control of energy homeostasis have identified the VMH as one of the key brain regions mediating anorexigenic effects (see 1 . 1 ). De- spite the notion for the VMH’s central importance in maintaining energy homeostasis, research focus shifted from the VMH to the ARC after the detection of the melanocortin system with the fuel-sensing POMC and AgRP neurons as two of its main components.
However, recent molecular and genetic experiments have led to increasing interest in
the feeding-related neuronal circuits which reside within the boundaries of the VMH.
K
ATPK
+TRPC
PKC
PKC targets
IR
Insulin Leptin
PIP
2PIP
3PI3K PDK
PKB
STAT3
JAK JAK
LepR
FOXO1 STAT3 STAT3
POMC
IRS
SOCS PLC
Na
+Ca
2+LepR PTEN
ATP
Figure 1.2: Overview of insulin and leptin signaling pathways (adapted from Belgardt & Brün- ing, 2010 ; Niswender et al. , 2003 ; Qiu et al. , 2010 ). Green arrows signify activation, red arrows inhibition; K
ATP, ATP-dependent potassium channel; FOXO 1 , forkhead transcription factor 1;
IRS, insulin-receptror-substrate; JAK, janus kinase; IR, insulin receptor; LepR, leptin receptor;
PDK1, phosphatidylinositol-dependent kinase 1; PIP
2, phosphatidylinositol-4,5-bisphosphate;
PIP
3, phosphatidylinositol-3-4,5-trisphosphate; PKB, protein kinase B; PKC, protein kinase C;
PLC, phospholipase C; SOCS, supressors of cytokine signaling; STAT3, signal transducer and activator of transcription; TRPC, transient receptor potential channel.
For instance, expression studies have shown that brain-derived neurotrophic factor (BDNF) is highly expressed in VMH neurons (Xu et al. , 2003 ). BDNF is an important regulator of glucose and lipid metabolism and genetic deficiency in BDNF or its recep- tor leads to obesity (Xu et al. , 2003 ). The studies on the BDNF effect in the VMH also revealed that the anorexigenic BDNF signaling is not dependent on the melanocortin system because BDNF was still able to reduce feeding in MC4R-deficient mice (Xu et al.
, 2003 ). Furthermore, immunohistochemical studies revealed that LepRs are highly ex-
pressed in VMH neurons and that leptin signaling directly modulates BDNF expression exclusively in VMH neurons. (Elmquist et al. , 1998 b). Leptin leads to an increase of BDNF transcripts whereas the reduction of leptin by fasting leads to a decrease (Komori et al. , 2006 ).
Efforts have been made to identify and characterize neuronal subpopulations within the VMH. Several studies revealed that neurons in the VMH can be separated by their responsiveness towards glucose. The glucose-responsive (GR) subpopulation of VMH neurons increase their activity in response to elevated glucose levels. In contrast to non- GR neurons, the activity of GR neurons is acutely modulated by peripheral hormones such as leptin and insulin (Miki et al. , 2001 ; Spanswick et al. , 1997 , 2000 ). Apart from the categorization based on physiological characteristics, ‘genetic’ markers for neuronal subpopulations are mandatory. Genetic manipulation of specific neurons allows the se- lective pertubation of defined neuronal circuits and the subsequent assessment of these manipulations in awake, unrestrained animals. In this regard, the utilization of the steroidogenic factor 1 (SF-1) as a genetic marker for VMH neurons has provided valu- able insights on the influence of the VMH on the maintenance of energy homeostasis.
SF-1 is a nuclear receptor which is expressed in several peripheral tissues (i.e.
adrenalcortex, testis, ovary, placenta, adipose tissue) and the brain (Parker & Schimmer, 1997 ). Within the brain, immunohistochemical analysis revealed that SF-1 is almost ex- clusively found in neuronal subpopulations of the VMH with the strongest localization in the dorsomedial part of the VMH (Shinoda et al. , 1995 ). Mice lacking SF-1 suffer from a failure to normally develop adrenal glands and gonads and also have an abnor- mally developed VMH (Ikeda et al. , 1995 ; Luo et al. , 1994 ). These mice, when rescued from lethality by adrenal transplantation, developed severe obesity resulting from both hyperphagia and reduced energy expenditure (Majdic et al. , 2002 ). Dhillon et al. ( 2006 ) showed that SF-1 neurons depolarize and increase their activity upon leptin treatment in contrast to non-SF-1 neurons in the VMH which respond with a hyperpolarization.
Additionally, disrupted leptin signaling in SF-1 neurons leads to obesity comparable to
the body weight phenotype of mice which specifically lack the LepR in POMC neurons
(Balthasar et al. , 2004 ). Interestingly, mice with a combined POMC, SF-1-specific LepR
knockout developed an increased body weight phenotype that was approximately the sum of that observed in either knockout mouse. This leads to the conclusion that leptin simultaneously acts on neuronal circuits within the VMH and the ARC and that leptin signaling in the VMH and ARC is independent from each other.
Output projections of the VMH have been thoroughly characterized by immunohisto- chemical means and show a diverse innervation pattern of many brain regions (Canteras et al. , 1994 ). Despite this, the question still remains of the functional nature of the con- nections between the VMH and other feeding-related brain areas, and how exactly VMH neurons modulate their target neurons. Sternson and colleagues ( 2005 ) demonstrated for the first time by using laser scanning photostimulation in rodent brain slices that neurons which are located in the medial VMH (mVMH) provide a strong glutamatergic (excitatory) input on POMC neurons of the ARC. Conversely, NPY neurons of the ARC receive only a sparse excitatory input from the lateral VMH (latVMH). However, inter- actions between VMH neurons and their targets are still only poorly understood. Thus, future work is required to better understand the impact of VMH signaling on energy homeostasis.
1.4 The dopaminergic system in control of energy homeostasis
The hypothalamus harbors the homeostatic system which integrates various energy store related hormonal and neuronal signals thereby maintaining energy homeostasis by matching food intake to energy expenditure. However, under certain conditions, the homeostatic system fails to adequately regulate food intake which might consequently result in the development of obesity. Recent advances in research on feeding related circuits in the hypothalamus have already pointed out that differences in hormonal sig- naling and genetic factors determine the individual’s susceptibility to obesity (Morton et al. , 2006 ; O’Rahilly, 2009 ). However, these findings cannot fully explain the develop- ment of the obesity epidemic during the last decades.
One explanation for this phenomenon might be that the neuronal circuits in control
of energy homeostasis have evolved under conditions where food was not abundantly
available. In this light, additional neuronal circuits which are capable of overriding
the homeostatic system might have co-evolved. As a consequence, further food intake would be promoted in times of plenty. The dopaminergic (DA) system which mediates the rewarding aspects of food and/or food predictive cues has been hypothesized to be one of the systems eligible to override the homeostatic sytem under certain circum- stances (Palmiter, 2007 ).
1.4.1 Dopamine and the anatomy of the dopaminergic system
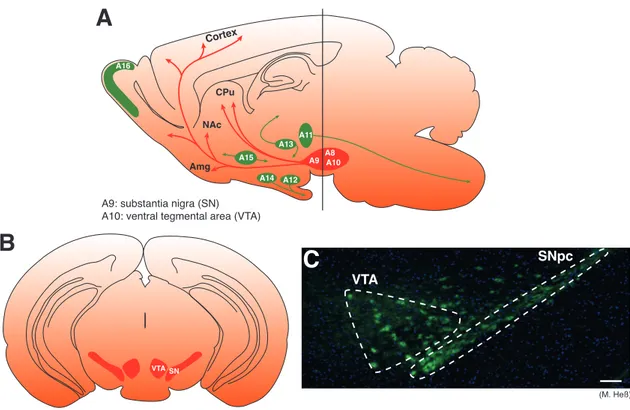
Dopamine, as well as noradrenaline and adrenaline, belong to the catecholamine (CA) class of monoamines. Dopamine and noradrenaline are the two primary CAs in the brain and were first identified in the brain nearly five decades ago by formaldehyde histofluorescence (Carlsson & Falck, 1962 ). Catecholaminergic neurons are localized in seventeen discrete cell groups which are distributed from the medulla oblongata to the olfactory bulb and retina. They were subsequently labeled ‘A 1 – A 17 ’ according to the nomenclature introduced by Dahlström & Fuxe ( 1964 ) which is still widely in use.
All CAs share the same synthesis pathway which starts with L-tyrosine. L-tyrosine is converted into L-DOPA by tyrosine hydroxylase (TH) and further converted into dopamine by the aromatic amino acid decarboxylase (AADC). Subsequently, dopamine serves as a precursor for the synthesis of noradrenaline by the dopamine β-decarboxylase (DBH) which in turn can further be catalyzed to adrenaline by the phenylethanolamine-N-methyl transferase. Advances in immunohistochemical tech- niques involving antibodies for CA-synthesizing enzymes and various CA neuron- specific components, such as the dopamine transporter (DAT) or the vesicular monoamine transporter 2 (VMAT2), rendered it possible to characterize and distinguish between the different CAs more accurately. These studies revealed a distribution pat- tern for dopaminergic (DA) neurons from the mesencephalon to the olfactory bulb and retina (A 8 – A 17 ; see figure 1 . 3 A).
The main source for brain dopamine is the DA neurons which are located in the mes-
encephalon (Bentivoglio & Morelli, 2005 ). Initially, DA neurons of the mesencephalon
were identified as a single continuous cell layer extending from the median to the lat-
eral part of the mesencephalon (Dahlström & Fuxe, 1964 ). These neurons were further
subdivided into separate cell groups (A 8 – A 10 ) according to anatomically established brain regions (A 8 : retrorubral area [RRA]; A 9 : substantia nigra pars compacta [SNpc];
A 10 : ventral tegmental area [VTA]; see figure 1 . 3 B,C).
These neuronal populations have been associated with three different systems: The nigrostriatal, the mesolimbic and mesocortical systems. The A 9 cell group (SNpc), which contains > 70 % of all DA neurons, projecting to the dorsal striatum (the caudate putamen [CPu]) along the nigrostriatal pathway. The A 10 neurons within the VTA projecting to the nucleus accumbens (NAc), the amygdala, the hippocampus, and the olfactory tubercle via the mesolimbic pathway and to the prefrontal cortex (PFC) via the mesocortical pathway. The A 8 cell group being a dorsal and caudal extension of the A 9 cell group contributes to all three pathways (Björklund & Dunnett, 2007 ).
Generally, the three DA pathways are associated with different functions. The ni- grostriatal pathway is associated with motor function since degeneration of DA neurons in the SNpc causes depletion of striatal dopamine resulting in severe motor dysfun- tions such as bradykinesia and rigidity, hallmarks of Parkinson’s disease (Burns et al.
, 1983 ; Iversen & Iversen, 2007 ). In contrast, the mesolimbic and mesocortical pathways are usually thought to be involved in complex processes like motivation, reinforcement, reward seeking behavior. Dysfunction of DA signaling along these pathways can lead to pathological conditions like addiction and schizophrenia (Kauer, 2004 ; Wise, 2006 ).
Many studies have shown that the three pathways are anatomically and function-
ally distinct from each other, for instance, DA neurons projecting to the striatum rarely
send collaterals to extrastriatal areas, but the cells of origin do not necessarily have to
be localized in the SNpc. Moreover, it has been shown by anterograde and retrograde
tracing experiments that A 9 (SNpc) and A 10 (VTA) DA neurons have overlapping pro-
jection targets (Björklund & Dunnett, 2007 ), and a large body of evidence suggests that
all DA systems participate in reward-related behavior and addiction (Wise, 2009 ). On
the cellular level, subsets of SNpc and VTA neurons have demonstrated the same char-
acteristic responses towards reward and reward-related cues which has led to pooled
electrophysiological data (Schultz, 1998 ), despite their heterogeneous electrophysiologi-
cal properties (Margolis et al. , 2006 ; Neuhoff et al. , 2002 ; Wolfart et al. , 2001 ).
Thus, the ‘classical’ model with its strict ‘division of duties’ between A 9 (SNpc) and A 10 (VTA) DA neurons is rather an oversimplification meaning that the mesencephalon constitutes a continuum in which DA neurons projecting to striatal or corticolimbic targets are intermingled.
SNpc VTA
A11
A12 A13 A14 A15 A16
A9 A10A8
A9: substantia nigra (SN) A10: ventral tegmental area (VTA)
VTA SN
(M. Heß)
A
CortexCPu NAc Amg
B C
Figure 1.3: Distribution of dopaminergic cell groups in the rodent brain. (A) Sagittal view of DA cell groups and their projections in the rodent brain. DA neurons are confined to distinctive cell groups (A 8 – A 17 ) from the mesencephalon to the olfactory bulb (Dahlström & Fuxe, 1964 ).
Cell groups in red show the localization and projections of mesencephalic DA neurons. (modified from Björklund & Dunnett, 2007 ; Paxinos & Franklin, 2008 ). (B) Coronal section at the level of the vertical bar in the left panel showing the localization of the VTA (A 10 ) and SNpc (A 9 ; modified from M. Heß, Paxinos & Franklin, 2008 ). (C) Immunohistochemistry for TH labeling DA neurons in the mesencephaleon. Dashed lines show the borders of VTA and SNpc. Green (TH), DA neurons; blue (DAPI), DNA. Scale bar: 100 µm (modified from M. Heß). Amg, amygdala; CPu, caudate putamen; DA, dopaminergic; NAc, nucleus accumbens; SNpc, substantia nigra pars compacta; TH, tyrosine hydroxylase, VTA, ventral tegmental area.
1.4.2 Physiology of dopaminergic signaling
In spite of the rather small number of DA neurons ( 400 , 000 – 600 , 000 neurons in humans
which equates ∼ 1 % of the total amount of neurons; Björklund & Dunnett, 2007 ), DA
signaling unfolds its potential by divergent projections within the target areas meaning
that every DA neuron connects to approx. 300 – 400 target neurons (Schultz, 1998 ).
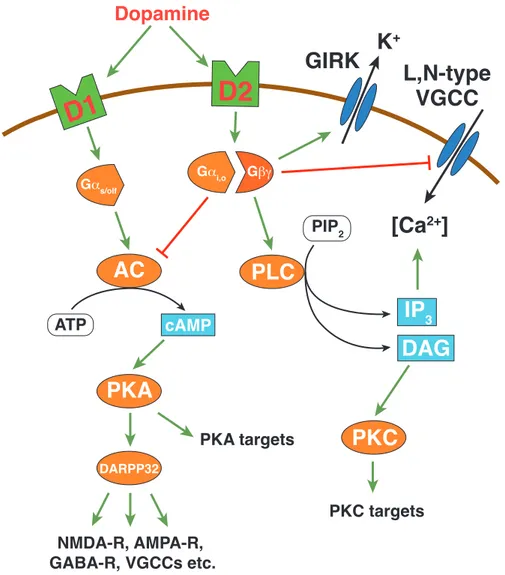
Dopamine exerts its cellular effects via G-protein coupled receptors (GPCRs) which can be separated into two classes: the D1- and D2-like family. Dopamine receptor dependent activation of intracellular signaling cascades modulates a large variety of cellular targets such as voltage-/ligand-gated ion channels, ion pumps or transcription factors (see figure 1 . 4 ; Calabresi et al. , 2007 ; Greengard et al. , 1999 . These dopamine- mediated alterations in cell-intrinsic properties play a pivotal role in reward, learning and drug addiction (Hyman et al. , 2006 ; Kauer & Malenka, 2007 ; Robinson & Berridge, 1993 ; Schilström et al. , 2006 ).
Initially, dopamine receptors were separated into D1-like and D2-like receptors based on their differential regulation of adenylate cyclase (AC) which catalyzes the conversion of adenosine triphosphate (ATP) to cyclic adenosine monophosphate (cAMP; Kebabian
& Calne, 1979 ). However, further advances in molecular biological techniques led to the discovery of multiple dopamine receptor subtypes which are either ‘D1-like’ (D1 and D5) or ‘D2-like’ (D2, D3 and D4) based on their structural, pharmacological and biochemical properties (Beaulieu & Gainetdinov, 2011 ; Missale et al. , 1998 ).
D1-like receptors are exclusively expressed postsynaptically on target cells of mes- encephalic DA neurons, such as medium spiny neurons (MSNs) in the striatum (Ben- tivoglio & Morelli, 2005 ). D1Rs activate the Gα
s/ol ffamiliy of G-proteins leading to an increase in cAMP concentration via activation of AC. Subsequently, elevated cAMP lev- els lead to the activation of protein kinase A (PKA), and the phosphorylation of the ‘32 kD dopamine and cAMP-regulated phosphoprotein’ (DARPP-32). This in turn, regu- lates a large variety of downstream targets via inhibiton of protein phosphatase-1 (PP-1;
see figure 1 . 4 ; Greengard, 2001 ; Hervé & Girault, 2005 ).
D2-like receptors exist in two splice variants (D2L, D2S) with the D2L variant be-
ing predominantly expressed in postsynaptic target cells and the D2S variant being
mostly presynaptically expressed as a autoreceptor in mesencephalic DA neurons (Ben-
tivoglio & Morelli, 2005 ; Giros et al. , 1989 ; Khan et al. , 1998 ). Furthermore, the D2S
variant possesses a higher sensitivity to dopamine over D2L receptors which renders
D2R-dependent effects on dopamine-associated brain functions more complex. Unlike
D1Rs, D2Rs have the opposite effect on cAMP production and downstream targets via
activation of the Gα
i/oG-protein causing AC inhibition. Furthermore, D2Rs modulate ion channel function in a more direct fashion than D1Rs via activation of the Gβγ sub- unit of the G-protein (Hervé & Girault, 2005 ). D2R-dependent activation of Gβγ has been demonstrated to directly inhibit L- and N-Type Ca
2+channels and to activate G- Protein activated inwardly rectifying potassium channels (GIRKs; see figure 1 . 4 ; Hervé
& Girault, 2005 ; Uchida et al. , 2000 ). A specific GIRK splice variant (GIRK2) is highly expressed in the mesencephalon (Karschin et al. , 1996 ). Therefore, D2 autoreceptors provide an important feedback mechanism to control the firing rate of DA neurons and the synthesis and release of dopamine in response to extracellular dopamine levels.
The firing rate of mesencephalic DA neurons determines how much dopamine is released in the respective target areas. In vivo, dopaminergic neurons show three main patterns of activity: 1 .) an inactive (hyperpolarized) state which is present in > 50 % of mesencephalic DA neurons (Grace & Bunney, 1984 ); 2 .) a slow ( 2 – 10 Hz), irregular single-spike or ‘tonic’ firing pattern which is driven by an intrinsic pacemaker and 3 .) a burst or ‘phasic’ firing pattern (Freeman et al. , 1985 ; Grace & Bunney, 1984 ; Overton
& Clark, 1997 ). A large body of evidence suggests that the activity of DA neurons code for the “reward prediction error”
2, such that an unpredicted reward triggers DA neuron burst firing (positive prediction error – “better than expected”), a reward as expected is reflected by tonic firing (“as expected”), and when the reward is “worse than expected” (negative prediction error) DA neurons stop firing (Schultz, 1998 , 2007 ).
On a synaptic level, it has been hypothesized that tonic firing of DA neurons provides a stable baseline level of extrasynaptic dopamine which preferentially stimulates the highly sensitive presynaptic D2Rs, whereas burst firing of DA neurons induces a fast, high amplitude, transient signal which is confined within the synapse owing to the reuptake by high-affinity DAT (Floresco et al. , 2003 ; Grace, 1991 ). For instance in the NAc, the two firing modes of DA neurons differentially modulate limbic and PFC input to the NAc such that PFC input is attenuated by tonic D2R activation, whereas the limbic input is increased by phasic D1R activation. Thus, changes in tonic and phasic dopamine transmission would shift the information flow between PFC inputs and limbic inputs thereby enabling behavior flexibility (Goto & Grace, 2005 ; Grace et al. , 2007 ).
2The “reward prediction error” is the difference between the predicted and obtained reward.
Interestingly, the diminished ability to recruit the PFC in drug users has been correlated with impulsivity resulting in a loss of control over drug use, a core feature of addiction (Volkow & Fowler, 2000 ).
In contrast, DA neurons in mesencephalic brain slice preparations only show tonic pacemaker activity or – in a very few cases – no activity (see chapter 3 . 3 . 1 ; Grace & Onn, 1989 ; Lacey et al. , 1989 ). In vivo data suggests that DA neurons are constantly receiving a strong GABAergic input mainly originating in the ventral pallidum holding half of the mesencephalic DA neurons in a hyperpolarized non-firing state (Floresco et al. , 2003 ; Grace & Bunney, 1985 ). On the other hand, burst firing in vivo is dependent on a combination of glutamatergic input from i.e. the PFC, pedunculopontine tegmentum (PPTg), the subthalamic nucleus (STN), the lateral preoptic-rostral hypothalamic area (Geisler et al. , 2007 ; Smith & Grace, 1992 ), and cholinergic input from the latero-dorsal tegmentum (LDTg; Lodge & Grace, 2006 ). In vitro electrophysiological recordings from slice preparations supports the aforementioned data since bursting activity can be induced in slice preparations by application of a combination of N-Methyl-D- aspartate (NMDA) and acetylcholine (ACh) or the bee venom apamin (Kitai et al. , 1999 ).
1.4.3 The role of the dopaminergic system in food reward
Food and water intake are among the most fundamental needs a living organism has on a daily basis, and everyone experiences the rewarding aspects of food. In fact, many behavioral studies on learning and memory are conducted using food reward paradigms. Food and food-related stimuli have been shown to increase dopamine levels in the NAc (Hernandez & Hoebel, 1988 ). Increases in dopamine transmission initi- ates changes in synaptic plasticity leading to long-term potentiation (LTP) or long-term depression (LTD), the major cellular mechanisms in learning and memory formation.
These learning processes will “consolidate (a) liking the rewarding goal, (b) learning
cues that predict its availability and actions that permit its consumption, and (c) as-
signing value and motivational status to the reward so that the organism can select
among numerous behavioral options and determine what level of resources to put to-
D1 D2
Gαi,o Gβγ
GIRK K
+L,N-type VGCC
[Ca
2+]
Gαs/olf
AC
Dopamine
PLC
IP
3DAG PKA
PKC
DARPP32
NMDA-R, AMPA-R, GABA-R, VGCCs etc.
PKC targets PKA targets
ATP
PIP
2cAMP
Figure 1.4: Overview of D1R and D2R signaling pathways (modified from Beaulieu & Gainet- dinov, 2011 ; Greengard, 2001 ). Green arrows signify activation, red arrows inhibition; AC, adeny- late cyclase; cAMP, cyclic adenosine monophosphate; ATP, adenosine triphosphate; DAG, diacylglycerine; DARPP32, 32 kD dopamine and cAMP-regulated phosphoprotein; GIRK, G-protein activated inwardly rectifying potassium channel; IP
3, inositoltrisphosphate; PIP
2, Phospatidylinositol-4,5-bisphosphate; PKA, protein kinase A; PKC, protein kinase C; PLC, phos- pholipase C, VGCC, voltage-gated calcium channel.
ward obtaining a specific goal” (in this case: acquisition of food; Hyman et al. , 2006 ).
Furthermore, changes of the motivational state by food restriction leads to the augmen- tation of the rewarding effects of drugs of abuse (i.e. cocaine) suggesting that food and drug reward is mediated by the same pathways (Carr, 2002 ). A study by Johnson &
Kenny ( 2010 ) suggests that overfeeding in mice leads to a decrease in responsiveness in brain reward circuits that were comparable to changes occurring after cocaine and heroin exposure.
Initial experiments nearly four decades ago have shown that ablation of DA neurons
projecting to the CPu along the nigrostriatal pathway resulted in starvation, further un- derlining the importance of dopamine transmission for feeding (Ungerstedt, 1971 ). In another set of experiments where dopamine deficiency was caused by DA neuron spe- cific TH deletion, food intake was attenuated in a similar manner and daily injections of L-DOPA restored feeding in these mice (Szczypka et al. , 1999 ; Zhou & Palmiter, 1995 ). Interestingly, adeno-associated virus (AAV)-mediated restoration of TH expres- sion in the CPu resulted in normalization of feeding behavior whereas TH restoration in the NAc did not (Szczypka et al. , 2001 ). Furthermore, blocking of D1Rs and D2Rs in the NAc did not prevent feeding but did attenuate the motivation of treated rats to work for food rewards in a lever pressing/feeding task (Nowend et al. , 2001 ). On the cellular level, electrophysiological studies demonstrated that food and food-predicting cues promote phasic firing in DA neurons which is associated with reward and reward- prediction thereby shaping future behavior towards the acquisition of food (Schultz et al.
, 1997 ).
Taken together, these results indicate that dopamine signaling plays a pivotal role for food intake and that feeding seems to be rather associated with dopamine release by DA neurons projecting along the nigrostriatal pathway than those projecting along the mesolimbic pathway.
During the last several years, evidence has emerged linking the hypothalamic system in control of energy homeostasis with the DA reward system. This led to the hypothesis that the ARC ‘funnels’ information from fuel-sensing signals like insulin and leptin in order to modulate the activity of the DA system via direct and indirect pathways (Gao
& Horvath, 2007 ). For example, it has been shown that orexinergic neurons of the LH project to the VTA (Fadel & Deutch, 2002 ) and that Orexin A potentiates NMDA receptor mediated currents of VTA DA neurons while Orexin A & B increase the firing rate of VTA DA and GABAergic neurons (Borgland et al. , 2006 ; Korotkova et al. , 2003 ).
On the other hand, there is accumulating evidence that the mesencephalon is directly
affected by fuel sensing signals since the presence of IRs, LepRs and ghrelin receptors
(GRs) were detected in the VTA as well as the SN. This suggests a more prominent role
of the DA system in feeding-related issues (Abizaid et al. , 2006 ; Elmquist et al. , 1998 a;
Figlewicz et al. , 2003 ; Havrankova et al. , 1978 ).
In fact, IRs as well as LepRs are functional in mesencephalic neurons since the down- stream targets of insulin and leptin signaling are activated upon insulin/leptin applica- tion (Figlewicz et al. , 2007 ; Hommel et al. , 2006 ). It has been shown that insulin signaling targets the DAT in DA neurons since i.c.v. injection of insulin leads to increased mRNA levels and functional activity of DAT (Figlewicz et al. , 1994 ). Higher DAT levels might then increase dopamine clearance thereby reducing the dopamine concentration in the target regions of DA signaling. Similarly, leptin is also thought to inhibit DA trans- mission because i.c.v. injection of leptin results in reduced dopamine content in the NAc and a reduction in food intake (Hommel et al. , 2006 ; Krügel et al. , 2003 ). Electro- physiological studies have shown that the in vivo firing rate of DA neurons decreased following intravenous leptin infusion and during acute leptin application in brain slices (Hommel et al. , 2006 ); however, it should be noted that the latter finding could not be verified in another study (Korotkova et al. , 2006 ). In the case of insulin, electrophys- iological evidence for an insulin effect in DA neurons is still lacking. Leptin, as well as insulin also reduce certain rewarding aspects of food which is shown by reduced sucrose self-administration and suppressed conditioned place preference (CPP) for su- crose and reversed CPP for high-fat diet (Figlewicz et al. , 2001 , 2004 , 2006 ). In contrast, ghrelin increased the firing rate of DA VTA neurons depending on the glutamatergic input and increased the number of excitatory inputs while decreasing inhibitory inputs.
Ghrelin injection into the VTA promotes food intake which can be blocked by a ghrelin receptor antagonist (Abizaid et al. , 2006 ). However, ghrelin signaling seems to be at least in part dependent on hypothalamus-derived peptides like orexin, NPY and AgrP, since peripherally applied ghrelin failed to elicit feeding in the absence of either of the peptides (Chen et al. , 2004 ; Toshinai et al. , 2003 ).
Taken together, a large body of evidence suggests that the DA system itself is sub-
ject to direct modulation by fuel-sensing peripheral signals which could alter feeding
behavior and the reward quality of food. Moreover, it has been hypothesized that the
DA system is not just another downstream target of hypothalamic neuronal populations
maintaining energy balance (‘funnel’ hypothesis), but that the DA system has the po- tential to override the homeostatic system of the hypothalamus which could lead to the development of obesity (Palmiter, 2007 ).
1.5 The fat mass and obesity-associated protein (Fto)
The disregulation of feeding-related circuits in the brain can seriously affect energy homeostasis and at worst, lead to the development of obesity and obesitiy-associated co-morbidities. Besides, variations in certain genetic factors might also predispose an individual to obesity.
Among those variations, single nucleotide polymorphisms (SNPs) within the first intron of the FTO gene showed one of the most robust associations with an increase in body mass index of children and adults (Dina et al. , 2007 ; Frayling et al. , 2007 ). The Fto gene is present in vertebrate evolution for at least 450 million years and is only detected in two species of algae which could be explained by horizontal gene transfer. Neither land plants nor invertebrates are carriers of the Fto gene. Studies on Fto expression revealed its presence in peripheral tissues and the brain. Detailed analysis in mouse brains showed abundant expression in feeding-related areas and that Fto is regulated by feeding and fasting (i.e. ARC, PVN, VMH; Fredriksson et al. , 2008 ; Gerken et al. , 2007 ).
Functional analysis of the Fto gene revealed that the Fto gene product shares simi- larities with Fe(II)- and 2-oxoglutarate-dependent oxygenases which are implicated in DNA repair and fatty acid metabolism (Clifton et al. , 2006 ). Accordingly, in vitro ex- periments showed that Fto localizes to the nucleus and catalyzes the demethylation of 3-methylthymine in single-stranded DNA and RNA (Gerken et al. , 2007 ; Jia et al. , 2008 ).
The involvement of the Fto gene on energy homeostasis was further confirmed in an
in vivo study with Fto knockout mice (Fischer et al. , 2009 ). Homozygous deletion of the
Fto gene resulted in a variety of effects such as a lean body phenotype, increased energy
expenditure, a reduced amount of adipose tissue and relative hyperphagia. Overexpres-
sion of the Fto gene in mice led to a dose-dependent increase in body weight and fat
mass. According to the study, increased body weight is not caused by reduced energy expenditure but by increased food consumption (hyperphagia; Church et al. , 2010 ).
1.6 Technical aspects
1.6.1 The perforated patch clamp technique
Since its development almost three decades ago by Hamill et al. ( 1981 ), the patch- clamp technique has been proven to be an enormously powerful tool for studying the electrophysiological properties of virtually every cell type.
Among the four configurations of the patch-clamp technique (whole cell, cell at- tached, inside-out, outside-out), the whole cell configuration is the one most widely used. It has replaced the intracellular recording technique with sharp microelectrodes in many electrophysiological studies for certain reasons: i) It can be used on very small cells; ii) The signal-to-noise ratio is improved, because the leak between the cell interior and the bath is very small; iii) The access resistance of the patch pipette is very low, a prerequisite for the study of macroscopic (’whole cell’) ionic currents; iv) It is possible to gain complete control over the cytosolic composition of the cell. The much larger pipette volume rapidly dialyzes the interior of the cell. This makes it possible to freely determine the ionic composition of the cytosol which facilitates the recording of ionic currents, e.g. GABA
Areceptor mediated currents (see 2 . 3 . 2 ).
However, the two latter advantages of the whole cell configuration can directly be linked to a major drawback. By exchanging the cytosol with the pipette solution cytoplasmic components are washed out. Such components can constitute second- messenger pathways or modulate ion channel function (voltage-dependent as well as ligand-operated). As a result the properties of the investigated cell will be altered.
This renders it almost impossible to use the whole cell configuration for certain studies in which second-messenger pathways are involved (for more examples see Akaike &
Harata ( 1994 ); Horn & Marty ( 1988 )).
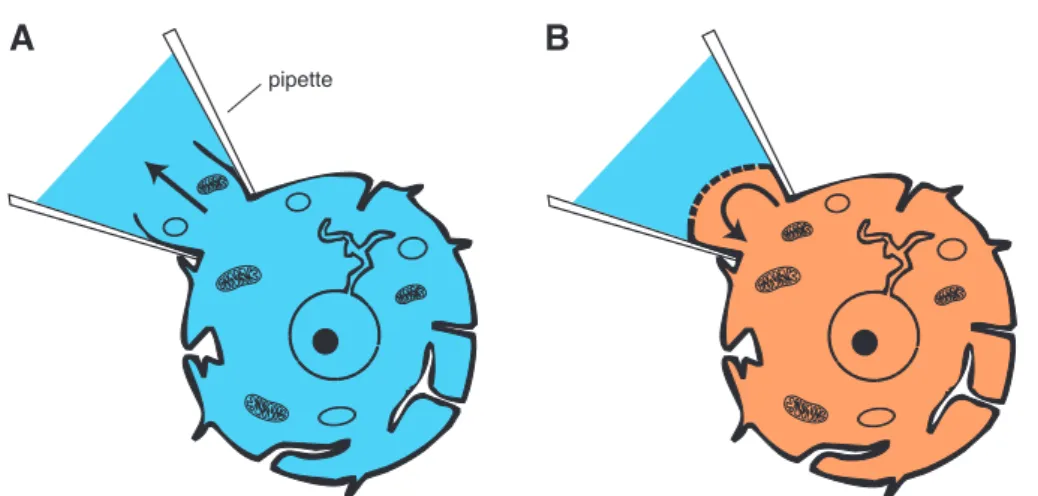
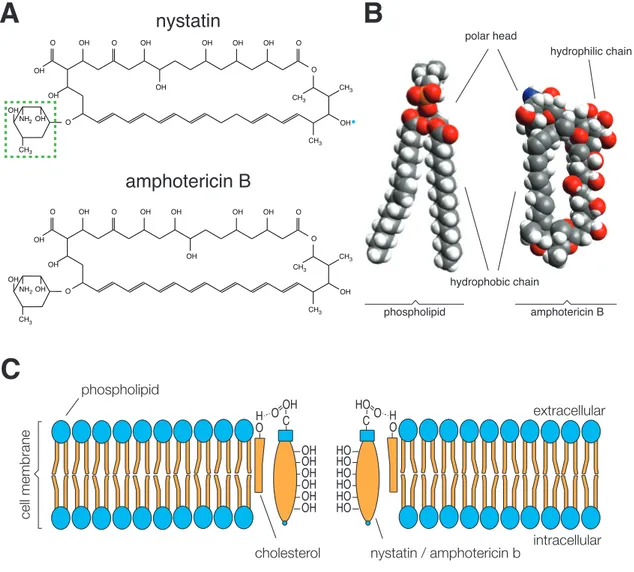
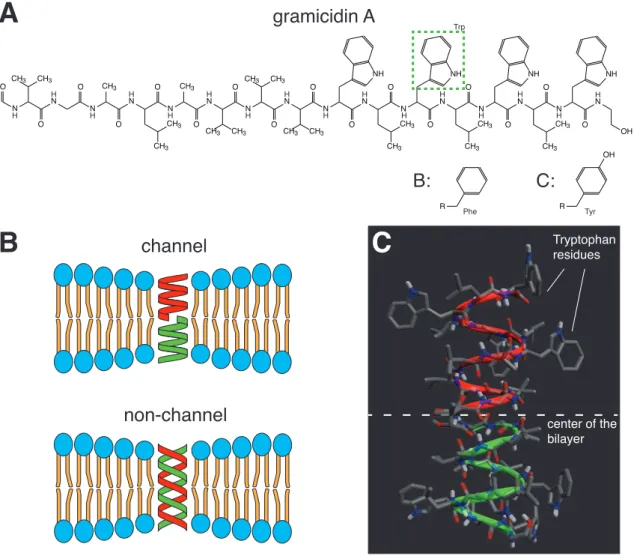
The perforated-patch configuration was developed to overcome this disadvantage of
the whole cell configuration. Instead of rupturing the membrane which leads to the
exchange of the cytosol with the pipette solution, pore-forming substances (ionophores) are used to gain electrical access to the cell’s interior without destroying the integrity of its cytoplasmatic components.
Thus, the perforated-patch configuration combines the major advantages of the whole cell configuration without the disadvantage of washing-out of second messenger systems.
A B
pipette