ATLAS-CONF-2014-050 17September2014
ATLAS NOTE
ATLAS-CONF-2014-050
17th September 2014
Search for charged Higgs bosons decaying via H
±→ τ
±ν in hadronic final states using pp collision data at √
s = 8 TeV with the ATLAS detector
The ATLAS Collaboration
Abstract
The results of a search for charged Higgs bosons decaying to a tau lepton and a neutrino, H
± → τ±ν, are presented. The analysis is based on 19.5 fb−1of proton-proton collision data at
√s
=8 TeV collected by the ATLAS experiment at the Large Hadron Charged Higgs bosons are searched for in events consistent with top-quark pair production or in associated production with a top quark. The final state is characterised by the presence of a hadronic
τdecay, missing transverse momentum, b-jets, a hadronically decaying W boson, and the absence of any isolated electrons or muons with high transverse momentum.
The data are consistent with the expected background from Standard Model processes. A statistical analysis leads to 95% confidence level upper limits on the product of branching ratios
B(t
→bH
±)
× B(H
± → τ±ν), between 0.23% and 1.3% for charged Higgs bosonmasses in the range 80–160 GeV. It also leads to 95% confidence level upper limits on the production cross section times branching ratio,
σ(pp→tH
±+X)×B(H
±→τ±ν), between0.76 pb and 4.5 fb, for charged Higgs boson masses ranging from 180 GeV to 1000 GeV.
c Copyright 2014 CERN for the benefit of the ATLAS Collaboration.
Reproduction of this article or parts of it is allowed as specified in the CC-BY-3.0 license.
1 Introduction
Charged Higgs bosons (H
+, H
−) are predicted by several non-minimal Higgs scenarios, such as Two Higgs Doublet Models (2HDM) [1] or models containing Higgs triplets [2–6]. As the Standard Model (SM) does not contain any elementary charged scalar particle, the observation of a charged Higgs bo- son
1would clearly indicate new phenomena beyond the SM. For instance, supersymmetric models predict the existence of charged Higgs bosons. In a type-II 2HDM, such as the Higgs sector of the Minimal Supersymmetric extension of the Standard Model (MSSM) [7–11], the main H
+production mode at the Large Hadron Collider (LHC) is through top-quark decays t
→bH
+, for charged Higgs boson masses (m
H+) smaller than the top-quark mass (m
top). At the LHC, top quarks are produced predominantly through t t ¯ production. In this note the contribution to t
→bH
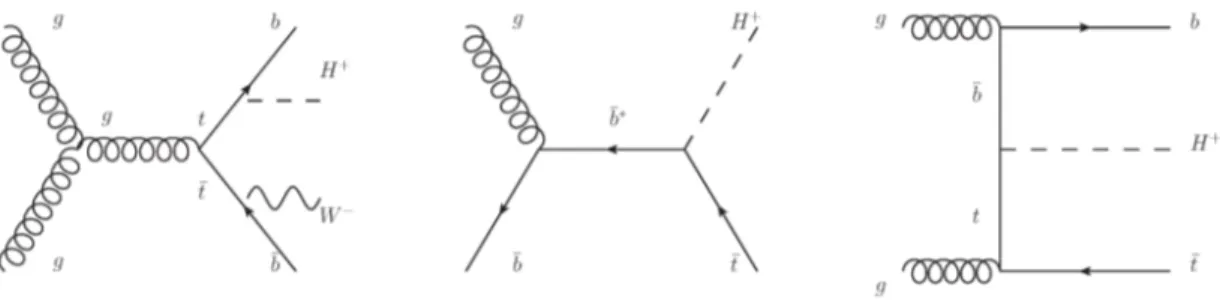
+which may arise from single top quark production is neglected. A diagram illustrating the leading-order production mech- anism is shown on the left-hand side of figure 1. For charged Higgs boson masses larger than m
top, the main H
+source at the LHC is through associated production with a top quark. An additional b quark can also appear in the final state. The leading-order production mechanisms in two different approximations are illustrated in the centre and right-hand side diagrams of figure 1; in the four-flavour scheme (4FS) b quarks are dynamically produced whereas in the five-flavour scheme (5FS) the b quark is also considered as an active flavour inside the proton. Their cross sections are matched according to ref. [12], and an evaluation of the two schemes can be found in ref. [13].
In the MSSM, the Higgs sector can be completely determined at tree level by one of the Higgs boson masses, here taken to be m
H+, and tan
β, the ratio of the vacuum expectation values of the twoHiggs doublets. For m
H+ <m
top, the decay via H
+→τ+νis dominant for tan
β >2 and remains sizeable for 1
<tan
β <2. For higher m
H+, the decay via H
+→τ+νis still significant, especially for large values of tan
β[14]. The combined LEP lower limit for the charged Higgs boson mass is about 90 GeV [15]. The Tevatron experiments placed upper limits on
B(t
→bH
+) in the 15–20% range for m
H+ <m
top[16, 17]. In a previous search based on data taken at
√s
=7 TeV with the ATLAS and CMS detectors, the limits on
B(t
→bH
+) were lowered to the range 0.8–4% [18, 19]. For all of these results,
B(H
+→τ+ν)=100% was assumed.
This note describes a search for charged Higgs bosons with masses in the ranges 80–160 GeV and 180–1000 GeV. The transition region 160 GeV
<m
H+ <180 GeV is not considered in this note, since there is currently no reliable theory calculation available for this region. The final state studied is char- acterised by the presence of a hadronic
τdecay (τ
had), missing transverse momentum (E
Tmiss), b-jets, a hadronically decaying W boson, and the absence of any isolated electrons or muons with high transverse momenta. In addition to the large branching ratio for a
τto decay hadronically, this final state contains only neutrinos associated with the H
+production and decay, resulting in good discriminating power between SM and signal processes. Charged Higgs bosons are searched for in a model-independent way, hence results are given in terms of
B(t
→bH
+)
× B(H
+ → τ+ν) (low mass search,m
H+ <m
top) and
σ(pp→tH ¯
++X)
× B(H
+→τ+ν) (high mass search,m
H+ >m
top). The results are based on 19.5 fb
−1of data from pp collisions at
√s
=8 TeV, collected in 2012 with the ATLAS experiment at the LHC.
The final state analysed for the low mass search is t t ¯
→b bW ¯
−H
+→b b(q ¯ q ¯
′)(τ
+hadν). The final state issimilar or identical for the high mass search, depending if the additional b-quark is seen in the detector,
gb →tH ¯
+ →(W
−b)H ¯
+ →(q q ¯
′b)(τ ¯
+hadν) in the 5FS calculation andgg →tbH ¯
+ →(W
−b)bH ¯
+ →(q q ¯
′b)b(τ ¯
+hadν) in the 4FS calculation.This note is organised as follows. In section 2, the data and simulated samples used in this ana-
1In the following, charged Higgs bosons are denoted byH+, and the charge-conjugate is implied.
lysis are described. In section 3, the reconstruction of physics objects in ATLAS is discussed. The event selection and background modelling are presented in section 4. Systematic uncertainties are discussed in section 5, and the limit setting procedure is described in section 6. Exclusion limits in terms of
B(t
→bH
+)
× B(H
+→τ+ν) (low mass) andσ(pp→tH ¯
++X)
× B(H
+→τ+ν) (high mass)are presented in section 7.
Figure 1: Leading-order Feynman diagrams for the dominant production modes of charged Higgs bosons at masses below (left) and above (centre and right) the top-quark mass.
2 Data and simulated events
The ATLAS detector [20] consists of an inner tracking detector with coverage in pseudorapidity
2up to
|η| =2.5, surrounded by a thin 2 T superconducting solenoid, a calorimeter system extending up to
|η| =4.9 and a muon spectrometer extending up to
|η| =2.7 that measures the deflection of muon tracks in the field of three superconducting toroid magnets. A three-level trigger system is used. The first level trigger (L1) is implemented in hardware, using a subset of detector information to reduce the event rate to a value of at most 75 kHz. This is followed by two software-based trigger levels (L2 and EF), which together further reduce the event rate to less than 1 kHz.
Only data taken with all ATLAS sub-systems operational are used. Stringent detector and data qual- ity requirements are applied, resulting in an integrated luminosity of 19.5 fb
−1for the 2012 data-taking period. The integrated luminosity has an uncertainty of 2.8%, measured following the methodology described in ref. [21]. Events are required to have a primary vertex with at least five associated tracks, each with a transverse momentum, p
T, greater than 400 MeV. The primary vertex is defined as the reconstructed vertex with the largest sum of squared track transverse momenta.
Backgrounds in this analysis are categorised based on the identity of the reconstructed object that is identified as the visible decay products (i.e. the non-neutrino decay products) of the hadronically- decaying
τcandidate (τ
had-vis). The dominant backgrounds in this analysis are estimated in a data- driven way, but simulation samples are used to estimate the minor background arising from events with a lepton misidentified as a
τhad-vis(1–2% of the total background). Simulation samples are also used to develop and validate the analysis. The processes which are background to this search include the SM pair production and decay of top quarks t t ¯
→b bW ¯
+W
−, as well as the production of single top- quark, W+jets, Z/γ
∗+jets, diboson and multi-jet events. Data-driven methods are used to estimate the2ATLAS uses a right-handed coordinate system with its origin at the nominal interaction point (IP) in the centre of the detector and thez-axis along the beam pipe. Thex-axis points from the IP to the centre of the LHC ring, and they-axis points upwards. Cylindrical coordinates (r, φ) are used in the transverse plane,φbeing the azimuthal angle around the beam pipe.
The pseudorapidity is defined in terms of the polar angleθasη=−ln tan(θ/2).
background with a true
τhad, where the
τhadis correctly identified, as well as the background where a jet is misidentified as a
τhad-viscandidate (sections 4.2 and 4.3).
The modelling of SM t t ¯ and single top-quark events is performed with MC@NLO [22, 23], except for the t-channel single top-quark production for which AcerMC [24] is used. The top-quark mass is set to 172.5 GeV and the set of parton distribution functions used is CT10 [25]. For events generated with MC@NLO, the parton shower, hadronisation and underlying event are added using HERWIG [26]
and JIMMY [27]. PYTHIA 6 [28] is used instead for events generated with AcerMC. Inclusive cross sections are taken from the approximate next-to-next-to-leading-order (NNLO) predictions for t t ¯ pro- duction [29], for single top-quark production in the t-channel and s-channel [30, 31], as well as for Wt production [32]. Overlaps between SM Wt and t t ¯ final states are removed [23]. Single vector bo- son (W and Z/γ
∗) production is simulated with up to five accompanying partons, using ALPGEN [33]
interfaced to HERWIG and JIMMY, and using the CTEQ6L1 [34] parton distribution functions. The additional partons produced in the matrix element part of the event generation can be light partons or heavy quarks. In the latter case, ALPGEN is also used to generate dedicated samples with matrix ele- ments for the production of massive b b ¯ or c¯ c pairs. Diboson events (WW , WZ and ZZ) are generated using HERWIG. The cross sections are normalised to NNLO predictions for W boson and Z/γ
∗pro- duction [35, 36] and to next-to-leading-order (NLO) predictions for diboson production [37]. The SM background samples are summarised in table 1.
Signal samples are produced with PYTHIA 6 and used for 80 GeV
<m
H+ <160 GeV separately for: t¯ t
→b bH ¯
+W
−and t¯ t
→b bH ¯
−W
+, where the charged Higgs bosons decay via H
+→τ+ν. Theprocess t t ¯
→b bH ¯
+H
−gives a very small contribution to the signal region, which is negligible after the event selection described in section 4.1. The cross section for these processes depends only on the total t¯ t production cross section and the branching ratio
B(t
→bH
+). For 180 GeV
<m
H+ <1000 GeV, the simulation of the signal for top-quark associated H
+production is performed with POWHEG [38]
interfaced to PYTHIA 8 [39]. The production cross section for the high mass charged Higgs boson is computed using the 4FS and 5FS, including theoretical uncertainties, and combined according to ref. [12]. The samples are generated at NLO using the 5FS and the narrow width approximation for the H
+, and possible effects from the interference between the production of a charged Higgs boson through t¯ t and top-associated production are not taken into account.
The event generators are tuned to describe the ATLAS data. In samples where PYTHIA 6 is in- terfaced to AcerMC, the AUET2B [41] tune is used. The PythiaPerugia2011C tune [42] is used when PYTHIA 6 is interfaced with POWHEG. For the samples generated with HERWIG, the AUET2 [43]
tune is used. In all samples with
τleptons, except for those simulated with PYTHIA 8, TAUOLA [44]
is used for the
τdecays. PHOTOS [45] is used for photon radiation from charged leptons in all samples where applicable.
To take into account the presence of multiple proton-proton interactions occurring in the same and neighbouring bunch crossings (referred to as pile-up), simulated minimum bias events are added to the hard process in each generated event. Prior to the analysis, simulated events are reweighted in order to match the distribution of the average number of pile-up interactions in the data. All generated events are propagated through a detailed GEANT4 simulation [46, 47] of the ATLAS detector and are reconstructed with the same algorithms as the data.
3 Physics object selection
Jets are reconstructed from energy deposits in calorimeters, using the anti-k
talgorithm [48, 49] with
a radius parameter of R
=0.4. Jets are required to have p
T >25 GeV and
|η| <2.5. To reduce the
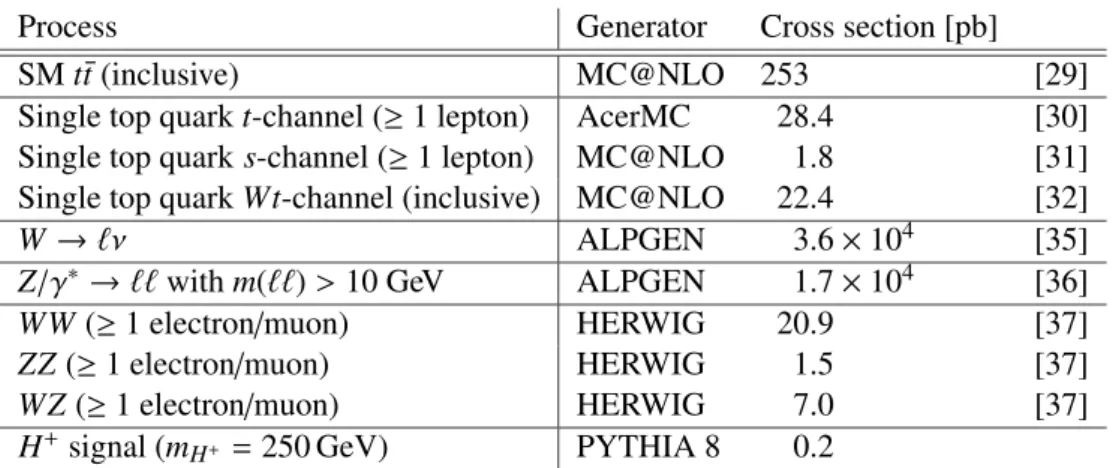
Process Generator Cross section [pb]
SM t t ¯ (inclusive) MC@NLO 253 [29]
Single top quark t-channel (
≥1 lepton) AcerMC 28.4 [30]
Single top quark s-channel (
≥1 lepton) MC@NLO 1.8 [31]
Single top quark Wt-channel (inclusive) MC@NLO 22.4 [32]
W
→ℓνALPGEN 3.6
×10
4[35]
Z/γ
∗→ℓℓwith m(ℓℓ)
>10 GeV ALPGEN 1.7
×10
4[36]
WW (
≥1 electron/muon) HERWIG 20.9 [37]
ZZ (
≥1 electron/muon) HERWIG 1.5 [37]
WZ (
≥1 electron/muon) HERWIG 7.0 [37]
H
+signal (m
H+ =250 GeV) PYTHIA 8 0.2
Table 1: Cross sections for the simulated processes and reference generators used to model them. For the heavy H
+signal selection, the value shown is the cross section times
B(H
+→τ+ν) for the MSSMm
maxhscenario [40], corresponding to m
H+ =250 GeV and tan
β =50. The low mass signal, which is not included in the table, assumes one H
+produced per t t ¯ decay, so it is a fraction of the t t ¯ cross section. The existing published limit on
B(t
→bH
+) for m
H+ =130 GeV is 0.9% [18].
contribution of jets initiated by pile-up, a “Jet Vertex Fraction” (JVF) [50], which combines tracking and vertexing information, is used for jets with p
T <50 GeV in the region with
|η|<2.4. The specific requirement is JVF
>0.5. An algorithm identifies jets containing b quarks by combining impact parameter information with the explicit determination of a secondary vertex [51], and these are referred to as b-tagged jets. A working point corresponding to a 70% efficiency for identifying b-quark initiated jets is used.
Candidates for identification as
τhad-visarise from jets reconstructed from energy deposits in calor- imeters, using the anti-k
talgorithm with a radius parameter of R
=0.4, which have p
T >10 GeV and one or three charged particle tracks within a narrower radius of
∆R <0.2 around the intermediate
τhad-visaxis [52]. These candidates are further required to have a visible transverse momentum (p
τT) of at least 20 GeV and to be within
|η| <2.3. The output of boosted decision tree algorithms [53, 54]
is used to distinguish
τhad-visfrom jets not initiated by
τleptons, separately for
τhaddecays with one or three charged tracks and with varying levels of tightness. In this analysis, a level of tightness with 40 (35)% efficiency for identification of 1(3)-prong
τhad-visis used, and this requirement is referred to as the
τhad-visidentification. Separate dedicated algorithms are used to reject electrons and muons that could be incorrectly identified as
τhad-vis[52]. After these algorithms are applied, the backgrounds arising from muons and electrons misidentified as
τhad-visare very small, though there is still a sizeable background from jets misidentified as
τhad-vis.
The E
missTis defined as the magnitude of the negative vectorial sum of transverse momenta of muons and energy deposits in the calorimeter. It is computed using fully calibrated and reconstructed physics objects [55].
The final states considered in this search contain no charged leptons, hence events containing isol-
ated electron or muon candidates with high transverse momenta are rejected. Electron candidates are
reconstructed from deposits in the calorimeter that are matched to tracks in the inner detector, taking
losses due to bremsstrahlung into account [56]. They are required to be isolated, to have a transverse
energy (E
T) greater than 25 GeV and to be within
|η| <2.47 (the transition region between the barrel
and end-cap calorimeters, 1.37
<|η|<1.52, is excluded). Muon candidates must pass tracking require-
ments in both the inner detector and the muon spectrometer, have p
T >25 GeV and
|η| <2.5, and be isolated [57].
4 Event selection and background modelling
4.1 Event selection
The analysis uses events passing a
τhad-vis+EmissTtrigger. The
τhad-vistrigger is defined by calorimeter energy in a narrow core and isolation regions at L1, a basic combination of tracking and calorimeter information at L2 and more sophisticated algorithms imported from the offline reconstruction at the EF. The E
missTtrigger uses calorimeter information at all levels with a more refined algorithm at the EF.
The EF threshold on the transverse momentum of the
τhad-vistrigger objects are 27 GeV or 29 GeV, and for the E
missTtrigger the EF thresholds are 40 GeV or 50 GeV. The multiple trigger thresholds are the result of slight changes of the trigger definition throughout the 2012 data-taking period, for which 50%
of events had EF thresholds at 27 GeV and 50 GeV, 43% at 29 GeV and 50 GeV, and 7% at 29 GeV and 40 GeV, for the
τhad-visand E
Tmisstriggers, respectively.
Further event filtering is performed by discarding events for which any jet with p
T >25 GeV fails the quality cuts, as discussed in ref. [58]. This ensures that no jet is consistent with having originated from instrumental effects or non-collision backgrounds. The following requirements are then applied:
•
at least four (three) selected jets for the low (high) mass signal selection;
•
at least one of these selected jets is b-tagged with a 70% efficient working point;
•
exactly one selected
τhad-viswith p
τT >40 GeV matched to a
τhad-vistrigger object (trigger- matched);
•
no selected electron or muon in the event;
•
E
Tmiss>65 (80) GeV for the low (high) mass signal selection;
•
to reject events in which a large reconstructed E
missTis due to the limited resolution of the energy measurement, the following cut is applied:
Emiss T
q
PpPV trkT >
6.5 (6) GeV
1/2for the low (high) mass signal selection, where
Pp
PV trkTis the sum of transverse momenta of all tracks originating from the primary vertex.
For the selected events, the transverse mass m
Tof the
τhad-visand E
missTis defined as:
m
T = q2p
τTE
Tmiss(1
−cos
∆φτ,miss), (1)
where
∆φτ,missis the azimuthal angle between the
τhad-visand the direction of the missing transverse momentum. This discriminating variable takes values lower than the W boson mass for W
→ τνbackground events and less than the H
+mass for signal events, in the absence of detector resolution effects.
A lower requirement is placed on m
Tat 20 (40) GeV in the low (high) mass H
+search. This
requirement is motivated in section 4.2.
4.2 Data-driven estimation of the backgrounds with a true τ
hadAn embedding method [59] is used to estimate the backgrounds that contain a real
τhad. The method is based a control data sample of
µ+jets events using similar criteria to those of the signal selectionexcept for the
τhad-visrequirements and replacing the detector signature of the muon by a simulated hadronic
τdecay. The method is performed on a control region of
µ+jets events, rather than e+jets, dueto the clean signature and the relative ease with which the measured muon can be removed. These new hybrid events are then used for the background prediction. An advantage of this approach compared to simulation is that, with the exception of the
τhad, the estimation is extracted from data, including the contributions from the underlying event and pile-up, jets, and all sources of E
Tmissexcept for the neutrino from the
τhaddecay. Furthermore, since the normalisation of the background estimate is evaluated from the data, assuming lepton universality of the W boson decay, the method does not rely on theoretical cross sections and their uncertainties. Thus, the largest background contribution in this analysis is estimated with minimal reliance on simulation and theory. This embedding method has been used successfully in previous charged Higgs boson searches [60] as well as in H
→ττ[61] analyses.
To select the
µ+jets sample from the data, the following requirements are defined:•
a single-muon trigger with a p
Tthreshold of 24 GeV or 36 GeV (single-muon triggers with two different p
Tthresholds are used, since the lower threshold trigger also requires the muon to be isolated);
•
exactly one isolated muon with p
T >25 GeV and no isolated electron with E
T >25 GeV;
•
at least four (three) jets with p
T >25 GeV for the low (high) mass charged Higgs boson search, at least one of which is b-tagged;
•
E
Tmiss>25 (40) GeV for the low (high) mass charged Higgs boson search.
This selection is looser than the selection defined in section 4.1 in order not to bias the sample.
However, the E
missTcut in the
µ+jets sample selection removes events with very lowm
T. Thus, a cut on m
T >20 (40) GeV is introduced in the search for low (high) mass charged Higgs bosons to remove this bias. With this selection, there is a possible small contamination from signal events with a leptonically decaying
τlepton. This small contamination, which is estimated using simulation, has a much softer m
Tdistribution than the signal with
τhad, and is observed to have a negligible impact on the evaluation of signal strength or exclusion limits. Contamination from leptonically decaying
τleptons from W decays is accounted for in the overall normalisation (c
τ→µin eq 3).
To replace a muon in the selected data, the track that is associated with the muon is removed.
The energy deposited in the calorimeter is removed by simulating a W
→µνevent with the same kinematics as in the selected data event and identifying the corresponding cells. Thus, the removal of energy deposits not associated with the selected muon is minimised. The momentum of the muon in selected events is extracted and rescaled to account for the higher
τlepton mass,
~
p
τ= qE
2µ−m
2τ q~
p
µ·~p
µ~
p
µ,(2)
where
~p
τis the rescaled momentum, E
µis the reconstructed energy of the muon, m
τis the
τmass, and
~p
µis the reconstructed muon momentum. The
τlepton with rescaled momentum is further
processed by TAUOLA to produce the hadronic
τdecay, account for the tau polarisation, and account
for final state radiation. The
τlepton decay products are propagated through a full detector simulation and reconstruction.
The shape of the m
Tdistributions for backgrounds with a true
τhadis taken from the distribution ob- tained with the embedded events, after applying the corresponding signal selection. The normalisation is then derived from the number of embedded events:
N
τ=N
embedded·1
−c
τ→µǫτ+EmissT −trigger
ǫµ−ID,trigger × B
(τ
→hadrons
+ν),(3) where N
τis the estimated number of events with a true
τhad, N
embeddedis the number of embedded events in the signal region, c
τ→µis the fraction of events in which the selected muon is a decay product of a
τlepton (taken from simulation, about 4%),
ǫτ+ETmiss−triggeris the
τhad-vis+EmissTtrigger efficiency (as a function of p
τTand E
missT, derived from data, see section 4.5),
ǫµ−ID,triggeris the muon trigger and identification efficiency (as a function of p
Tand
η, derived from data) andB(τ
→hadrons
+ν) is thebranching ratio of the
τlepton decays involving hadrons.
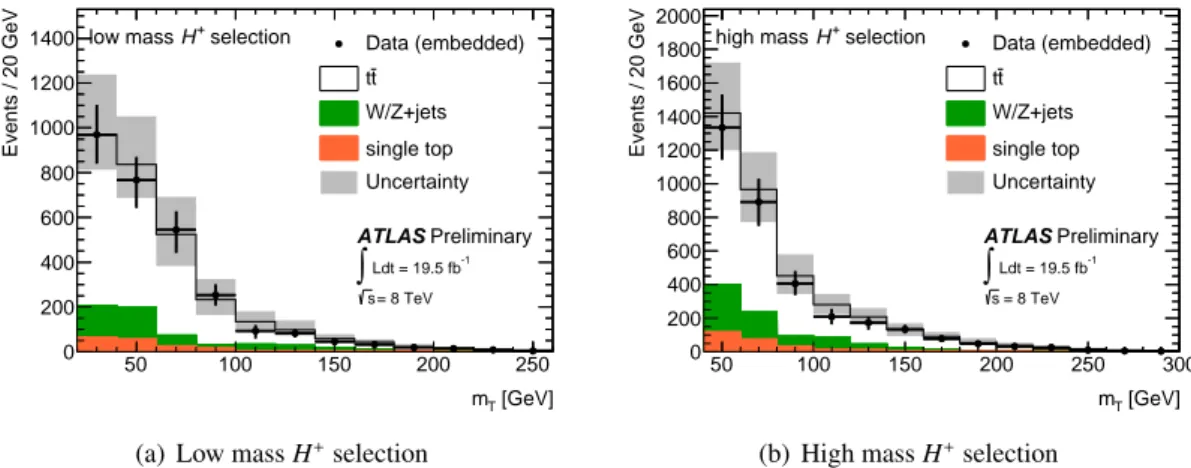
The m
Tdistributions for selected events with a true
τhad, as obtained with the embedding method, are shown in figure 2 and compared to simulation.
[GeV]
mT
50 100 150 200 250
Events / 20 GeV
0 200 400 600 800 1000 1200
1400 Data (embedded)
single top W/Z+jets
t t
Uncertainty selection
H+
low mass
ATLAS Preliminary
Ldt = 19.5 fb-1
∫
= 8 TeV s
(a) Low massH+selection
[GeV]
mT
50 100 150 200 250 300
Events / 20 GeV
0 200 400 600 800 1000 1200 1400 1600 1800 2000
Data (embedded)
single top W/Z+jets
t t
Uncertainty selection
H+
high mass
ATLAS Preliminary
Ldt = 19.5 fb-1
∫
= 8 TeV s
(b) High massH+selection
Figure 2: Comparison of the m
Tdistributions for events with a true
τhadfor the low mass (a) and high mass (b) charged Higgs boson search, as predicted by the embedding method and simulation.
Combined statistical and systematic uncertainties (as described in section 5) for the embedded sample are shown as error bars, and all systematic uncertainties applicable to simulation are shown as hatched bands.
4.3 Data-driven estimation of the multi-jet backgrounds
For the data-driven estimation of the backgrounds with a jet misidentified as a
τhad-vis, two data samples are defined, differing only in
τhad-visidentification criteria. The tight sample contains a larger fraction of events with a real
τhad-vis, which are required to pass the tight
τhad-visidentification selection described in the object selection, in addition to the trigger matching required in the event selection of section 4.1.
The loose sample, which contains a larger fraction of events with a misidentified
τhad-vis, is obtained by
removing the
τhad-visidentification requirement that was applied in the tight sample. By construction,
the tight data sample is a subset of the loose data sample.
The loose sample consists of N
rand N
mevents with, respectively, a real or misidentified
τhad-vis. It also consists of N
Levents with a
τhad-vispassing a loose but not tight selection, and N
Tevents in which the
τhad-visfulfills the tight selection. Using the efficiencies p
rand p
mfor a real or misidentified loose
τhad-vis, respectively, to pass the tight criteria, the following relation can be established:
N
TN
L!
=
p
rp
m(1
−p
r) (1
−p
m)
!
×
N
rN
m!
.
(4)
In turn, after having inverted the 2
×2 matrix above, the number of events in which the misidentified
τhad-vispasses the tight selection can be written as:
N
Tm=p
mN
m=p
mp
rp
r−p
mN
L+p
m(p
r−1) p
r−p
mN
T.(5)
The final values of p
rand p
mare parameterised in terms of the number of charged particle tracks in the core cone (∆R
≤0.2) and the number of charged particle tracks in the hollow isolation cone (0.2
< ∆R<0.4) around the
τhad-visintermediate axis [52], as well as the p
Tand
|η|of the
τhad-vis. Correlations between the variables used for parameterisation are found to have a negligible effect on the method.
Having computed the identification and misidentification efficiencies p
rand p
m, every event in the loose sample is given a weight
was follows, in order to estimate the background with a misidentified
τhad-visin the tight sample:
•
for an event with a loose but not tight
τhad-vis,
wL =p
mp
rp
r−p
m;
•
for an event with a tight
τhad-vis,
wT =p
m( p
r−1) p
r−p
m.
The probability p
ris determined using true
τhad-visin simulated t t ¯ events in the signal region. The probability p
mis measured in a W+jets control region in data. Events in this control region are triggered by a combined trigger requiring an electron with E
T >18 GeV or a muon with p
T >15 GeV in addition to a
τhad-vis. In both cases, the
τhad-vistrigger object has a p
Tthreshold of 20 GeV. The control region must have exactly one trigger-matched, reconstructed electron or muon, in addition to a trigger- matched, reconstructed, loose
τhad-vis. The control region is also required to have zero b-tagged jets and m
T(e/µ, E
missT)
>50 GeV (using eq 1, with the
τhad-visreplaced by the electron or muon). The contamination from correctly reconstructed
τhad-vis(7%) and electrons or muons mis-reconstructed as
τhad-vis(5%) is subtracted using simulation. Signal processes contribute negligibly to this region (< 0.1%).
Background events with jets misidentified as
τhad-visare a major background in the high m
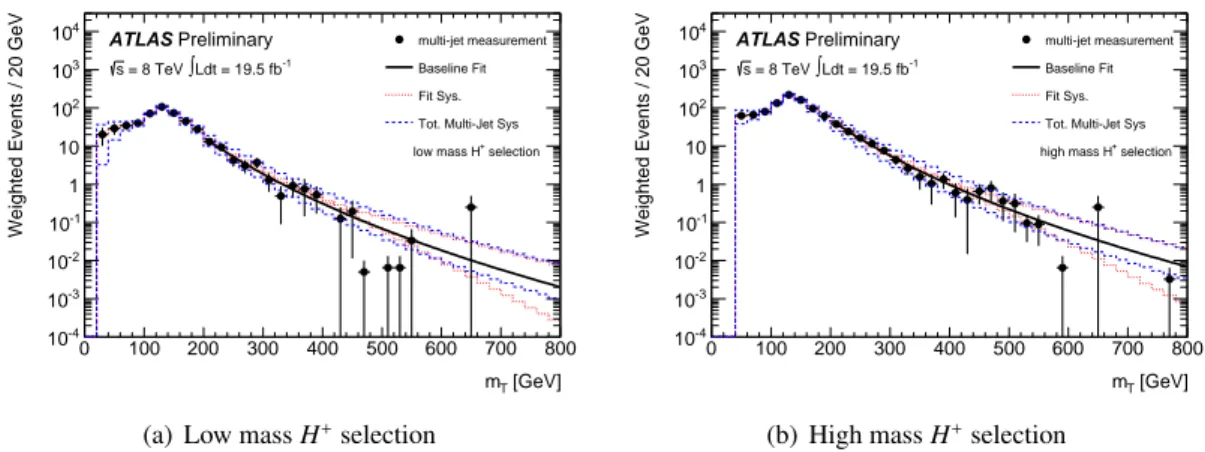
Tregion (> 300 GeV), but this region is poorly populated. This limitation is circumvented by fitting the m
Tdistribution using a power log function in the mass range 200–800 GeV. The power log function is defined by the following formula:
f (x)
=x
a+bln(x),(6)
where a and b are fitted constants. The resulting m
Tdistribution after considering each systematic
uncertainty is fit separately. An additional systematic uncertainty is added for the choice of fit function,
by symmetrising the difference between the baseline fit and an alternative fit using an exponential
function. The exponential is chosen to probe the effect on the expected yield in the poor statistics tail
region, since it also describes the multi-jet background well in the region with high statistics. Figure 3
shows the fits obtained in the nominal case, for the systematic uncertainty due to the chosen fit function, and for all other systematic uncertainties related to this background estimation (see section 5.2).
[GeV]
mT
0 100 200 300 400 500 600 700 800
Weighted Events / 20 GeV
10-4
10-3
10-2
10-1
1 10 102
103
104 multi-jet measurement
Baseline Fit Fit Sys.
Tot. Multi-Jet Sys Ldt = 19.5 fb-1
∫
= 8 TeV s
selection low mass H+
ATLAS Preliminary
(a) Low massH+selection
[GeV]
mT
0 100 200 300 400 500 600 700 800
Weighted Events / 20 GeV
10-4
10-3
10-2
10-1
1 10 102
103
104 multi-jet measurement
Baseline Fit Fit Sys.
Tot. Multi-Jet Sys Ldt = 19.5 fb-1
∫
= 8 TeV s
selection high mass H+
ATLAS Preliminary
(b) High massH+selection
Figure 3: The multi-jet backgrounds for the low mass (a) and high mass (b) H
+event selections, with the results of fits using the power log function, are shown in black. The red dotted lines show the systematic uncertainty from the choice of the fit function. The blue dashed lines show the total combined fits from all sources of systematic uncertainty listed in table 4.
4.4 Backgrounds with electrons or muons misidentified as τ
had-visBackgrounds that arise from events where an electron or muon is misidentified as
τhad-visare heavily suppressed by dedicated veto algorithms, so that these events only contribute at the level of 1–2%
to the total background. These backgrounds are estimated from simulated events, and they include contributions from t t, single top quark, ¯ W+jets and Z+jets processes.
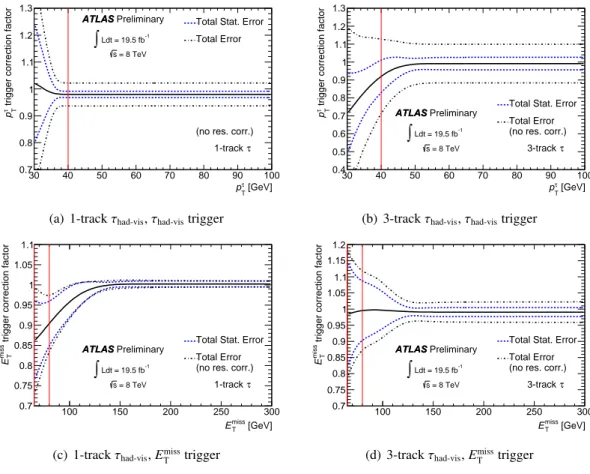
4.5 τ
had-vis+ E
missT
triggers
The analysis presented in this note relies on
τhad-vis+EmissTtriggers. In order to correct for any dif- ference between the trigger efficiencies observed in simulation and those observed in data, p
τT- and E
Tmiss-dependent correction factors are derived. The evaluation of these correction factors is limited by statistical uncertainties. In order to increase the sample size, the
τhad-visand E
Tmisstrigger efficiencies are determined separately and residual effects due to correlations are taken into account as systematic uncertainties. A tag-and-probe method is used in a control region enriched with t t ¯ events with a
µ+τhadselection to measure the efficiencies, using a muon trigger with a p
Tthreshold of 24 GeV or 36 GeV.
The trigger efficiencies are fitted separately for events with a
τhad-visthat has one or three charged
tracks. The p
τT(E
missT) trigger efficiencies are fitted in the range of 20–100 (20–500) GeV. The ratios of
the fitted functions for data and simulation are then applied to the simulated samples as continuous cor-
rection factors. Since no trigger information is available in the embedded sample, trigger efficiencies
are applied to that sample. The efficiencies for the
τhad-vistrigger derived as described above need to be
corrected for misidentified
τhad-vis. The fraction of events with a misidentified
τhad-visis substantial in
the
µ+τhadsample used for the tag-and-probe method, leading to a lower efficiency than in a sample
with only events that have a true
τhad-vis. Since only events with a true
τhad-visare present in the embed-
ded sample, the efficiencies determined from data are corrected to account for this lack of events with
a misidentified
τhad-vis.
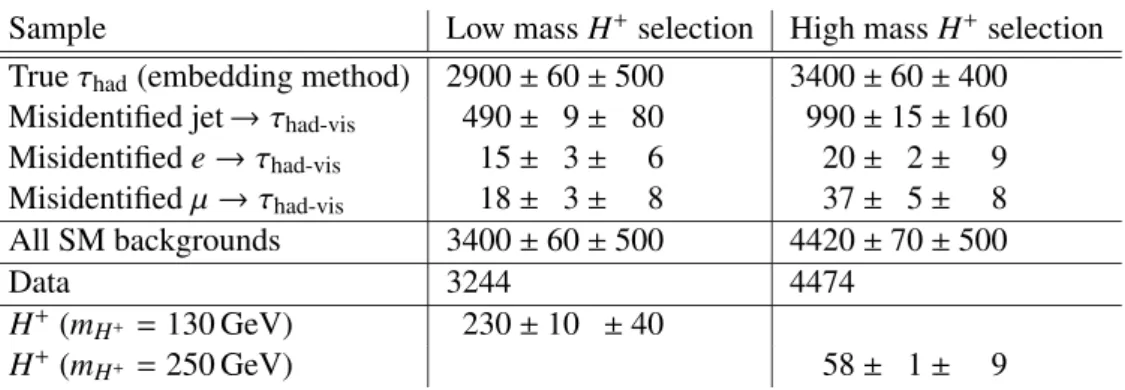
4.6 Event yields after the event selection
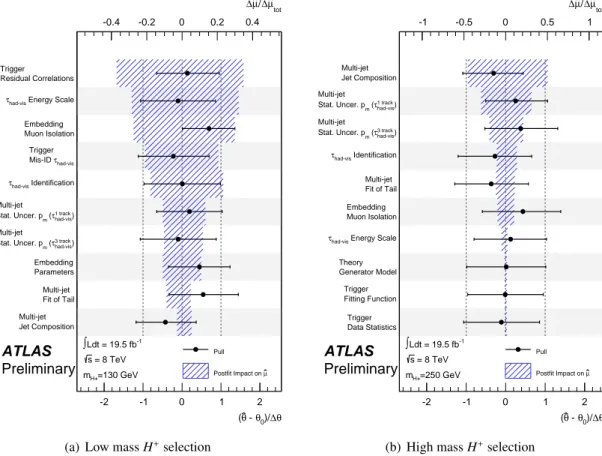
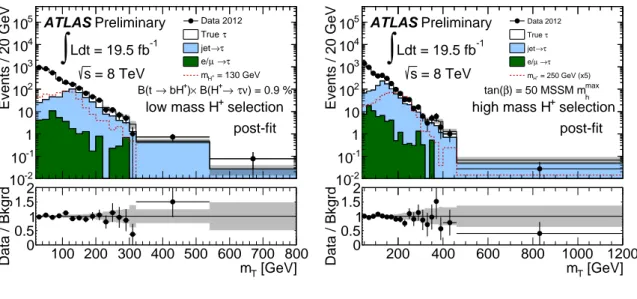
The expected numbers of background events and the results from data, together with an expectation from signal contributions in the low and high mass H
+selections, are shown in table 2. For the low mass H
+search, the signal contribution is shown for a cross section corresponding to
B(t
→bH
+)
×B(H
+→ τν)=0.9% and for the high mass H
+search a possible signal contribution in the m
maxhscenario of the MSSM with tan
β=50 is shown.
The number of events with a true
τhadis derived from the number of embedded events and does not depend on the theoretical cross section of the t t ¯
→b bW ¯
+W
−process. On the other hand, this analysis relies on the theoretical inclusive t t ¯ production cross section
σtt¯=253
+13−15pb [29] for the estimation of the small background with electrons or muons misidentified as
τhad-vis.
Sample Low mass H
+selection High mass H
+selection True
τhad(embedding method) 2900
±60
±500 3400
±60
±400 Misidentified jet
→τhad-vis490
±9
±80 990
±15
±160 Misidentified e
→τhad-vis15
±3
±6 20
±2
±9 Misidentified
µ→τhad-vis18
±3
±8 37
±5
±8 All SM backgrounds 3400
±60
±500 4420
±70
±500
Data 3244 4474
H
+(m
H+ =130 GeV) 230
±10
±40
H
+(m
H+ =250 GeV) 58
±1
±9
Table 2: Expected event yields after all selection criteria and comparison with 19.5 fb
−1of data. The values shown for the signal correspond to
B(t
→bH
+)
× B(H
+→τν)=0.9% for the low mass point and tan
β =50 in the MSSM m
maxhscenario for the high mass point. Both statistical and systematic uncertainties are shown, in this order.
5 Systematic uncertainties
5.1 τ
had-vis+ E
missT
triggers
Systematic uncertainties on the measurement of the
τhad-vis+ETmisstrigger efficiencies arise from mul-
tiple sources: the selection of the muon in the
µ+τhadsample, the number of misidentified
τhad-vis,
the choice of fitting function, slightly varying trigger requirements during the data-taking period, a
residual correlation between the
τhad-visand E
missTtriggers, and the effect of the
τhad-visenergy correc-
tion on the trigger efficiency. The dominant systematic, which arises from misidentified
τhad-visin the
t t ¯
→µτhad+X control region, is evaluated by measuring the trigger correction factors after varying the
expected misidentified
τhad-visyield by its uncertainty. These uncertainties are relevant for background
events with leptons misidentified as
τhad-visas well as true
τhadand signal events. The effects on a low
and high mass signal sample are summarised in table 3 and the effect on background events with true
τhadis shown in table 4. The trigger correction factors used to account for differences in the efficiencies
between simulation and data are shown in figure 4.
Source of uncertainty Low mass H
+selection High mass H
+selection
Muon selection
<1%
<1%
Misidentified
τhad-vis5.6% 5.7%
Fitting function 2.1% 1.8%
Trigger definition
<1%
<1%
Residual correlations 1.4% 3.2%
τhad-vis
energy scale
<1%
<1%
Table 3: Effect of systematic uncertainties on the combined trigger efficiencies for a low mass (m
H+ =130 GeV) and high mass (m
H+ =250 GeV) signal sample.
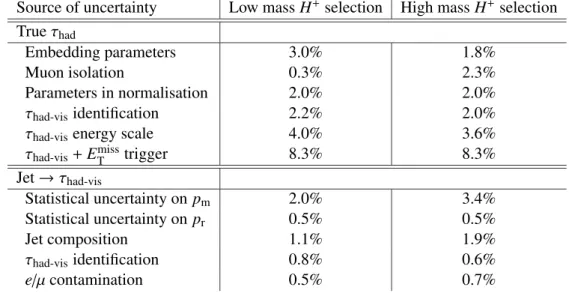
Source of uncertainty Low mass H
+selection High mass H
+selection True
τhadEmbedding parameters 3.0% 1.8%
Muon isolation 0.3% 2.3%
Parameters in normalisation 2.0% 2.0%
τhad-vis
identification 2.2% 2.0%
τhad-vis
energy scale 4.0% 3.6%
τhad-vis+
E
Tmisstrigger 8.3% 8.3%
Jet
→τhad-visStatistical uncertainty on p
m2.0% 3.4%
Statistical uncertainty on p
r0.5% 0.5%
Jet composition 1.1% 1.9%
τhad-vis
identification 0.8% 0.6%
e/µ contamination 0.5% 0.7%
Table 4: Dominant systematic uncertainties on the data-driven background estimates. The shift in event yield is given relative to the total background.
5.2 Data-driven background estimation
The systematic uncertainties arising from the data-driven methods used to estimate the various back- grounds are summarised in table 4.
The systematic uncertainties affecting the estimation of the backgrounds from true
τhad, discussed in section 4.2, consist of the potential bias introduced by the embedding method itself (evaluated by varying the amount of energy that is subtracted when removing calorimeter deposits of the muon in the original event), uncertainties from the trigger efficiency measurement as discussed in section 5.1, uncertainties associated to simulated
τhad(τ
had-visenergy scale and identification efficiency) and un- certainties on the normalisation. The latter are dominated by the statistical uncertainty of the selected control sample and the
τhad-vis+ETmisstrigger efficiency uncertainties.
For the estimation of backgrounds with jets misidentified as
τhad-vis, discussed in section 4.3, the
dominant systematic uncertainties on the misidentification probability are the statistical uncertainty due
to the control sample size and uncertainties due to the difference in the jet composition (gluon- or quark-
initiated) in the control and signal regions. The uncertainty arising from differences in jet composition
is evaluated from the difference in shape and normalisation that arises when p
mis measured in a control
[GeV]
τ
pT
30 40 50 60 70 80 90 100
trigger correction factorτ Tp
0.7 0.8 0.9 1 1.1 1.2 1.3
τ 1-track Total Stat. Error Total Error
(no res. corr.) ATLAS
ATLAS Preliminary Ldt = 19.5 fb-1
∫
= 8 TeV s
(a) 1-trackτhad-vis,τhad-vistrigger
[GeV]
τ
pT
30 40 50 60 70 80 90 100
trigger correction factorτ Tp
0.4 0.5 0.6 0.7 0.8 0.9 1 1.1 1.2 1.3
τ 3-track Total Stat. Error Total Error (no res. corr.) ATLAS
ATLAS Preliminary Ldt = 19.5 fb-1
∫
= 8 TeV s
(b) 3-trackτhad-vis,τhad-vistrigger
[GeV]
miss
ET
100 150 200 250 300
trigger correction factormiss TE
0.7 0.75 0.8 0.85 0.9 0.95 1 1.05 1.1
τ 1-track Total Stat. Error Total Error (no res. corr.) ATLAS
ATLAS Preliminary Ldt = 19.5 fb-1
∫
= 8 TeV s
(c) 1-trackτhad-vis,EmissT trigger
[GeV]
miss
ET
100 150 200 250 300
trigger correction factormiss TE
0.7 0.75 0.8 0.85 0.9 0.95 1 1.05 1.1 1.15 1.2
τ 3-track Total Stat. Error Total Error (no res. corr.) ATLAS
ATLAS Preliminary Ldt = 19.5 fb-1
∫
= 8 TeV s
(d) 3-trackτhad-vis,EmissT trigger