in the Development of Hepatocellular Carcinoma
I n a u g u r a l - D i s s e r t a t i o n
zur Erlangung des Doktorgrades
der Mathematisch-Naturwissenschaftlichen Fakultät der Universität zu Köln
vorgelegt von Sabine Gruber aus Kerpen
Köln 2013
Prof. Dr. Jens C. Brüning
PD. Dr. F. Thomas Wunderlich
Prof. Dr. Peter Kloppenburg
Tag der mündlichen Prüfung: 29.11.2013
Abbreviations xv
Abstract xvi
Zusammenfassung xvii
1 Introduction 1
1.1 Hepatocellular carcinoma . . . . 1
1.1.1 Linking inflammation to HCC . . . . 3
1.2 Linking obesity to HCC . . . . 4
1.2.1 Linking chronic low grade inflammation in obesity to HCC 6 1.3 Interleukin 6 signaling pathway . . . . 8
1.3.1 JAK/Stat-signaling . . . . 10
1.3.2 MAPK-signaling . . . . 11
1.4 Apoptosis . . . . 13
1.4.1 Extrinsic apoptotic pathway . . . . 14
1.4.2 Intrinsic apoptotic pathway . . . . 14
1.4.3 B-cell lymphoma (Bcl-2) family . . . . 16
1.4.4 Missregulation of apoptosis in cancer . . . . 17
1.5 Objectives . . . . 18
2 Materials and Methods 19 2.1 Materials . . . . 19
2.1.1 Chemicals . . . . 19
2.1.2 Buffer and solutions . . . . 22
2.1.3 Kits . . . . 24
2.1.4 Enzymes . . . . 25
2.1.5 Standards . . . . 25
2.2 Animal care . . . . 26
2.3 Metabolic measurements . . . . 26
2.3.1 Serum extraction . . . . 26
2.3.2 Measuring of blood glucose level . . . . 27
2.3.3 Glucose tolerance test . . . . 27
2.4 Treatments . . . . 27
2.4.1 Diethylnitrosamine (DEN)-injection . . . . 27
2.4.2 IL-6 signaling . . . . 27
2.4.3 NK T cell induction . . . . 27
2.4.4 Constitutiv active GSK-3 via Adeno-associated-virus (AAV) 28 2.4.5 PI-3K-inhibitor . . . . 28
2.4.6 Depletion of regulatory T cells . . . . 29
2.4.7 PP-1 inhibition by Ocadaic acid . . . . 29
2.5 Organ preparation . . . . 29
2.5.1 Organ extraction . . . . 29
2.5.2 Tumor quantification in the liver . . . . 29
2.5.3 Liver status . . . . 30
2.6 Bio molecular methods - nucleic acids . . . . 31
2.6.1 DNA-isolation from tail cuts . . . . 31
2.6.2 RNA-isolation with RNAeasy kit . . . . 31
2.6.3 Determination of nucleic acid concentration . . . . 31
2.6.4 Polymerase chain reaction (PCR) for genotyping of mice . . 32
2.6.5 Agarose gel electrophoresis . . . . 33
2.6.6 Reverse transcription (RT) . . . . 34
2.6.7 Quantitative real-time PCR (qRT-PCR) . . . . 35
2.6.8 Chromatin Immunoprecipitation . . . . 36
2.7 Bio molecular methods - proteins . . . . 37
2.7.1 Extraction of proteins from mouse organs . . . . 37
2.7.2 Mitochondrial isolation . . . . 38
2.7.3 Bax treatment of isolated mitochondria . . . . 38
2.7.4 SDS-polyacrylamid-gelelectrophorese (SDS-PAGE) . . . . . 38
2.7.5 Western blot analysis . . . . 38
2.7.6 Quantitation of western blots . . . . 40
2.8 Bio molecular methods - serum . . . . 40
2.8.1 Serum analysis . . . . 40
2.8.2 Insulin, Leptin, IL-6 and TNFα enzyme linked immuno sor- bent assay (ELISA) . . . . 41
2.8.3 AKT, Caspase-3, GSK-3β and PI3K activity assay . . . . 41
2.9 Immunohistochemical and immunofluorescence stainings . . . . . 41
2.9.1 HE staining . . . . 41
2.9.2 Mcl-1 staining . . . . 41
2.9.3 Oil Red O staining . . . . 41
2.9.4 TUNEL staining . . . . 42
2.9.5 Ki67 staining . . . . 42
2.10 Cell culture . . . . 42
2.10.1 Dual Luciferase Reporter Assay . . . . 42
2.10.2 Primary murine hepatocyte and human hepatoma culture . 43 3 Results 44 3.1 Obesity increases basal hepatic Stat-3 activation and impairs acute IL-6 responsiveness . . . . 44
3.2 Generation of IL-6Rα knock out mice . . . . 46
3.3 HFD causes obesity in control and IL-6Rα
∆/∆mice in the DEN- induced HCC model . . . . 48 3.4 IL-6Rα deficiency protects against DEN-induced liver carcinogene-
sis but obesity abrogates this effect and promotes HCC development 53
3.5 Obesity and IL-6 increase HCC development through the inhibi- tion of mitochondrial apoptosis . . . . 59 3.6 GSK-3β inhibition stabilizes Mcl-1 under obese conditions in HCC
development . . . . 66 3.7 Obesity and IL-6 controlled expression of PP-1α and Mule syner-
gize to stabilize Mcl-1 . . . . 74 3.8 Compensatory effects of IL-6 type cytokines and receptors . . . . . 83
3.8.1 HFD causes obesity in control, IL-6Rα
∆/∆and gp130
L−
KOmice . . . . 83 3.8.2 Inactivation of gp130 in hepatocytes protected against DEN-
induced HCC development even under obese conditions . . 84 3.8.3 No compensation for IL-6Rα deficiency by IL-6 type cy-
tokines in HCC development upon HFD feeding . . . . 88 3.9 The cell-type specific role of the IL-6Rα in the development of HCC 91
3.9.1 Less effects on body weight through HFD feeding in IL- 6Rα
L−
KO, IL-6Rα
M−
KOand IL-6Rα
T−
KOmice . . . . 92 3.9.2 IL-6Rα
T−
KOmice are protected against DEN-induced HCC
even on HFD . . . . 94
4 Discussion 102
4.1 IL-6Rα deficiency protects against DEN-induced liver carcinogen- esis, but obesity abrogates this effect . . . 103 4.2 Similar extent of obesity in control and IL-6Rα
∆/∆mice in the DEN-
induced HCC model . . . 105 4.3 Obesity and IL-6 increase HCC development through the inhibi-
tion of mitochondrial apoptosis . . . 107 4.4 GSK-3β inhibition stabilizes Mcl-1 via IL-6 signaling and under
obese conditions in HCC development . . . 109 4.5 Obesity and IL-6 controlled expression of PP-1α and Mule syner-
gize to stabilize Mcl-1 . . . 111
4.6 Obesity promotes liver carcinogenesis via Mcl-1 stabilization inde- pendent of IL-6Rα signaling . . . 114 4.7 Inactivation of gp130 in hepatocytes protects against DEN-induced
HCC development even under obese conditions . . . 116 4.8 IL-6Rα
T−
KOmice are protected against DEN-induced HCC even
on HFD . . . 117 4.9 Conclusion . . . 119
5 Bibliography 120
6 Acknowledgments 137
7 Erklärung 138
8 Curriculum vitae 139
1.1 Cancer distribution and HCC incidence rates worldwide in 2011 . . 2
1.2 Mortality from Cancer According to Body-Mass Index for U.S. Men in the Cancer Prevention Study . . . . 4
1.3 Prevalence of obesity in adults from 2001 and 2010 . . . . 5
1.4 TNFα signaling pathway . . . . 9
1.5 IL-6 signaling pathway . . . . 11
1.6 Apoptotic pathway . . . . 15
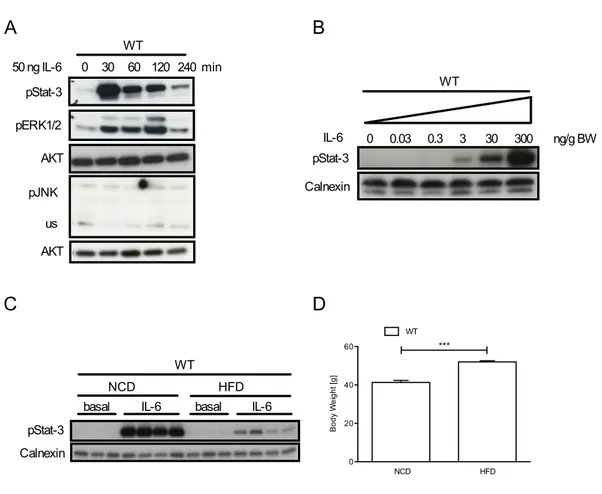
3.1 IL-6 responisveness in control mice on NCD and HFD . . . . 45
3.2 Inactivation of IL-6 signaling in IL-6Rα
∆/∆. . . . 47
3.3 Metabolic parameters of control and IL-6Rα
∆/∆mice . . . . 49
3.4 Inflammatory signaling in control and IL-6Rα
∆/∆mice . . . . 50
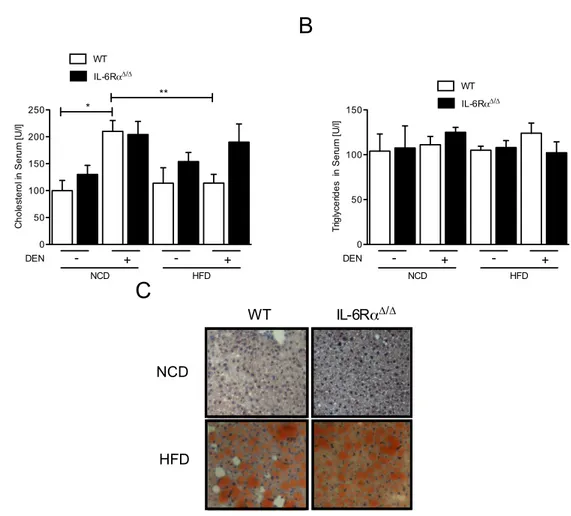
3.5 Extent of lipid burden in control and IL-6Rα
∆/∆mice . . . . 52
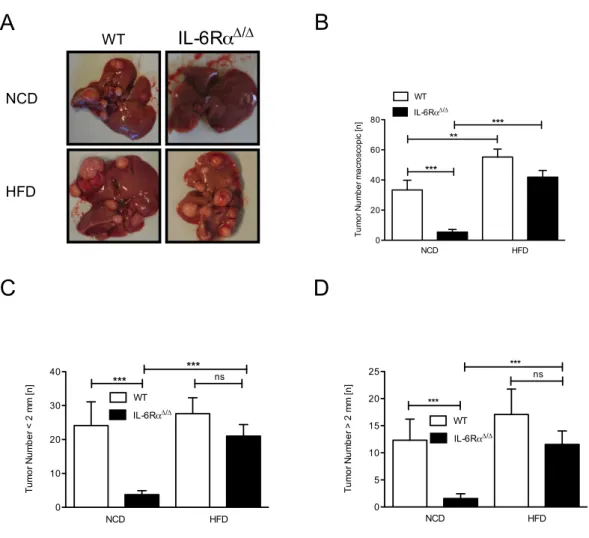
3.6 Turmor burden macroscopic in control and IL-6Rα
∆/∆mice . . . . . 54
3.7 Liver damage of control and IL-6Rα
∆/∆mice . . . . 55
3.8 Turmor burden microscopic in control and IL-6Rα
∆/∆mice . . . . . 56
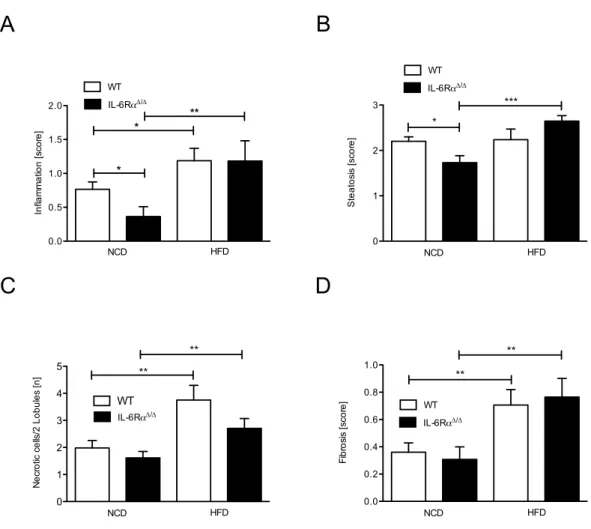
3.9 Liver status of control and IL-6Rα
∆/∆mice . . . . 58
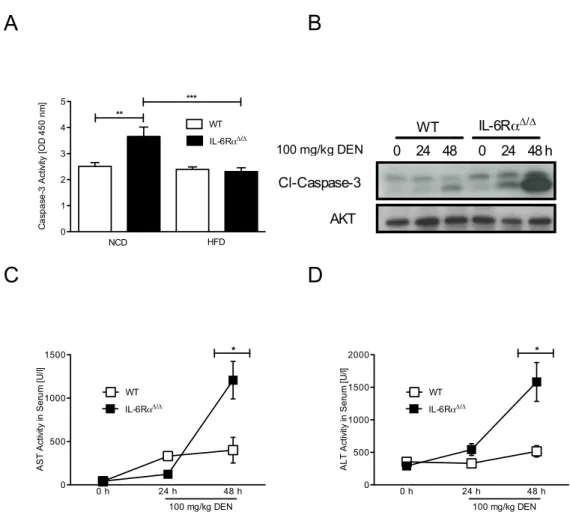
3.10 Caspase 3 activity in the liver of control and IL-6Rα
∆/∆mice . . . . 60
3.11 Cytochrome C release from mitochondria of control and IL-6Rα
∆/∆mice . . . . 61
3.12 Pro- and anti-apoptotic proteins in tumor livers of control and IL- 6Rα
∆/∆mice . . . . 63
3.13 Mcl-1 level in tumor livers of control and IL-6Rα
∆/∆mice . . . . 65
3.14 GSK-3β activity in tumor livers of control and IL-6Rα
∆/∆mice . . . 67
3.15 Puma and Noxa in livers of control and IL-6Rα
∆/∆mice . . . . 68
3.16 GSK-3β activity in initital phase of tumor development of control and IL-6Rα
∆/∆mice . . . . 70
3.17 PI3K inhibition in tumor bearing control and IL-6Rα
∆/∆mice . . . 72
3.18 PI3K pathway in tumor bearing control and IL-6Rα
∆/∆mice . . . . 73
3.19 PP-1α expression and Stat-3 activation in control and IL-6Rα
∆/∆mice 75 3.20 PP-1 promoter analysis in control and IL-6Rα
∆/∆mice . . . . 77
3.21 Mule expression in control and IL-6Rα
∆/∆mice . . . . 78
3.22 ChIP experiments with Mule promoter . . . . 79
3.23 Mule promoter analysis in control and IL-6Rα
∆/∆mice . . . . 81
3.24 Correlation between Mule and Mcl-1 level in human HCC . . . . . 82
3.25 Body weight of control, IL-6Rα
∆/∆and gp130
L−
KOmice . . . . 84
3.26 Turmor burden macroscopic in control, IL-6Rα
∆/∆and gp130
L−
KOmice . . . . 85
3.27 Turmor burden microscopic in control, IL-6Rα
∆/∆and gp130
L−
KOmice . . . . 86
3.28 Liver status of control, IL-6Rα
∆/∆and gp130
L−
KOmice . . . . 87
3.29 IL-6 type cytokines and receptors in tumor livers of control and IL-6Rα
∆/∆mice . . . . 90
3.30 Metabolic status of control, IL-6Rα
∆/∆, IL-6Rα
L−
KO, IL-6Rα
M−
KOand IL-6Rα
T−
KOmice . . . . 93
3.31 Turmor burden macroscopic in control, IL-6Rα
∆/∆, IL-6Rα
L−
KO, IL-6Rα
M−
KOand IL-6Rα
T−
KOmice . . . . 95
3.32 Liver damage of control, IL-6Rα
∆/∆, IL-6Rα
L−
KO, IL-6Rα
M−
KOand IL-6Rα
T−
KOmice . . . . 96
3.33 Turmor burden microscopic in control, IL-6Rα
∆/∆, IL-6Rα
L−
KO, IL- 6Rα
M−
KOand IL-6Rα
T−
KOmice . . . . 97
3.34 Liver status of control, IL-6Rα
∆/∆, IL-6Rα
L−
KO, IL-6Rα
M−
KOand
IL-6Rα
T−
KOmice . . . . 99
3.35 Turmor burden macroscopic in control, IL-6Rα
∆/∆and IL-6Rα
T−
KOmice . . . 101
4.1 Model of apoptosis-regulation in HCC via IL-6 signaling and obesity115
0.1 Abbreviations . . . . x
2.1 Chemicals . . . . 19
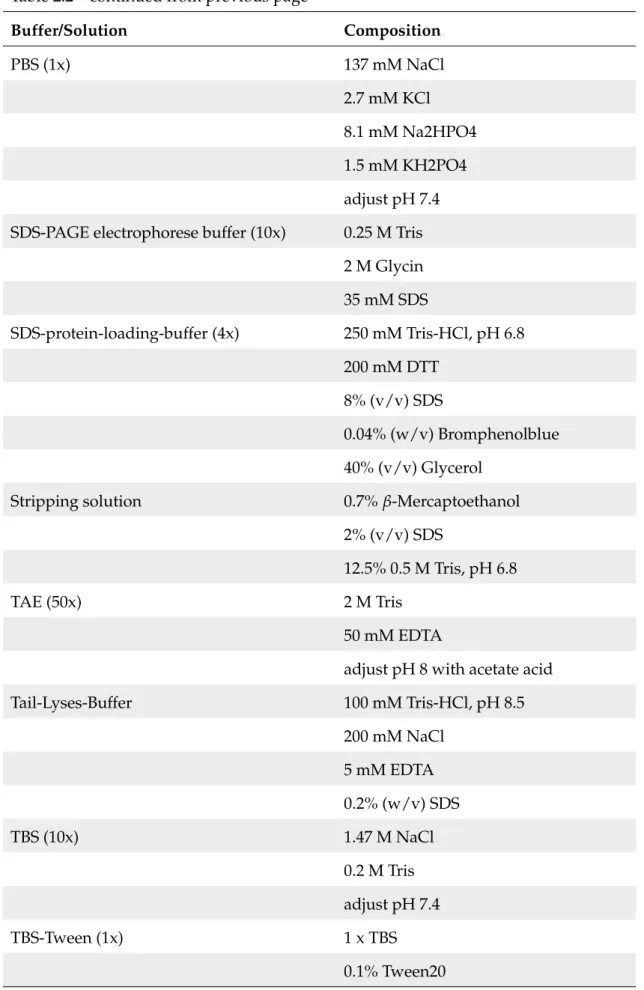
2.2 Buffer and solutions . . . . 22
2.3 Kits . . . . 24
2.4 Enzymes . . . . 25
2.5 Standards . . . . 25
2.6 Primer . . . . 32
2.7 PCR mix . . . . 32
2.8 PCR programms . . . . 33
2.9 RT programm . . . . 34
2.10 RT mix . . . . 34
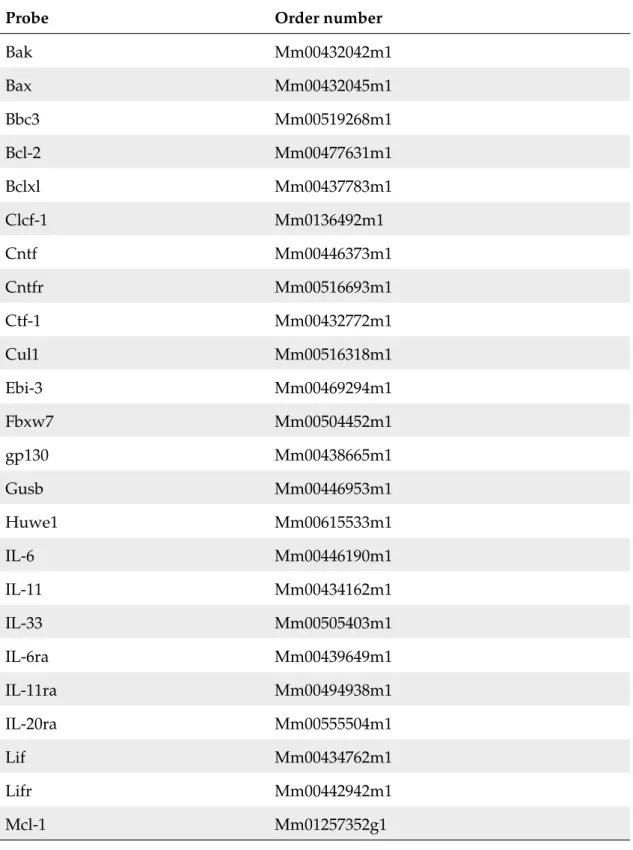
2.11 Oligonucleotides for qRT-PCR (applied Biosystems, Darmstadt, Ger- many) . . . . 35
2.12 Realtime mix . . . . 36
2.13 Antibodies . . . . 39
Table 0.1: Abbreviations Abbreviations
◦
C degree celsius
3 three prime end of DNA sequence
5´ five prime end of DNA sequence αGalCer αGalactosylceramide
µg microgram
AAV adeno-associated virus AIF apoptosis inducing factor
AKT protein kinase B
Alfp albumin promoter/α-fetoprotein enhancer
ALT alanin transaminase
AP-1 activated protein 1
Apaf-1 apoptotic protease activating factor 1
APS Ammonium persulfate
ASK apoptosis signal-regulating kinase AST aspartate transaminase
Bak Bcl-2 homologues antagonist/killer Bax Bcl-2-associated X protein
Bcl-2 B-cell lymphoma 2
Bcl-XL B-cell lymphoma extra large
Bid BH3 interacting-domain death agonist
BL6 black 6
BMI body mass index
Continued on next page
Table 0.1 – continued from previous page Abbreviations
BW body weight
CD cluster of differentiation
cDNA complementary DNA
ChIP chromatin immunoprecipitation
c-Jun Jun proto-oncogene
CNTF ciliary neurotrophic factor
CNTFR ciliary neurotrophic factor receptor
CO
2carbon dioxide
Cre site-specific recombinase from phage P1 (cause recombination) CTCF-1 cardiotrophin-like cytokine factor 1
Cul-1 Cullin 1
DAPI 4,6-diamidino-2-phenylindole
DEN Diethylnitrosamine
DNA Desoxyribonucleic acid
DR Death receptor
EBI-3 Epstein-Barr virus induced gene 3
ECL Enhanced chemiluminescence
EDTA Ethylendiamine tetraacetate
ELISA Enzyme Linked Immunosorbent Assay ERK extracellular signal-related kinase Facs Fluorescence-activated cell sorting FBW7 F-box WD repeat-containing protein 7 FLD fatty liver disease
Fos FBJ osteosarcoma oncogene
g gram
GFP green fluorescent protein
GusB Glucuronidase beta
gp130 glycoprotein 130
Continued on next page
Table 0.1 – continued from previous page Abbreviations
gp130
f l/f lfloxed gp130 gene
gp130
L−KOhepatocyte specific deletion of gp130 GSK-3β glycogen synthase kinase 3 β
GSK-3βCA constitutive active GSK-3β
h hour
H
2O water
HBV hepatitis B virus
HCC hepatocellular carcinoma
HCl hydrochloric acid
HCV hepatistis C virus
HEPES N-2-hydroxyethylpiperazine-N’-2-ethansulfonic acid
HFD high fat diet
IGF insulin like growth factor
IgG immunglobuline G
IκBα inhibitor of NF-κB
IKK inhibibitor of NF-κB kinase
IL-6 Interleukin 6
IL-6Rα Interleukin 6 receptor α
IL-6Rα
∆/∆deletion of IL-6Rα gene in the whole body IL-6Rα
f l/f lfloxed IL-6Rα gene
IL-6Rα
L−KOhepatocyte specific deletion of IL-6Rα IL-6Rα
M−KOmyeloid specific deletion of IL-6Rα IL-6Rα
T−KOT cell specific deletion of IL-6Rα IMM inner mitochondrial membrane
i.p. intraperitoneal
i.v. intravenously
JAK janus activated kinase JNK c-Jun N terminale kinase
Continued on next page
Table 0.1 – continued from previous page Abbreviations
KC Kupffer cell
kg kilogram
LIFR leukemia inhibitory factor receptor loxP recognition sequence for Cre
LPS Lipopolysaccharide
MAPK mitogen activated protein kinase Mcl-1 myeloid leukemia cell 1
MEK MAP kinse-ERK kinase
mg milligram
MKK McKusick-Kaufman syndrome kinase
ml milliliter
MLK mixed-lineage protein kinase
mM millimolar
mo months
mRNA messenger RNA
Mule Mcl-1 ubiquitin ligase E3
NaCl sodium chloride
NaF natrium fluoride
NCD normal chow diet
NEMO NF-κB essential modulator of IKK
NF-κB nuclear factor ’kappa light chain enhancer’ of activated B cells
ng nanogram
NKT cells natural killer-like T cells
nm nanometer
N-terminal amino-terminal
OA okadaic acid
OD optical density
OMM outer mitochondrial membrane
Continued on next page
Table 0.1 – continued from previous page Abbreviations
OSMR oncostatin M receptor
p phosphorylated
P21 postnatal day 21
p38 mitogen-activated protein kinase PAGE polyacrylamid-gelelectrophorese PBS phosphate buffered saline
PCR polymerase chain reaction
PDK-1 Phosphoinositide-dependent protein kinase 1 PI3K phosphoinositid 3 kinase
PIP3 Phosphatidylinositol (3,4,5)-triphosphate
PKB Protein kinase B
PolII polymerase 2
PP-1 protein phosphatase 1 α
rpm rounds per minutes
pTEN phosphatase and tensin homolog
Puma p53 upregulated modulator of apoptosis PVDF polyinylidene fluoride
qPCR quantitative real time PCR
RAF rapidly accelerated fibrosarcoma kinase
Ras rat sarcoma protein
RNA ribonucleic acid
RNase Ribonuclease
RT room temperature
S9 serine 9 residue
SAPK stress-activated protein kinase
SCF-FBW SKP1-cullin-F-box WD repeat-containing complex
SDS Sodiumdodecylsulfate
SEM standard error of the mean
Continued on next page
Table 0.1 – continued from previous page Abbreviations
sgp139 soluble gp130
SH2 src-homology
sIL-6Rα soluble Interleukin 6 receptor α Socs-3 suppressor of cytokine signaling 3
Stat-3 signal transducer and activator of transcription 3
TAK TGF activated kinase
TBS Tris buffered saline
TEMED Tetramethylethylenediamine TNFα tumor necrosis factor α T
regsregulatory T cells
Tris 2-amino-2-(hydroxymethyl-1)1,3-propandiol
TUNEL Terminal deoxynucleotidyl transferase dUTP nick end labeling
UV ultraviolet
V Volt
v/v volume per volume
W watt
WAT white adipose tissue
WHO World health organisation
w/v weight per volume
wk weeks
WT wild type
Obesity is a constantly increasing health burden affecting more than 30% of the population of westernized countries. In addition to classical associated disorders, obesity was also previously reported to increase the incidence of hepatocellular carcinoma (HCC) development, in part through activation of obesity-associated pro-inflammatory signaling and the release of inflammatory cytokines such as TNFα and IL-6, both known as tumor-promoting cytokines. Nevertheless, how these inflammatory cytokines trigger HCC development is currently not fully un- derstood.
The current work reports that abrogation of IL-6Rα signaling in lean mice pro- tects against DEN-induced HCC development. This HCC protection occurs via destabilization of anti-apoptotic Bcl-2 family member Mcl-1, thus promoting hep- atocyte apoptosis. In lean mice IL-6 regulates the stability of Mcl-1 via inhibi- tion of PP-1α expression which promotes GSK-3β inactivation by serine 9 residue phosphorylation. In addition, IL-6 suppresses expression of the Mcl-1 E3 ligase Mule. Consequently, IL-6Rα deficiency activates PP1-α and Mule expression re- sulting in increased Mcl-1 turnover and protection against HCC development. In contrast, in obese mice inhibition of PP1-α and Mule expression leading to Mcl-1 stabilization occurs independent from IL-6 signaling.
Furthermore, the current work could demonstrate that IL-6Rα signaling in T cells is essential for the development of HCC indicated by the protective effect of IL-6Rα deficiency on T cells.
Collectively, this study provides evidence that IL-6 and obesity inhibit hepato-
cyte apoptosis through Mcl-1 stabilization thus promoting liver carcinogenesis.
Adipositas ist ein konstant wachsendes Gesundheitsproblem, welches schon heute mehr als 30% der westlichen Bevölkerung betrifft. Zusätzlich zu den klassisch- assoziierten Krankheiten, erhöht Adipositas auch die Gefahr der hepatozellulärer Karzinomentwicklung (HCC). Dies geschieht teilweise durch Aktivierung von Adipositas-assoziierten Signalwegen, welche zur Freisetzung von tumorfördern- den, inflammatorischen Zytokinen wie TNFα und IL-6 führen. Unbekannt ist jedoch wie diese Zytokine die Entwicklung von HCC auslösen. Die vorliegende Arbeit zeigt, dass die Inaktivierung des IL6Rα normalgewichtige Mäusen vor der DEN induzierte HCC Entwicklung schützt. Durch die Destabilisierung von Mcl- 1, einem Mitglied der Anti-apoptotischen Bcl-2 Familie, wird die Apoptose in Hepatozyten gefördert. Dies schützt die Leber vor der Entwicklung von HCC.
In normalgewichtigen Mäusen reguliert IL-6 die Stabilität von Mcl-1 durch Hem-
mung der PP-1α Expression, welches wiederum die Inaktivierung von GSK-3β
fördert. Zusätzlich unterdrückt IL-6 die Expression der Mcl-1 ubiquitin ligase E3
Mule. In IL-6Rα defizienten Mäusen wird die Expression von PP-1α und Mule
aktiviert, dies führt zu einem erhöhten Umsatz von Mcl-1 und zum Ausbleiben
von HCC. Im Gegensatz dazu führt bei Adipositas die Hemmung der PP-1α und
Mule Expression zu einer Stabilisierung von Mcl-1, unabhängig von der IL-6 Sig-
nalübertragung. Desweiteren kann mit der vorliegenden Arbeit gezeigt werden,
dass die IL-6Rα-signalübertragung in T Zellen essentiell für die Entwicklung von
HCC ist. Hinweise dafür liefert der schützende Effekt der IL-6Rα-defizienz auf
T Zellen. Insgesamt liefert diese Studie Beweise dafür, dass IL-6 und Adiposi-
tas die Apoptose in Hepatozyten durch Mcl-1 Stabilisierung hemmen und so die
Leberkarzinogenese fördern.
1.1 Hepatocellular carcinoma
Cancer is a general term for a large group of diseases that can occur in almost every part of the body. Cancer development is characterized by uncontrolled cell growth that leads to tumor formation and invasion of these cells to neighboring tissues [Croce, 2008]. Cancer is a disease which is more frequent in older ages.
Due to an increase in the old population, the World Health Organisation (WHO) assumes an increase in the cancer-related mortality rate from 7.9 million (2007) to 11.5 million (2030) cases per year. In most industrialized countries, cancer is the second most frequent cause of death after cardiovascular diseases [Alwan, 2011].
Hepatocellular carcinoma (HCC) is the third most common cancer worldwide
(Fig. 1.1A) and represents, with 85-90% of all primary liver cancers, the most
common one [El-Serag & Rudolph, 2007]. The average mortality is 95% within 5
years due to limited treatment strategies and the late exhibition of clinical symp-
toms [Sherman, 2005; Villanueva et al., 2010]. Therefore, HCC represents the third
largest cause of cancer deaths worldwide, especially for men in low- and middle-
income countries, such as Africa and Eastern Asia (Fig. 1.1B). Male individuals
have a 4-fold increase in HCC incidence compared to women. These results could
be confirmed by Maria et al. [2002] in mouse models. Accordingly, females have
a lower incidence for HCC due to an estrogen-dependent mechanism [Naugler
et al., 2007]. However, the increasing incidence of HCC in industrialized countries
cannot be neglected [El-Serag et al., 2003].
A B
Lung Stomach
Liver Colorectum
Breast Oesophagus
Prostate Cervix uteri
Bladder Others 0
10 20 30 40
Cancer incidence [%]
Figure 1.1: Cancer distribution and HCC incidence rates worldwide in 2011
(A) Worldwide distribution of different cancer forms of both genders in per- centage of total cancer numbers from 2011. (WHO globocan project) (B) Dis- tribution of HCC incidence in 2011 (ASR per 100000). (WHO globocan project)
Cancer development and progression is influenced by genetic, epigenetic and environmental factors. HCC is linked to a variety of genetic predispositions, such as mutations in tumor suppressor genes, as well as to viral infections such as hepatitis B (HBC) or C (HCV), alcoholic liver disease, hemochromatosis and non- alcoholic steatohepatitis [Villanueva et al., 2007; Fattovich et al., 2004; Yoshioka et al., 2004; Thorgeirsson & Grisham, 2002; Donato et al., 2002; Yu et al., 2001].
All of which cause liver damage and chronic inflammation and therefore pro- mote HCC, which is characterized as a classic case of inflammation-linked can- cer [Sanz-Cameno et al., 2010; Mantovani et al., 2008; Karin et al., 2006; Karin &
Greten, 2005; Balkwill & Mantovani, 2001].
1.1.1 Linking inflammation to HCC
Human studies could demonstrate that chronic inflammation in alcoholic hep- atitis, HBV and HCV infections and steatohepatitis may lead to development of HCC [Abiru et al., 2006; Sherman, 2005]. Even in mouse studies a strong correla- tion could be exhibit between the amount of liver damage during acute toxicity and inflammation and the extent of HCC development [Naugler et al., 2007; Saku- rai et al., 2006; Maeda et al., 2005]. Furthermore, Maeda and others could demon- strate that chemically or genetically induced HCC depends on inflammatory sig- naling [Sakurai et al., 2006; Maeda et al., 2005; Pikarsky et al., 2004]. Liver injury and chronic inflammation that results in compensatory proliferation of differen- tiated hepatocytes, which are otherwise quiescent, is one of the major pathogenic mechanisms underlying HCC development [Sakurai et al., 2006; Fausto, 1999;
Maeda et al., 2005]. The relevance of compensatory proliferation as a tumori- genic mechanism is supported by mouse genetic studies, using either the hepatic pro-carcinogen Diethylnitrosamine (DEN) as an inducer of HCC [Hui et al., 2008;
Sakurai et al., 2006; Maeda et al., 2005] or the conditional or complete inactiva- tion of nuclear factor ’kappa light chain enhancer’ of activated B cells (NF-κB) signaling, needed for maintenance of hepatocyte survival [Luedde et al., 2007].
The resulting necrosis of hepatocytes in these studies enhances mutagenesis in host cells, accumulation of double strand breaks and results in HCC [Karin, 2008;
Sakurai et al., 2006; Maeda et al., 2005]. Furthermore, during chronic inflammation
the infiltrating immune cells create a tumor microenvironment releasing elevated
levels of pro-inflammatory cytokines such as tumor necrosis factor alpha (TNFα)
and Interleukin 6 (IL-6) [Newell et al., 2008; Xu et al., 2003]. Liver injury and com-
pensatory proliferation are strongly depending on IL-6 and the absence of this
cytokine results in almost complete inhibition of DEN-induced HCC [Naugler
et al., 2007]. Furthermore, IL-6 deficient mice demonstrate reduced liver injury,
apoptosis, necrosis and proliferation in hepatocytes after DEN-injection, charac-
terizing inflammation as the major contributing factor in HCC development.
1.2 Linking obesity to HCC
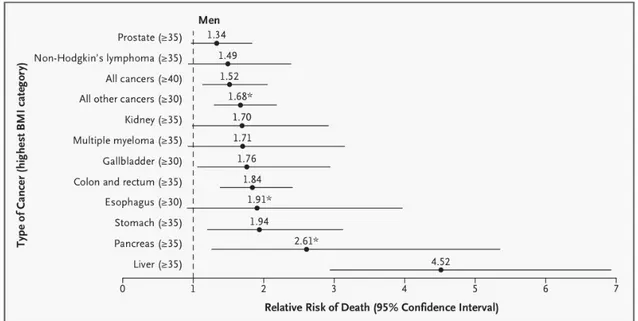
Previous epidemiological studies identified obesity as a major risk factor for sev- eral cancer entities and demonstrated a 1.52 - 1.62-fold increase in relative risk of cancer related death [Calle et al., 2003; Calle & Kaaks, 2004; Bianchini et al., 2002]. The amount of increase in risk depends on the type of cancer, whereas HCC exhibited the strongest obesity-associated increase in tumor incidence with a 4.52-fold increase, particularly in men with a body mass index over 35 (Fig. 1.2) [Calle et al., 2003]. Thus, the obesity-associated increase in HCC development gains substantial clinical relevance in the light of the current epidemical increase in obesity in westernized societies [Ford & Mokdad, 2008].
Figure 1.2: Mortality from Cancer According to Body-Mass Index for U.S. Men in the Cancer Prevention Study
For each relative risk, comparison between men in highest BMI category (in- dicated in parentheses) and men in reference category (BMI, 18.5 to 24.9). As- terisks indicate relative risks for men who never smoked. Results were signif- icant (p ≤ 0.05) for all cancer sites. [Calle et al., 2003]
Obesity is a constantly increasing health burden affecting more than 30% of
the population of westernized countries. Obesity is defined as a condition of ab-
normal or excessive body fat accumulation that is a consequence of a sustained
positive energy balance. That means consuming more calories than spending,
resulting in excessive storage of lipids in the adipose tissue. A more sedentary lifestyle in western societies with reduced physical work and the increased avail- ability of food due to the industrialization contributes further to a positive energy balance.
In 2008, approximately 1.5 billion adults were overweight, of which over 200 million men and approximately 300 million women were obese. Following record- ings of each country in the WHO European Region from 2008, over 50% of both men and women have a body mass index (BMI = weight in kilograms / size in meters
2) higher than 25 and thus considered to be overweight. Nearly 23% of these were obese indicated by a BMI above 30 (Fig. 1.3 [Berghofer, 2008].
A B
2001 2010
Figure 1.3: Prevalence of obesity in adults from 2001 and 2010
The worldwide prevalence of obese adults (BMI >30) compared from 2001 and 2010. Datas were obtained from the WHO.
The association between fat accumulation and HCC was known for a long time [El-Serag & Rudolph, 2007; Caldwell et al., 2004]. Fatty liver disease (FLD) turned out to be one of the major risk factors for HCC which rapidly increased over the last years in western countries. Obesity and FLD lead to steatosis and cirrhosis and thereby increase the incidence of HCC [Yoshioka et al., 2004; Calle et al., 2003].
While the current study was being completed, Park et al. [2010] could demon-
strate that genetically and dietary-induced obesity enhances development of chem-
ically induced HCC. Moreover, earlier studies described that consumption of
high fat diet (HFD) resulted in increased formation of pre-neoplastic lesions in
response to DEN administration in rats [Wang et al., 2009]. However, these rats
were not evaluated for HCC and the mechanism underlying increased formation of the lesions was not determined.
Another recent study used mice with hepatocyte-specific deficiency of the reg- ulatory subunit NF-κB essential modulator (NEMO) of the inhibitor of kappa B kinase (IKK) complex or the IKKs itself (Nemo/IKKγ
∆hep), which spontaneously develop liver damage, hepatosteatosis and HCC on a normal chow diet (NCD) [Luedde et al., 2007]. These mice revealed enhanced development of hepatosteato- sis and liver damage after HFD-feeding, which ultimately results in accelerated tumor development in the liver [Wunderlich et al., 2008]. However, the pre- existing hepatosteatosis and spontaneous liver damage in Nemo/IKKγ
∆hepmice upon NCD feeding prevented the conclusive demonstration that obesity per se rather than chronic liver damage, caused by the absence of NF-κB, is responsible for tumor promotion. Furthermore, the mechanism by which obesity accelerates HCC development in these mice was not determined.
1.2.1 Linking chronic low grade inflammation in obesity to HCC
The excessive weight gain during obesity is associated with a chronic low grade inflammatory state. The concept of chronic low grade inflammation in response to obesity was first demonstrated by elevated expression of TNFα in the white adipose tissue (WAT) [Hotamisligil et al., 1993]. Follow-up studies confirmed the observation in humans, where WAT also expresses increased TNFα upon obesity, which was decreased after weight loss [Gonzalez et al., 1999; Dandona et al., 1998;
Hotamisligil et al., 1995; Kern et al., 1995]. Additional work demonstrated that
the chronic low grade inflammation in obesity is not only locally in WAT, but also
systemically, indicated by elevated plasma concentrations of circulating TNFα
and IL-6 [Nishimura et al., 2009; Xu et al., 2003; Bastard et al., 2000; Mohamed-Ali
et al., 1997; Hotamisligil et al., 1993]. During the development of obesity, immune
cells, such as macrophages and T cells, infiltrate tissues, such as WAT or liver,
and lead to increased secretion of TNFα and IL-6 [Nishimura et al., 2009; Xu et al.,
2003]. The tumor promoting effect of HFD depends to a large extent on this el- evated levels of TNFα and IL-6, both of which are tumor-promoting cytokines [Park et al., 2010; Lin & Karin, 2007].
Liver injury and compensatory proliferation are strongly depending on IL-6 and the absence of this cytokine results in almost complete inhibition of DEN- induced HCC [Naugler et al., 2007]. Additionally, it could be demonstrated that obesity increases IL-6 level compared to lean mice and thereby accelerates tumor development [Park et al., 2010]. IL-6 may not be the only mediator responsible for obesity-induced cancer promotion, however, it is well established that its produc- tion is elevated in obese mice due to the low-grade inflammatory response caused by lipid accumulation [Arkan et al., 2005; Shoelson et al., 2007; Solinas et al., 2007;
Hotamisligil, 2006].
1.3 Interleukin 6 signaling pathway
IL-6 is a pleiotropic cytokine largely responsible for the hepatic response to in- fections or systemic inflammation, often termed the "acute phase response". IL- 6 regulates activation of phagocytosis and acute phase proteins such as the c- reactive protein or serum amyloid A in the inflammation process [Barton, 1996].
Moreover, IL-6 plays a key role in the transition from innate to adaptive immu- nity by initiating differentiation of T- and B-lymphocytes [Brooks et al., 1985].
The IL-6 gene consists of 5 exons whose expression results in an inactive pre- peptide of 212 amino acids which is then cleaved into the active form of 184 amino acids. IL-6 has several splice forms and is posttranslationally modified by gly- colisation and phosphorylation [Parekh et al., 1992]. The membrane bound IL-6 receptor (IL-6R) is expressed on hepatocytes, macrophages, T lymphocytes and endothelial cells [Barton, 1996]. The heterotrimeric receptor consists of two signal transduction β-chains glycoprotein 130 (gp130) and one IL-6R α-chains. Gp130 is widely used by a cohort of cytokines receptors, especially by the IL-6 type cy- tokine receptor family including Interleukin 11 receptor (IL-11R), oncostatin M receptor (OSMR), ciliary neurotrophic factor receptor (CNTFR), Interleukin 27 receptor (IL-27R), Epstein-Barr virus induced gene 3 (EBI-3) and leukemia in- hibitory factor receptor (LIFR) [Zhang et al., 1994]. In contrast the IL-6Rα chain is specific for IL-6 signaling in hepatocytes, macrophages, endothelial cells and T-lymphocytes [Hibi et al., 1996].
Besides the classical membrane bound IL-6 receptor signaling an alternative
pathway exists using a soluble form of the IL-6 receptor (sIL-6Rα). The sIL-6Rα is
either created by shedding of the extracellular part of the membrane bound IL-6
receptor which is triggered by the c-reactive protein or is produced by alternative
splicing of the messenger RNA (mRNA) [Jones et al., 1999]. A complex of IL-6
and the sIL-6Rα can bind to the gp130 signaling chain at virtually all cell types,
thereby rendering also cells responsible to IL-6 which do not express the IL-6Rα
chain [Graeve et al., 1996]. This kind of IL-6 signaling was described as “transsig-
naling” which can be inhibited by soluble gp130 (sgp130) [Chalaris et al., 2007].
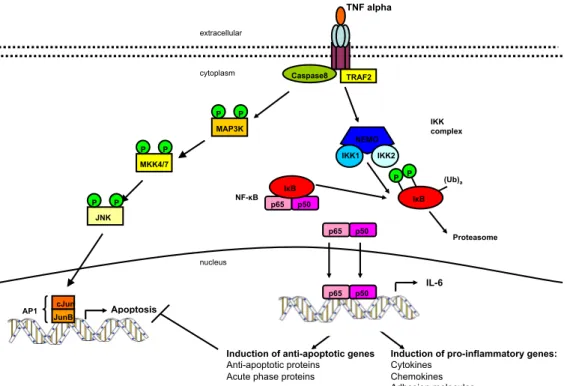
IL-6 expression is regulated by TNFα signaling which activates a dual kinase system (Fig. 1.4). On the one hand, TNFα leads to survival which is mediated by the IKK kinases phosphorylating the inhibitor of NF-κB (IκBα), thus, liberating NF-κB transcription factors to induce IL-6 transcription and proliferation [Karin, 2008]. On the other hand, TNFα induced apoptosis as a consequence of c-Jun N terminal kinase (JNK) activation phosphorylating the classical activated protein 1 (AP-1) [Karin & Gallagher, 2005; Ventura et al., 2003].
TRAF2 Caspase8
Apoptosis
Induction of pro-inflammatory genes:
Cytokines Chemokines Adhesion molecules Induction of anti-apoptotic genes
Anti-apoptotic proteins Acute phase proteins
TNF alpha
NEMO IKK1 IKK2
IκB (Ub)a IKK complex
Proteasome cytoplasm
extracellular
p65 p50 IκB
p65 p50
p65 p50 nucleus
NF-κB
IL-6 MAP3K
MKK4/7
JNK
cJun JunB
P
P P P
P P
P P
AP1
Figure 1.4: TNFα signaling pathway
TNFα binds to its receptor and mediates signaling by the IKK complex (IKK1,
IKK2, NEMO). The IKK complex phosphorylates IκB leading to its ubiquiti-
nation and degradation by the proteasome. The transcription factor NF-κB
translocates to the nucleus and activates transcription of target genes such as
IL-6. Alternatively, the TNFα receptor phosphorylates MAP3K mediated by
Caspase 8 leading to phosphorylation of MKK which results in JNK activa-
tion. c-Jun, phosphorylated by JNK forms AP-1 with the JunB proteins and
regulates target genes.
1.3.1 JAK/Stat-signaling
Upon IL-6 binding to the IL-6Rα, the gp130 complex recruits Janus-activated- kinases (JAK) [O’Shea et al., 2002]. JAKs provide tyrosine kinase activity at the activated IL-6Rα. These JAKs bind to the intracellular receptor domains and phosphorylate tyrosines of the IL-6Rα after JAK dimers phosphorylate each other [O’Shea et al., 2002]. These phosphorylated tyrosines of the receptor are binding sites for proteins containing src- homology 2 (SH2) domains [O’Shea et al., 2002].
Signal transducer and activator of transcription 3 (Stat-3) binds to the receptor by its SH2 domain and thereby tyrosin 705 of Stat-3 is phosphorylated by the JAKs [O’Shea et al., 2002]. This induces a conformational change and creates new SH2 binding sites at the Stat-3 surface [Akira, 1997]. Therefore, Stat-3 dissociates from the IL-6Rα, forms homodimers, translocates into the nucleus and enhances or in- hibits transcription of target genes (Fig. 1.5) [Ramadori & Christ, 1999; Akira, 1997].
One of the target genes of Stat-3 is the suppressor of cytokine signaling (Socs) 3 [Endo et al., 1997]. Socs-3 in turn negatively regulates the IL-6 mediated sig- naling transduction pathway in a negative feedback loop (Fig. 1.5). On the one hand, Socs-3 binds to phosphorylated tyrosine at the IL-6Rα and therefore occu- pies binding sites for Stat-3. On the other hand, Socs-3 binds directly to JAKs thereby reducing JAK kinase activity [Kawazoe et al., 2001; Naka et al., 1999, 1997;
Bjørbaek et al., 1998; Endo et al., 1997].
JAK
JAK
SOCS3 extracellular
cytoplasm
nucleus
STAT3 AP-1 c-Jun
c-Fos
c-Jun c-Fos
MAP3K MAP2K
JNK
p38 ERK
Cytokines Mito genes (Cycl D1) Cell cycle arrest genes (p53) Cell growth
Proliferation Differentiation
Induction of pro-inflammatory genes
Induction of acute phase proteins Regulation of SOCS3 Stat-3
Stat-3 P P
Stat-3 Stat-3
P P
Stat-3
Stat-3
P P
P P
P P
P P P P
P P
P P
gp130
gp130
IL-6
IL-6Rα
Figure 1.5: IL-6 signaling pathway
IL-6 binds to its receptor, composed of gp130 and IL6Rα. Gp130 recruits JAKs which phosphorylate the receptor after transphosphorylation. The phospho- rylated receptor recruits Stat-3 which is phosphorylated by JAKs and forms homodimers. These dimers translocate to the nucleus and induce transcrip- tion of target genes.
1.3.2 MAPK-signaling
Additionally to the JAK/Stat pathway, IL-6 activates the mitogen-activated pro- tein kinase (MAPK) pathway (Fig. 1.5). The MAPK pathway regulates embryonic development, cell differentiation, cell proliferation and apoptosis and is activated by mitogenes, cytokines or cellular stress [Davis et al., 2002; Davis, 2000]. Three groups of MAPK are described consisting of JNK, the extracellular signal-related kinases (ERK) and the p38 protein kinases (Fig. 1.5) [Ramadori & Christ, 1999].
JNK is mainly activated by pro-inflammatory cytokines such as TNFα and IL-6
or by cellular stress [Weston & Davis, 2002]. The signal transduction from the
receptor to the MAP3K is not yet fully elucidated. However, it was demonstrated
that mixed-lineage protein kinase (MLK) 1, apoptosis signal-regulating kinase (ASK) 1, MAP kinse-ERK kinase (MEK) 1/4, TGF activated kinase (TAK) 1 and JNK 1-3 are participating in this signaling pathway [Davis, 2000; Baud et al., 1999].
Finally, JNK phosphorylates c-Jun which forms a homodimer or heterodimer with other Jun- or FBJ osteosarcoma oncogene- (Fos) proteins to produce AP-1 [Weston & Davis, 2002; Karin & Chang, 2001]. AP-1 activation regulates cytokine production, enhances transcription of mitotic genes such as Cyclin D1 and re- duces expression of cell cycle arrest genes such as p53 [Angel & Karin, 1991].
The ERK signaling pathway involves MEK 1 and 2, rapidly accelerated fi- brosarcoma kinase (RAF) and ERK 1 and 2 and regulates cell growth, prolifer- ation and differentiation [Zhang et al., 2004]. Over-expression and activation of ERK can be detected in many types of cancer [Jin et al., 2013; Bartholomeusz et al., 2012; Caja et al., 2009; Zhang et al., 2004].
The p38 pathway is activated by stress, UV light and osmotic stress. This path-
way involves signaling of MLK and ASK-1 as well as TAK, McKusick-Kaufman
syndrome kinase (MKK) 3/6, p38 and MAPKα/β and results in similar outcomes
as the ERK pathway [Shi & Gaestel, 2002; Tibbles & Woodgett, 1999].
1.4 Apoptosis
Evading or inhibiting apoptosis is one of the hallmarks in the development of cancer [Hanahan & Weinberg, 2000]. The hypothesis that apoptosis serves as a barrier to cancer was first raised in 1972, when Kerr, Wyllie, and Currie described massive apoptosis in the cells populating rapidly growing, hormone-dependent tumors following hormone withdrawal [Kerr et al., 1972].
Apoptosis is the process of programmed cell death and can be induced by sev- eral stimuli including cellular stress, UV-light, DNA damage and virus infections [Green, 2005]. Apoptosis leads to characteristic morphological cell changes, in- cluding cell shrinkage, nuclear fragmentation, chromatin condensation and chro- mosomal DNA fragmentation, which subsequently results in cell death [Hanahan
& Weinberg, 2011]. In contrast to necrosis, which is a form of traumatic cell death,
apoptosis is necessary during an organism’s life cycle, for example for the separa-
tion of fingers and toes in a developing human embryo [Haruta et al., 2011]. Fur-
thermore, apoptosis is necessary to eliminate cells with DNA damage and keeps
proliferating tissue in balance [Hanahan & Weinberg, 2011]. Missregulation of
apoptosis results in wide range of pathophysiological consequences, including
carcinogenesis and Alzheimer’s disease [Rohn, 2010]. The apoptotic process is
tightly regulated and divided into two pathways which can overlap. On the one
hand the extrinsic pathway mediated by membrane-bound death receptors, such
as the TNF-receptor, on the other hand the intrinsic pathway mediated intracel-
lular via the mitochondria [Hanahan & Weinberg, 2011].
1.4.1 Extrinsic apoptotic pathway
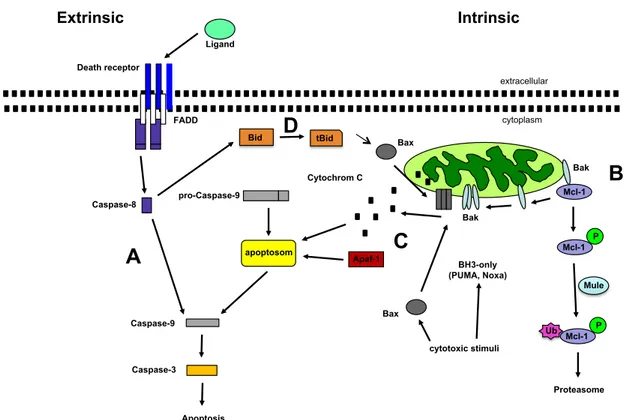
The extrinsic apoptotic pathway is mediated via death receptors (DR) from the TNF-receptor family, including Fas (CD95/Apo1), TNFR, DR3, DR4, DR5, DR6, NGFR and EDAR [Bhardwaj & Aggarwal, 2003] . After binding of the ligand at the extracellular, cystein-rich part of the DR, adapter proteins are recruited to the intracellular part of the receptor which cleaves and thereby activates Caspase 8 (Fig. 1.6A) [Hengartner, 2000]. This leads to recruitment of Caspase 3. Caspase 3 is cleaved by Caspase 9 and thereby activated which results in degradation of cellular components (Fig. 1.6A) [Malhi et al., 2010].
1.4.2 Intrinsic apoptotic pathway
The key element of the intrinsic apoptotic pathway are the mitochondria which are the central sensory organelle that can respond to DNA damage. The double membrane of the mitochondria consists of the inner and the outer membrane. The inner, impermeable mitochondrial membrane (IMM) consists of many invagina- tions called cristae and harbor different enzyme complexes essential for the respi- ratory chain. The outer, semi-permeable mitochondrial membrane (OMM) com- prises different membrane-bound protein complexes which allow the exchange of small molecules and proteins between mitochondria and cytosol. The intermem- brane space (IMS) contains pro-apoptotic factors such as cytochrome C, apoptosis inducing factor (AIF) or endonuclease G which cannot pass through the constitu- tive protein channel and stay in the IMS. (Fig. 1.6B) The mitochondria respond to DNA damage by mitochondrial outer membrane permeabilization [Green, 2005;
Chipuk et al., 2006]. By forming pores, cytochrome C can be released into the cyto-
plasm and interact with apoptotic protease activating factor-1 (Apaf-1) (Fig. 1.6C)
[Green, 2005; Chipuk et al., 2006]. Recruitment of pro-Caspase 9 to the complex
then leads to formation of the apoptosom, cleavage of Caspase 9 and activation
of Caspase 3 (Fig. 1.6C) [Green, 2005; Chipuk et al., 2006].
Ligand Death receptor
FADD
Caspase-8
Bid tBid
extracellular
cytoplasm Bax
Cytochrom C pro-Caspase-9
apoptosom
Apaf-1
Caspase-9
Caspase-3
Apoptosis
Bak
Mcl-1
BH3-only (PUMA, Noxa)
cytotoxic stimuli
Extrinsic Intrinsic
Bax
Bak
A
D
C
B
P Mcl-1
P Mcl-1 Ub
Proteasome Mule