The fat mass and obesity-associated protein (Fto) regulates activity of the
dopaminergic circuitry
I n a u g u r a l - D i s s e r t a t i o n
zur Erlangung des Doktorgrades
der Mathematisch-Naturwissenschaftlichen Fakultät der Universität zu Köln
vorgelegt von Martin Heß aus Adenau
Köln 2014
Prof. Dr. Aleksandra Trifunovic
Tag der mündlichen Prüfung: 27 . Januar 2014
A learning experience is one of those things that say, “You know that thing you just did?
Don’t do that.”
- Douglas Adams -
Abbreviations xii
Abstract xiv
Zusammenfassung xvi
1 Introduction 1
1 . 1 Obesity and obesity associated diseases . . . . 1
1 . 1 . 1 Monogenic obesity . . . . 1
1 . 1 . 2 Polygenic obesity . . . . 2
1 . 2 Regulation of body weight . . . . 4
1 . 2 . 1 Energy homeostasis . . . . 4
1 . 2 . 2 CNS in regulation of energy homeostasis . . . . 5
1 . 3 The dopaminergic system . . . . 7
1 . 3 . 1 Dopamine and dopaminergic neurons . . . . 7
1 . 3 . 2 Dopamine receptors and dopamine signaling . . . . 8
1 . 3 . 3 Dopamine and reward related behaviors . . . . 9
1 . 3 . 4 Dopamine and obesity . . . . 12
1 . 3 . 5 DRD 2 /DRD 3 autoreceptor feedback loop . . . . 14
1 . 4 The fat mass and obesity-associated protein (FTO) . . . . 15
1 . 4 . 1 Genome wide association studies . . . . 15
1 . 4 . 2 Human FTO phenotypes . . . . 21
1 . 4 . 3 Murine Fto studies . . . . 22
1 . 4 . 4 Molecular function of FTO . . . . 26
1 . 5 m 6 A RNA modification . . . . 29
Contents iii
1 . 5 . 1 RNA and RNA modifications . . . . 29
1 . 5 . 2 N 6 -methyladenosine (m 6 A) . . . . 30
1 . 5 . 3 The m 6 A methylome . . . . 33
1 . 6 Objectives . . . . 34
2 Materials and Methods 35 2 . 1 Animal care . . . . 35
2 . 2 Experimental mouse models . . . . 35
2 . 3 Genotyping . . . . 36
2 . 4 Phenotyping . . . . 37
2 . 4 . 1 Body weight . . . . 37
2 . 4 . 2 Insulin tolerance test . . . . 37
2 . 4 . 3 Glucose tolerance test . . . . 37
2 . 4 . 4 Indirect calorimetry . . . . 37
2 . 4 . 5 Food intake and refeeding response . . . . 38
2 . 5 Microarray expression analysis . . . . 38
2 . 6 Quantitative polymerase chain reaction . . . . 39
2 . 6 . 1 Preparation of RNA . . . . 39
2 . 6 . 2 Reverse transcription and quantitative PCR . . . . 39
2 . 7 Protein biochemistry . . . . 40
2 . 7 . 1 Protein preparation . . . . 40
2 . 7 . 2 Western blot . . . . 40
2 . 8 Behavioural experiments . . . . 41
2 . 8 . 1 Open Field . . . . 41
2 . 8 . 2 Conditioned Place Preference . . . . 42
2 . 8 . 3 Sucrose preference . . . . 42
2 . 9 Electronmicroscopy . . . . 43
2 . 10 Immunohistochemistry . . . . 44
2 . 11 In situ hybridization . . . . 45
2 . 12 Electrophysiology . . . . 46
2 . 13 Microdialysis . . . . 47
2 . 14 MeRIP pulldown . . . . 49
2 . 15 GO analysis . . . . 49
2 . 16 Pathway analysis . . . . 50
2 . 17 Graphical representation of data . . . . 50
2 . 18 Statistics . . . . 51
2 . 19 Chemicals and Materials . . . . 51
3 Results 53 3 . 1 Whole body Fto deficiency alters the function of the dopaminergic circuitry . . . . 53
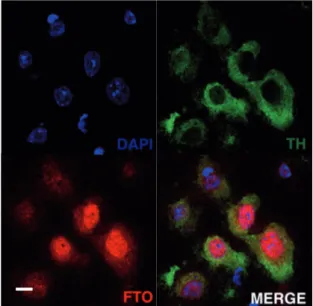
3 . 1 . 1 FTO is expressed in midbrain dopaminergic neurons . . . . . 53
3 . 1 . 2 Microarray analysis of Fto-deficient midbrain . . . . 54
3 . 1 . 3 Fto-deficient mice exhibit attenuated responses to cocaine . . 60
3 . 1 . 4 Attenuation of the DRD 2 /DRD 3 autoreceptor feedback loop in Fto-deficient mice . . . . 63
3 . 2 Dopamine neuron restricted loss of FTO attenuates the function of the DRD 2 /DRD 3 dependent autoreceptor feedback loop . . . . 67
3 . 2 . 1 Generation of dopamine neuron restricted Fto knock out mice 67 3 . 2 . 2 Dopamine restricted Fto knock out does not influence basic metabolic parameters . . . . 72
3 . 2 . 3 Altered DRD 2 /DRD 3 dependent responses in Fto ∆DAT . . . . 76
3 . 3 N 6 -methyladenosine in mRNA depends on FTO demethylase function 81 3 . 3 . 1 Methylated RNA immunoprecipitaion (MeRIP) sequencing identifies demethylation targets of FTO . . . . 81
3 . 3 . 2 m 6 A in mRNA influences translation of methylated transcripts 83 4 Discussion 92 4 . 1 Fto deficiency alters D 2 -like receptor–dependent responses . . . . 93
4 . 1 . 1 FTO is expressed in midbrain dopaminergic neurons . . . . . 93
Contents v
4 . 1 . 2 Whole body Fto-deficiency attenuates responses to cocaine . 93 4 . 1 . 3 Impairment of D 2 -like autoreceptor signaling . . . . 94 4 . 2 Conditional loss of Fto resembles D 2 autoreceptor deficiency . . . . 95
4 . 2 . 1 Successful generation of dopamine neuron specific knock out mice . . . . 95 4 . 2 . 2 Cell-autonomous impairment of D 2 -like autoreceptor signaling 96 4 . 2 . 3 Relation of whole body and dopamine restricted FTO defi-
ciency to D 2 receptor studies . . . . 98 4 . 3 FTO demethylates m 6 A in messenger RNA . . . . 100 4 . 3 . 1 FTO acts as a m 6 A demethylase in vivo . . . . 100 4 . 3 . 2 Selected candidate transcripts are affected on protein level . . 101 4 . 4 Relation to studies of human FTO genomic variation . . . . 108 4 . 5 Conclusions . . . . 109 4 . 6 Perspectives . . . . 111
5 Bibliography 113
6 Appendix 139
Danksagung 169
Erklärung 170
Teilpublikationen 171
Curriculum vitae 174
1 . 1 Pre- and postsynaptic dopamine receptor signaling . . . . 10
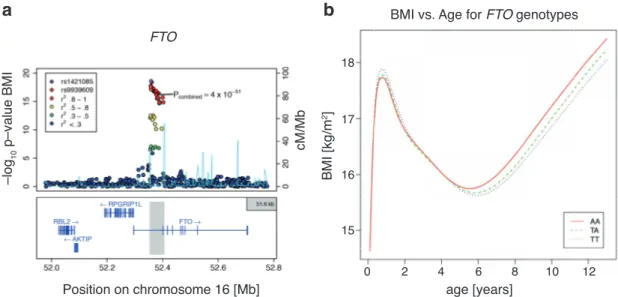
1 . 2 Genome wide association studies link FTO to obesity . . . . 16
1 . 3 Reversible N 6 -methyladenosine modification . . . . 32
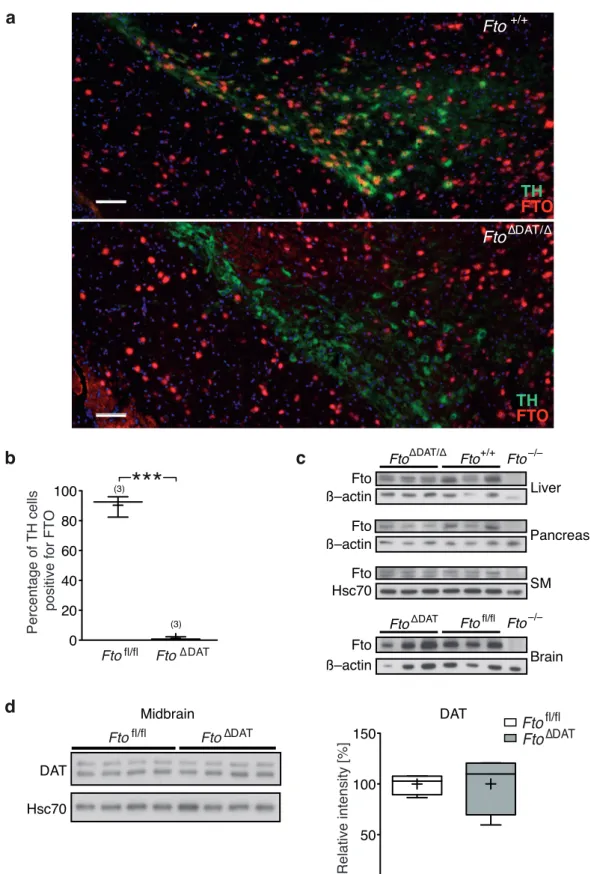
3 . 1 FTO is expressed in dopaminergic neurons of the midbrain . . . . . 53
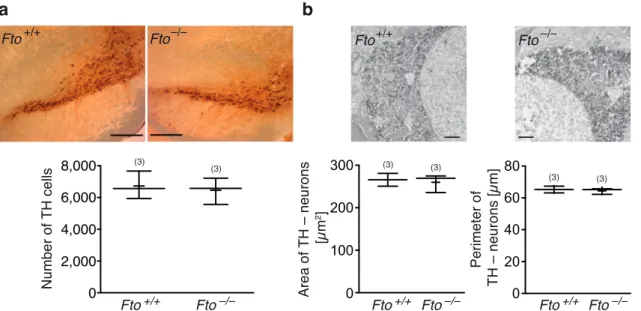
3 . 2 Loss of FTO does not alter cell number or morphology of dopami- nergic midbrain neurons . . . . 55
3 . 3 Microarray analysis of Fto-deficient midbrain tissue . . . . 56
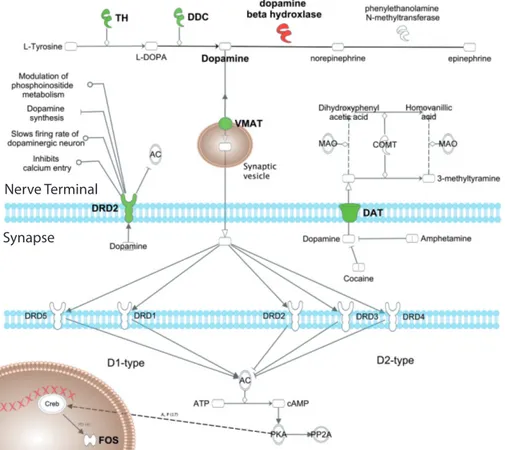
3 . 4 Schematic overlay of the microarray expression data and the dopa- minergic signaling pathway . . . . 58
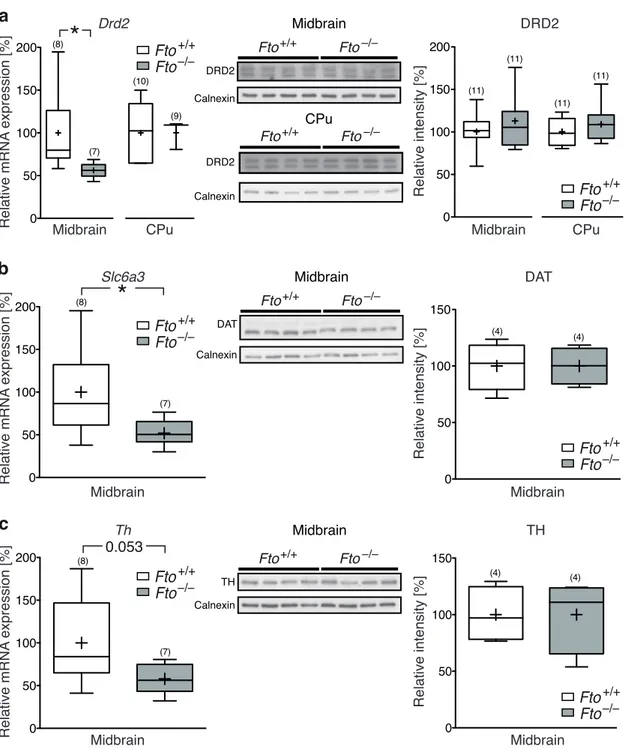
3 . 5 Selected transcripts deregulated in microarray analysis are not al- tered on protein level . . . . 59
3 . 6 Cocaine fails to increase locomotor activity in Fto-deficient mice . . 60
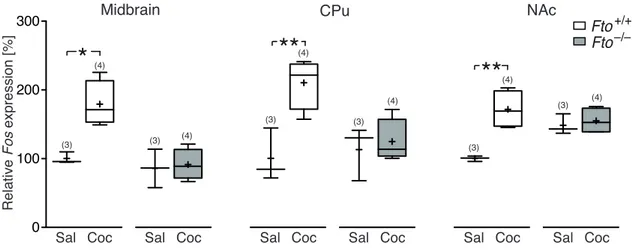
3 . 7 Cocaine fails to increase Fos expression in Fto-deficient mice . . . . . 61
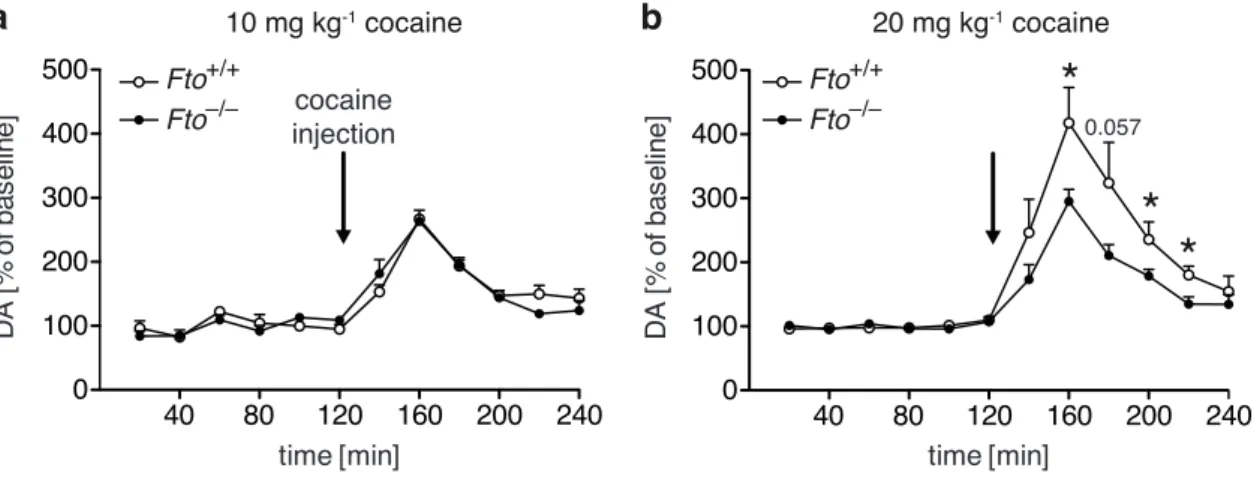
3 . 8 Reduction in cocaine-induced extracellular dopamine in the nucleus accumbens of Fto-deficient mice . . . . 62
3 . 9 Altered DRD 2 /DRD 3 receptor dependent responses in Fto-deficient mice . . . . 64
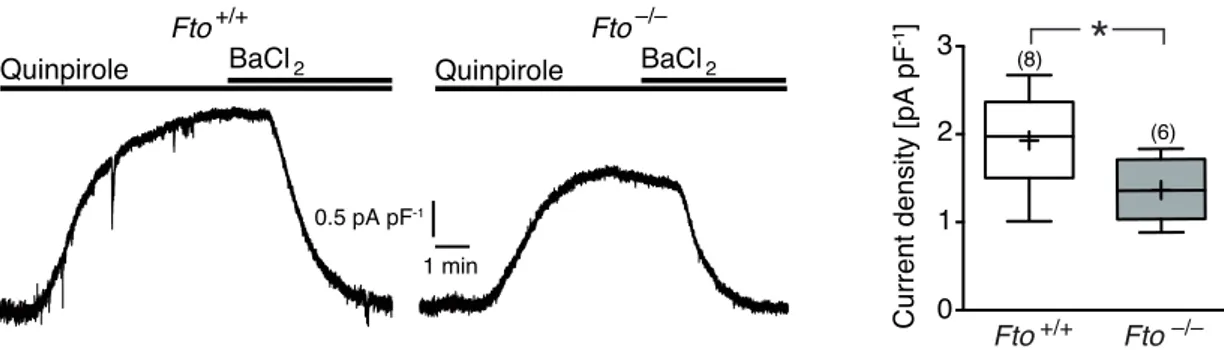
3 . 10 Reduced GIRK dependent current density in Fto-deficient mice . . . 66
3 . 11 Attenuated quinpirole dependent decrease in locomotor activity in Fto-deficient mice . . . . 67
3 . 12 Schematics of Cre-dependent deletion of Fto . . . . 68
3 . 13 Validation of DA neuron specific Fto deletion . . . . 69
List of Figures vii
3 . 14 Fto deletion in DA neurons does not affect FTO expression in mid-
brain GABAergic neurons . . . . 71
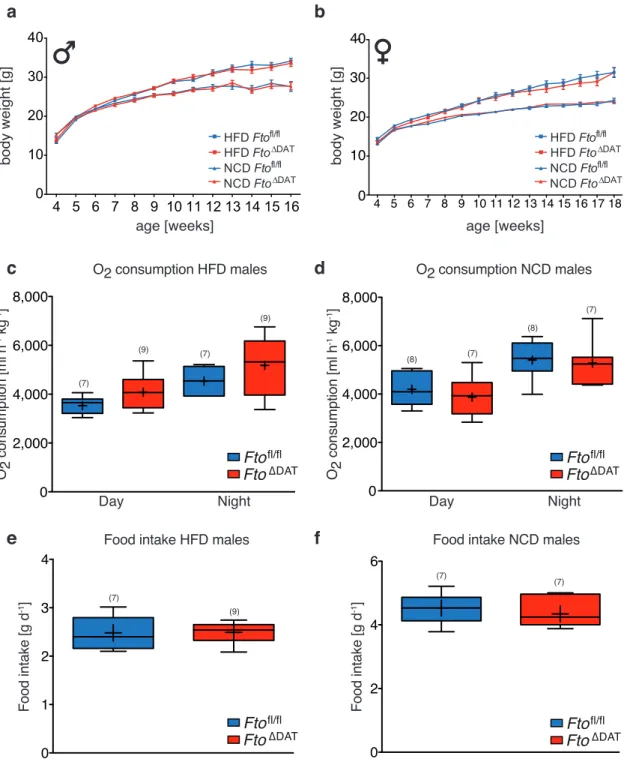
3 . 15 Basic metabolic parameters are unchanged in Fto ∆DAT mice . . . . . 73
3 . 16 Unchanged insulin and glucose tolerance in Fto ∆DAT mice . . . . 74
3 . 17 Food intake and refeeding response are unaltered in Fto ∆DAT mice . 75 3 . 18 Sucrose preference is unaltered in Fto ∆DAT mice . . . . 76
3 . 19 Attenuated responses of midbrain neurons to cocaine and quinpirole in Fto ∆DAT mice . . . . 77
3 . 20 Reduced GIRK dependent current density in Fto ∆DAT mice . . . . 78
3 . 21 Altered baseline and cocaine evoked locomotor activity in Fto ∆DAT mice . . . . 79
3 . 22 Attenuated quinpirole dependent decrease in locomotor activity in Fto ∆DAT mice . . . . 79
3 . 23 Low dosage of cocaine shifts preference of Fto ∆DAT mice in condi- tioned place preference . . . . 81
3 . 24 Gene ontology analysis of transcripts with m 6 A hypermethylation in Fto-deficient mice . . . . 82
3 . 25 Gene ontology analysis of transcripts m 6 A methylated in control mice 84 3 . 26 Pathway analysis of m 6 A hypermethylated transcripts in Fto-deficient mice . . . . 85
3 . 27 FTO demethylation target Drd3 . . . . 86
3 . 28 FTO demethylation target Kcnj6 . . . . 87
3 . 29 FTO demethylation target Grin1 . . . . 88
3 . 30 FTO demethylation target Gnai1 . . . . 89
3 . 31 FTO demethylation target Ikbkb . . . . 90
3 . 32 FTO demethylation targets Gnao1 and Gnb5 . . . . 91
6 . 1 Reduction in cocaine-induced c-Fos immunoreactivity in Fto-deficient mice . . . . 139
6 . 2 Confirmation of Fto expression by β-galactosidase staining . . . . 140
2 . 1 Genotyping Primer . . . . 36
2 . 2 Realtime PCR probes . . . . 39
2 . 3 Antibodies for Western blot . . . . 41
2 . 4 Chemicals . . . . 51
6 . 1 Electrophysiological properties of Fto-deficient dopamine neurons . 139 6 . 2 List of transcripts deregulated in Fto-deficient midbrain microarray analysis . . . . 141
6 . 3 Transcripts hypermethylated in Fto-deficient mice . . . . 147
Abbreviations
2 -OG 2 -oxoglutarate
α-MSH α-melanocyte stimulating hormone
ABH AlkB homolog
AC adenylyl cyclase
ADHD attention-deficit/hyperactivity disorder AlkB α-ketoglutarate-dependent dioxygenases ALKBH alkB alkylation repair homolog
AgRP agouti-related peptide APOE apolipoprotein
ARC arcuate nucleus
BDNF brain-derived neurotrophic factor
BMI body mass index
BOLD blood oxygen dependent
BW body weight
cAMP cyclic adenosine monophosphate
CART cocaine and amphetamine regulated transcript CARTPT CART prepropeptide
cDNA complementary DNA
CDS coding sequence
CPu caudate putamen
CUTL 1 cut-like homeobox 1
DA dopamine
DAT dopamine transporter
DAPI 4 -, 6 -Diamidin- 2 -phenylindol
DNA deoxyribonucleic acid DMH dorsomedial hypothalamus DRD 2 type- 2 dopamine receptor DRD 3 type- 3 dopamine receptor ES cells embryonic stem cells
EUCOMM European Conditional Mouse Mutagenesis Program
FC fold change
FDR false discovery rate
FLP flippase (recombination enzyme)
Ft fused toes
FTO fat mass and obesity associated protein GABA γ-aminobutyric acid
GIRK G protein-coupled inwardly rectifying potassium channel
GO gene ontology
GRIN 1 glutamate receptor, ionotropic, N-methyl-D-aspartate 1 GTT glucose tolerance test
GWAS genome wide association studies ICV intracerebroventricular
IGF- 1 insulin-like growth factor I.P. intraperitoneal
IRS insulin receptor substrate ITT insulin tolerance test
kD kilo Dalton
KO knock out
LH lateral hypothalamus
m 3 T 3 -methylthymine
m 3 U 3 -methyluracil
m 5 C 5 -methylcytosine
m 6 A N 6 -methyladenosine
xi
m 6 A m N 6 methyl- 2 ’-O-methyladenosine m 7 G N 7 -methylguanosine
MC 4 R melanocortin 4 receptor
MCH melanocyte concentrating hormone MEF mouse embryonic fibroblast
meRIP-Seq methylated RNA immunoprecipitation with next-generation se- quencing
mRNA messenger ribonucleic acid
miRNA micro RNA
MSC multi-synthetase complex
mTORC 1 mammalian target of rapamycin complex 1 N m 2 ’-O-methylnucleotide
NA noradrenaline
NAc nucleus accumbens
NMDAR 1 N-methyl-D-aspartate receptor subunit 1
NPY neuropeptide Y
PBS phosphate buffered saline PCR polymerase chain reaction
PFA paraformaldehyde
PKA protein kinase A POMC pro-opiomelanocortin PVN paraventricular nucleus
PYY peptide YY
qPCR quantitative polymerase chain reaction RNA ribonucleic acid
rRNA ribosomal RNA
RMA robust multiarray average
RPKM reads per kilobase per million reads
RPGRIP 1 L retinitis pigmentosa GTPase regulator-interacting protein- 1 like
RT room temperature
ssDNA/RNA single stranded DNA/RNA SDS sodium dodecyl sulfate SEM standard error of the mean siRNA small-interfering RNA snRNA small nuclear RNA
SNP single nucleotide polymorphism
SN substantia nigra
SNpc substantia nigra pars compacta
STAT 3 signal transducer and activator of transcription 3 TBS tris buffered saline
TE Tris/HCl EDTA
TG transgene
TH tyrosine hydroxylase
tRNA transfer RNA
UCP- 1 uncoupling protein 1
UPLC ultra performance liquid chromatography UTR untranslated region
UV ultraviolet
VMH ventromedial hypothalamus VTA ventral tegmental area WAT white adipose tissue
WHO World Health Organization
WT wildtype
Abstract
In 2007 genome wide sequencing led to the identification of common genetic vari- ations within intronic regions of the human FTO gene that are associated with obesity related traits. To date, neither the consequence of these variations for FTO expression, nor the exact molecular function of the FTO protein are known.
This study shows that inactivation of the murine Fto gene alters the function of the midbrain dopaminergic circuitry. Loss of FTO impairs the dopamine neu- ron autoreceptor feedback inhibition that depends on dopamine receptors type 2 (DRD 2 ), type 3 (DRD 3 ) and G protein coupled inwardly rectifying potassium chan- nels (GIRKs). This attenuation of the autoinhibitory feedback loop was observed for both whole body Fto-deficient and dopamine neuron restricted Fto knock out (Fto ∆DAT ) mice. While Fto-deficient mice exhibited deficits in their responses to stimulation with cocaine, Fto ∆DAT mice displayed a hypersensitivity to the locomo- tor and reward stimulating effects of cocaine and resembled DRD 2 autoreceptor- deficient mice.
On the molecular level, FTO encodes a nucleic acid demethylase that is able to remove N 6 -methyladenosine (m 6 A) from messenger RNA. Analysis of m 6 A in mRNA of Fto-deficient midbrain and striatum showed that FTO acts as a m 6 A demethylase in vivo. Increased methylation, however, was only demonstrated for a subset of all m 6 A methylated transcripts. This subset included many transcripts important for cell-cell and neuronal signaling. Furthermore, many of these hy- permethylated transcripts are components of dopaminergic signaling and some of these displayed a deregulation on the protein level in Fto-deficient mice, such as DRD 3 , GIRK 2 and NMDAR 1 .
Taken together, FTO, via acting as a m 6 A demethylase, plays an important role
in regulating the dopamine autoinhibitory feedback loop and hence impinges on
dopamine circuit function. Malfunction of dopamine signaling has been implicated
in a variety of diseases such as depression, schizophrenia or ADHD and therefore
poses the question whether FTO genomic variation is associated with diseases other
than obesity and whether association with obesity related traits is partly due to
alterations in dopamine circuit function.
Zusammenfassung
Genomweite Sequenzierung führte in 2007 zur Entdeckung weit verbreiteter genetis- cher Variationen in nicht-kodierenden Regionen des humanen FTO Gens, welche mit verschiedenen Merkmalen krankhaften Übergewichts assoziiert sind. Bis heute sind sowohl die Auswirkungen dieser Variationen auf die Expression von FTO, als auch die exakte molekulare Funktion des FTO Proteins unbekannt.
In dieser Studie konnte gezeigt werden, dass die Inaktivierung von murinem Fto die Funktion des dopaminergen Systems des Mittelhirns beeinflusst. Ver- lust von FTO führte zu einer Beeinträchtigung der autoinhibitorischen Rückkop- plungsschleife dopaminerger Neurone, welche von Dopaminrezeptoren des Typs 2 (DRD 2 ), Typs 3 (DRD 3 ) und G Protein gekoppelten einwärts gleichrichtenden Kalium Kanälen (GIRKs) abhängig ist. Diese Fehlfunktion der autoinhibitorischen Rückkopplung konnte sowohl bei ganzkörper-Fto-defizienten, als auch bei spezifis- chem Verlust der Fto Expression in dopaminergen Neuronen (Fto ∆DAT ) beobachtet werden. Während dies in ganzkörper-Fto-defizienten Mäusen zu verminderten Antworten auf Kokain Stimulation führte, erfuhren Fto ∆DAT Mäuse eine erhöhte Sensitivität für die bewegungs- und belohnungsstimulierende Wirkung von Kokain.
Auf molekularer Ebene kodiert das FTO Protein für eine Nukleinsäure Demethy- lase, die N 6 -Methyladenosin (m 6 A) von Boten-RNA (mRNA) entfernen kann. Die Analyse von m 6 A Modifizierungen in mRNA Fto defizienter Mäuse zeigte, dass FTO in vivo als m 6 A Demethylase agiert. Erhöhte Methylierungsmuster konnten allerdings nur in einem Teil aller prinzipiell m 6 A modifizierten Transkripte nach- gewiesen werden. Diese Teilmenge hypermethylierter Transkripte beinhaltete zum großen Teil wichtige Komponenten der Zell-Zell und neuronalen Kommunikation.
Darüber hinaus befanden sich unter den hypermethylierten Transkripten wichtige
Bestandteile der dopaminergen Signalweiterleitung. Für einige dieser Komponen- ten (z.B. DRD 3 , GIRK 2 und NMDAR 1 ) wurde eine verminderte Proteinexpression nachgewiesen.
Zusammengefasst erfüllt FTO als m 6 A Demethylase eine wichtige Rolle in der
Kontrolle der autoinhibitorischen Rückkopplungsschleife in dopaminergen Neuro-
nen und beeinflusst die Funktion des dopaminergen Systems sowohl auf Netzwerk-
, als auch auf Einzelzellebene. Fehlfunktionen des dopaminergen Systems treten
bei verschiedensten Krankheitsbildern auf, wie z.B. Depression, Schizophrenie oder
Aufmerksamkeitsdefizit-/Hyperaktivitätsstörung. Daher stellt sich die Frage, ob
genomische Variabilität im FTO Locus auch mit anderen Erkrankungen als Über-
gewicht assoziiert ist, beziehungsweise ob den Assoziationen mit verschiedenen
Merkmalen krankhaften Übergewichts zum Teil eine Veränderung des dopaminer-
gen Systems zu Grunde liegt.
1 Introduction
1.1 Obesity and obesity associated diseases
Over the last decades the prevalence of obesity has dramatically increased, prompt- ing the World Health Organisation (WHO) to classify obesity as an epidemic of global proportion. Recent estimations suggest that about 1 . 4 billion people are overweight of which one third is considered obese (source: WHO). This increase in obesity is not only observed in western society, but is also identified as a threat to developing countries [Malik et al., 2013 ]. Overweight (body mass index (BMI)
≥ 25 kg/m 2 ) and obesity (BMI ≥ 30 kg/m 2 ) are known risk factors for type 2 diabetes mellitus (T 2 DM), cardiovascular disease and certain forms of cancer, all of which contribute to the increased mortality that is observed for obese pa- tients [Katzmarzyk et al., 2003 ]. Moreover, even neurodegenerative diseases such as Alzheimer’s disease have been associated with obesity [Hildreth et al., 2012 ].
These comorbidities render obesity one of the biggest challenges to modern soci- ety. Obesity not only decreases the individual quality of life, but is also becoming a far reaching socio-economic problem, placing a massive burden on our health systems [Cawley & Meyerhoefer, 2012 ; Finkelstein et al., 2009 ]. Thus, a necessity emerged to understand the genetics and molecular mechanisms of body weight regulation and to develop strategies to tackle the progressing obesity epidemic.
1.1.1 Monogenic obesity
Since obesity has moved into focus, the study of severely obese patients has led to
the identification of several loss-of-function mutations within the human genome
[Farooqi & O’Rahilly, 2006 ]. These rare cases of monogenic obesity include e.g.
mutations of leptin [Montague et al., 1997 ], the leptin receptor [Clément et al., 1998 ], proopiomelanocortin (POMC)[Krude et al., 1998 ] and melanocortin 4 recep- tor (MC 4 R) [Yeo et al., 1998 ; Farooqi et al., 2003 ]. Individuals suffering from one of these mutations inevitably face obesity, regardless of environmental factors. Many of these studies have helped to identify critical components of the mechanisms governing energy homeostasis. Some of these patients have even benefited from treatment made available through their diagnosis. Leptin deficient patients, for example, are treated with recombinant leptin, leading to body weight loss and enabling them to lead a normal life [Farooqi et al., 1999 ].
Monogenic forms of obesity are rare within the population and the frequency of these genomic variations has not changed since the prevalence of obesity is rising [Caballero, 2007 ]. Hence, rare loss-of-function mutations are not the underlying reason for the steady increase in overweight people observed since the middle of the 20 th century.
1.1.2 Polygenic obesity
Current research on the increasing prevalence of obesity in the general population, hence termed common obesity, investigates the influence of environmental fac- tors on energy homeostasis. Our sedentary lifestyle, lack of physical activity and unlimited access to energy rich, highly palatable nutrition promote a misbalance between energy intake and energy expenditure, ultimately leading to weight gain [Swinburn et al., 2011 ]. Still, considerable variation of BMI is observed in a given population that in general faces the same environmental changes and temptations.
Common variations in the human genome are believed to shape the individual susceptibility to environmental factors, thus leading to the apparent divergence of BMI within a population [Maes et al., 1997 ]. The sum of the variations carried by an individual may therefore define how environmental factors impact on certain features, such as body weight regulation.
In former years, identification of obesity related traits in the human genome
1 Introduction 3
was a laborious task that had to rely on the candidate approach. Genes that were functionally related to body weight regulation were investigated for variations and subsequently tested for associations with body weight [Loos, 2012 ]. Due to the hypothesis driven approach, however, this method lacked the power to identify yet unknown players in body weight regulation.
Since whole genome sequencing has become affordable, genome wide associa- tion studies (GWAS) represent the means to perform hypothesis generating studies.
Increasing sample sizes over the years has increased the discovery rate tremen- dously. In recent years, GWAS helped to identify several common genetic vari- ations that are associated with obesity related traits, regardless of any known or unknown function for these genes [Loos, 2012 ; Willer et al., 2009 ; Speliotes et al., 2010 ]. To date, 52 loci have been associated with BMI, body fat percentage, waist circumference, waist-to-hip ratio and early onset obesity. Some of those were al- ready known to take part in the regulation of energy homeostasis, such as variants near the insulin receptor substrate (IRS) 1 [Kilpeläinen et al., 2011 ], near MC 4 R [Loos et al., 2008 ] or within the brain-derived neurotrophic factor (BDNF) locus [Thorleifsson et al., 2009 ]. Many of the identified loci, however, have not been known for any association with obesity related traits before [Loos, 2012 ].
The effect size of each individual genomic variant is relatively small, increasing
the body weight per allele by as little as 200 grams [Loos, 2012 ]. Rather the effect
of all variants present in the genome will define each individual’s susceptibility to
obesity. Thus, not only identifying predisposing loci and their respective molecular
function, but also understanding the network of the entirety of genomic variation
is important.
1.2 Regulation of body weight
1.2.1 Energy homeostasis
In order to ensure a steady body weight, a process called energy homeostasis en- sures that both energy intake and energy expenditure are balanced. Usually, times of excessive binge eating or undernutrition are compensated over the following course of days or weeks to maintain body weight [Schwartz et al., 2000 ; Schwartz
& Porte, 2005 ]. Malfunction of these regulatory mechanisms favoring increased energy intake and reduced energy expenditure lead to increased body weight and obesity [Schwartz et al., 2000 ; Schwartz & Porte, 2005 ].
Over the past decades, several peripheral hormones have been identified that
convey the current energy status of the human organism. The anorectic hormone
leptin, produced by white adipocytes relative to their lipid content and released
into the blood stream, is a measure for the current energy storage of the body
[Friedman, 2011 , 2010 ]. While initially administration of recombinant leptin was
thought to be a potential treatment for obesity, studies showed that obese patients
have high levels of circulating leptin and the body lost its ability to process the
signal [Könner & Brüning, 2012 ; Myers et al., 2008 ]. The second hormone insulin
is released by pancreatic β-cells in response to increasing blood glucose levels af-
ter food intake and ensures the uptake of glucose in peripheral organs such as
the liver, muscle and adipose tissue [Kahn, 1994 ; Könner et al., 2009 ]. Moreover,
insulin, like leptin, was found to signal to specific neuronal populations and regu-
late food intake [Könner et al., 2009 ; Könner & Brüning, 2012 ; Belgardt & Brüning,
2010 ]. A third hormone, the orexigenic ghrelin, is secreted by the stomach and
intestine, with levels decreasing after food intake and increasing with food depri-
vation [Cummings & Overduin, 2007 ]. Leptin, insulin and ghrelin, are only three
examples of hormones involved in energy homeostasis. Jointly, these hormones
are the signal infrastructure conveying information about the peripheral energy
status to the central nervous system, the master regulator of energy homeostasis
1 Introduction 5
[Schwartz et al., 2000 ; Könner et al., 2009 ]. The evaluation of these hormonal sig- nals within the brain then leads to the behavioral outcome. Further investigations showed, that failure of brain circuits to interpret the circulating signals, e.g. in- sulin and/or leptin resistance, has major impacts on energy homeostasis [Könner
& Brüning, 2012 ].
1.2.2 CNS in regulation of energy homeostasis
Already more than 70 years ago, lesion experiments in rats demonstrated that the hypothalamic area of the brain plays a critical role in the regulation of body weight [Hetherington & Ranson, 1940 ]. Since then, further refinement of methodology led to the dissection of different nuclei within the hypothalamus in the control of energy homeostasis [Könner et al., 2009 ; Belgardt & Brüning, 2010 ; Kleinridders et al., 2009 ].
The first order neurons of the homeostatic system reside within the mediobasal
hypothalamus [Könner et al., 2009 ; Belgardt & Brüning, 2010 ]. The close prox-
imity to the blood-brain barrier render the anorexigenic POMC/CART (pro-opio-
melanocortin/cocaine and amphetamine regulated transcript) and the orexigenic
AgRP/NPY (agouti-related peptide/neuropeptide Y) neurons of the arcuate nu-
cleus (ARC) sensitive to the hormones circulating in the blood stream. Consistently,
activity of these neurons is regulated by insulin, leptin, ghrelin and even circulat-
ing levels of glucose [Könner et al., 2009 ; Belgardt & Brüning, 2010 ]. POMC/CART
neurons release α-MSH (α-melanocyte stimulating hormone), a cleavage product
of pro-opiomelanocortin, which in turn activates MC 4 receptors on the second or-
der neurons that reside e.g. within the paraventricular nucleus of the hypotha-
lamus (PVN) [Könner et al., 2009 ]. Activation of those second order neurons in
the PVN leads to a decrease in food intake [Balthasar et al., 2005 ]. Activation of
AgRP/NPY neurons on the other hand silences the POMC/CART neurons through
γ-aminobutyric acid (GABA) released from AgRP/NPY neuron synapses [Atasoy
et al., 2012 ; Könner et al., 2009 ; Belgardt & Brüning, 2010 ]. Moreover, these neurons
release AgRP, which is an inverse agonist of MC 4 receptors, blocking those recep- tors and thereby preventing α-MSH mediated activation of second order neurons [Könner et al., 2009 ; Belgardt & Brüning, 2010 ]. As a result, food intake is increased, while energy expenditure is reduced [Könner et al., 2009 ; Belgardt & Brüning, 2010 ].
Additionally, other hypothalamic nuclei feed into the homeostatic control of
body weight, such as the ventromedial (VMH), dorsomedial (DMH) and lateral hy-
pothalamic (LH) areas [Belgardt & Brüning, 2010 ; Könner et al., 2009 ]. The LH is of
special notion, as it represents one possible link of the homeostatic system to other
brain areas, such as the dopaminergic midbrain neurons which control the hedo-
nic and reward related behaviours [Sternson, 2013 ; Berthoud, 2011 ; Simerly, 2006 ;
Saper et al., 2002 ]. Orexin, secreted from orexinergic neurons within the LH, has
been demonstrated to be a potent mediator of wakefulness in control of sleep/wake
cycles in mammals [Sakurai et al., 1998 ; Harris & Aston-Jones, 2006 ; Adamantidis
et al., 2007 ; Tsunematsu et al., 2011 ]. Consistently, leptin inhibits orexinergic neu-
rons, thus allowing periods of rest and sleep in the satiated state [Yamanaka et al.,
2003 ]. Neurons of the LH project onto midbrain dopaminergic neurons and release
orexin, which subsequently alters dopaminergic neuron function via orexin recep-
tors [Sharf et al., 2010 ; Borgland et al., 2006 ]. Hence, the LH represents one possible
interface of homeostatic and hedonic regulation of food intake. Further evidence
points towards projections from the hypothalamus (AgRP/NPY neurons) directly
to DA neurons [Palmiter, 2012 ]. Conceptually, the ventral striatum (nucleus ac-
cumbens, NAc), may represent the integrative center, processing information from
the energy sensing hypothalamic nuclei, from the midbrain that conveys reward-
ing aspects of food intake and from higher brain centers that feed experience and
decision making into the equation. Consolidation of all inputs will then lead to a
subsequent behavioural outcome that may lead to food intake [Simerly, 2006 ].
1 Introduction 7
1.3 The dopaminergic system
1.3.1 Dopamine and dopaminergic neurons
Dopamine (DA) belongs to the family of catecholamine neurotransmitters and as such is a precursor of norepinephrine and epinephrine [Björklund, 2007 ]. Initially not regarded as such, dopamine is an independent neurotransmitter involved in important physiological processes [Carlsson et al., 1958 ]. The total number of do- paminergic neurons (DA neurons) increases in mammals according to the growth of cortical and striatal regions, with mice having approximately 20 , 000 to 30 , 000 DA neurons, monkeys 160 , 000 to 320 , 000 and humans 400 , 000 to 600 , 000 [Björk- lund, 2007 ]. About 70 to 75 % of these neurons reside within the midbrain in the ventral tegmental area (VTA), substantia nigra (SN) and retrorubral field, while the remaining dopamine neurons are found, for example, within the hypothala- mus and olfactory bulbs [Björklund, 2007 ; Bentivoglio & Morelli, 2005 ]. Opposing the relatively low number of dopamine neurons is the fact that each dopaminergic neuron may have synaptic contact to 300 - 400 neurons, placing the dopaminergic pathways among the most prominent innervating circuits in the brain [Schultz, 1998 ].
Classically, midbrain dopaminergic neurons have been categorized into three different pathways. First, the nigrostriatal pathway of SN dopamine neurons pro- jecting to the dorsal striatum (caudate putamen, CPu). Second, the mesolimbic pathway of VTA dopamine neurons projecting to the ventral striatum (nucleus ac- cumbens, NAc), the amygdala and olfactory tubercle. Third and finally, the meso- cortical pathway of dopamine neurons projecting to cortical areas [Björklund, 2007 ].
Novel tracing methods, however, question this view of dopaminergic projections and suggest a more complex projection pattern and cross-projections along these classical pathways [Björklund, 2007 ].
Dopamine has been implicated in a variety of processes including voluntary
movement, reward, attention, motivation, sleep, memory and learning [Iversen &
Iversen, 2007 ; Beaulieu & Gainetdinov, 2011 ; Björklund, 2007 ; Di Chiara, 2005 ; Dun- nett, 2005 ]. Loss of striatal dopamine neuron inervation represents the hallmark of Parkinson’s disease, moving dopaminergic function into the focus of Parkinson’s treatment [Iversen & Iversen, 2007 ; Sulzer, 2007 ].
1.3.2 Dopamine receptors and dopamine signaling
Five different dopamine receptors belonging to two different classes are known.
The D 1 -like dopamine receptors, including dopamine receptors D 1 (DRD 1 ) and D 5 (DRD 5 ), and the D 2 -like receptors, including dopamine receptors D 2 (DRD 2 ), D 3 (DRD 3 ) and D 4 (DRD 4 ) [Beaulieu & Gainetdinov, 2011 ]. Dopamine receptors are widely expressed within the brain, but also in peripheral tissues, such as the adrenal glands and sympathetic ganglia. DRD 1 is mainly expressed within the ventral and dorsal striatum, the substantia nigra, amygdala and olfactory bulb and represents the major receptor of the direct basal ganglia pathway [Beaulieu &
Gainetdinov, 2011 ]. DRD 2 s are the main receptors involved in the indirect basal ganglia pathway and are highly expressed in dorsal and ventral striatum, as well as the olfactory tubercle [Beaulieu & Gainetdinov, 2011 ]. DRD 3 s are mainly found within the ventral striatum (NAc) and the olfactory tubercle. DRD 2 and DRD 3 , however, are the only receptors that are also expressed presynaptically in the SN and VTA [Beaulieu & Gainetdinov, 2011 ]. D 4 and D 5 receptors exhibit the low- est expression of all dopamine receptors and are found within a variety of areas, including cortical areas, hippocampus, hypothalamus and midbrain [Beaulieu &
Gainetdinov, 2011 ].
Genes of the DRD 1 and DRD 5 do not have introns and thus these receptors are
not expressed in different splice isoforms [Beaulieu & Gainetdinov, 2011 ]. DRD 2 ,
DRD 3 and DRD 4 , however, have intronic regions in their respective genes and
several isoforms have been described, the most prominent ones being the DRD 2 S
(short isoform), that shows preferentially presynaptic expression, and the DRD 2 L
(long isoform), that is predominantly found postsynpatically [De Mei et al., 2009 ].
1 Introduction 9
Dopamine receptors belong to the family of G protein-coupled receptors and as such their main target is the regulation of the adenylyl cyclase (AC) and cAMP production [Hyman et al., 2006 ; Beaulieu & Gainetdinov, 2011 ]. Whereas D 2 -like receptors inhibit the AC via Gα i/o , D 1 -like receptors increase the activity of AC via Gα s/ol f and thus increase cAMP levels. As a result of G protein signaling, dopamine receptors modulate activity of important signaling mediators, such as protein kinase A (PKA), phospholipase C (PKC) and protein kinase B (AKT) (see Figure 1 . 1 ) [Hyman et al., 2006 ; Beaulieu & Gainetdinov, 2011 ].
Despite modulation of AC activity, several other signaling modalities have been reported for dopamine receptors. Both DRD 5 and DRD 1 have been implicated in regulation of phospholipase C (PLC) via Gα q , potentially linking dopamine signal- ing to intracellular calcium mobilization [Beaulieu & Gainetdinov, 2011 ]. Whether this connection is mainly through DRD 5 or DRD 1 (or DRD 1 :DRD 2 heterodimers), however, remains to be elucidated. D 2 -like receptors, on the other hand, have been demonstrated to activate PLC via Gβ γ , while inhibiting L- and N-type cal- cium channels through the same G protein cascade [Beaulieu & Gainetdinov, 2011 ].
Moreover, D 2 -like receptors regulate neuronal activity through Gβ γ mediated ac- tivation of G protein-coupled inwardly rectifying potassium channels (GIRKs), which hyperpolarize and hence inhibit neurons (Figure 1 . 1 ) [Lüscher & Slesinger, 2010 ]. Following activation by dopamine, dopamine receptor signaling may be ter- minated through phosphorylation by G protein-coupled receptor kinases (GRKs) and subsequent internalization. Phosphorylation, however, may also promote a late signaling event in D 2 -like receptors that inhibits protein kinase B (AKT/PKB) in a β-arrestin 2 and protein phosphatase 2 A (PP 2 A) dependent manner (Figure 1 . 1 ) [Beaulieu & Gainetdinov, 2011 ].
1.3.3 Dopamine and reward related behaviors
One of the primary functions of the dopaminergic system is the modulation of be-
havioral responses [Pandit et al., 2011 ; Volkow et al., 2013 ; Wise, 2013 ]. A major
GIRK
K + K+ K+ K+
DAT
DA neuron
Dopamine DA release
Target neurons
DA neuron silencing
G protein coupling
DRD2/
DRD3
DA
L-Tyrosine L-Dihydroxiphenylalanine (L-DOPA)
Tyrosine hydroxylase
CO2 DOPA decarboxylase