September 24, 2007
Document of the World Bank
Report No. 40906-LK Sri Lanka Malnutrition in Sri Lanka
Report No. 40906-LK
Sri Lanka
Malnutrition in Sri Lanka
Scale, Scope, Causes, and Potential Response
Health, Nutrition and Population Human Development Network Human Development Unit South Asia Region
Public Disclosure AuthorizedPublic Disclosure AuthorizedPublic Disclosure AuthorizedPublic Disclosure Authorized
M a l n u t r i t i o n
inS r i
Lanka:Scale, Scope, Causes,
andPotential Response
Meera Shekar, Aparnaa Somanathan, Lidan Du
With inputs from Sunethra Atukorala, Dariush Akhavan, Nimal D.
Kasturiaratchi, and Nistha Sinha
ABBREVIATIONS AND ACRONYNS
AAA A N C BMI C E D C H D R CSB DALY D H S DDGPHS DDGET and R D C S
DS E C C D FHB FHW GNI GNP G O S L HAZ IDA IDD I E C IMR LTTE LBW M&E M C H MOH MOOH MDG MRI MMR N C D N C H S NGO NHA NNCC OLS P H D T PHI PHM Rs .
S L R UNICEF VAD
Analytical and Advisory Activities Antenatal care
B o d y Mass Index
Chronic Energy Deficiency Child Health Development Record Corn-Soya B l e n d
Disability-Adjusted L i f e Year Demographic and Health Survey
Deputy Director General o f Health Services-Public Health
Deputy Director General o f Health Services- Education, Training and Research
Department o f Census and Statistics Department o f Statistics
Early Childhood Care and Development Family Health Bureau
Family Health Worker Gross National Income Gross National Product Government o f Sri Lanka Height-for-Age Z-Score I r o n Deficiency Anemia Iodine Deficiency Disorders
Information, Education, Communication Infant Mortality Rate
Liberation Tigers o f Tamil Eelam L o w Birthweight
Monitoring and Evaluation Maternal and Child Health Ministry o f Health
Medical Officers o f Health Millennium Development Goal Medical Research Institute Maternal Mortality Rate Noncommunicable Disease
National Center for Health Statistics Nongovernmental Organization National Health Accounts
National Nutrition Coordination Committee Ordinary Least Squares
Plantation Human Development Trust Public Health Inspector
Public Health M i d w i f e Rupees
S r i Lanka Rupees
United Nations Children’s Fund Vitamin A Deficiency
WAZ Weight-for-Age Z-Score WDI W o r l d Development Indicators
WFP W o r l d Food Program
WHZ Weight-for-Height Z-Score
WHO W o r l d Health Organization
YLD Years Lost to Disability
YLL Years Lives Lost
Country Director Naoko Ishii
A c t i n g Sector Director John A. Roome
Sector Manager Anabela Abreu
ACKNOWLEDGEMENTS
The Government o f Sri Lanka’s Ministry o f Health provided the inspiration and the “space” to undertake this analysis.
The w o r k was task-managed and l e d by Meera Shekar (World BanWHDNHE). Aparnaa Somanathan (World BanWSASHD) and Lidan Du (consultant) co-authored the report. Sunethra Atukorala, Dariush Akhavan, Lidan Du, N i m a l D. Kasturiaratchi (consultants) and Nistha Sinha (World BanWPRMGE) prepared background papers that provided the report’s starting point. A l i s t o f background papers i s attached. Rifat Hassan (World Bank/HDNHE) provided valuable technical inputs, and Alejandro Welch (World BanWSASHD) provided the team editing and logistical assistance. Thanks are due to the many colleagues at the Institute for Health Policy in Sri Lanka who responded to queries with invaluable information. Alicia H e t m e r and Rosemary Esber edited the final report.
Anabela Abreu (Sector Manager) and Julian Schweitzer (Sector Director) W o r l d BanWSASHD provided unstinting support and guidance in conceptualizing and implementing this work.
The w o r k was initiated with steadfast support f r o m the Sri Lanka Country Director Peter Harold and completed under the guidance o f his successor, Naoko Ishii.
Michele Gragnolati (World BanWECSHD) provided inputs in the initial stages o f this work, and K u m a r i Vinodhani Navaratne (World BanWSASHD) provided useful feedback o n the draft report. Chulanganie Lakshmi D e Silva (World Bank/SAREX) provided invaluable support for organizing the initiation workshop in S r i Lanka in July 2006. Kees Kostennans provided comments o n the draft document.
H a r o l d Alderman (World BanWAFTHD), L u c Christiaensen (World BanWEASRE) and L u c Laviolette (Micronutrient Initiative) peer-reviewed the report.
Development partners in Sri Lanka-UNICEF, WHO, WFP, and U N D P - c o l l a b o r a t e d in this effort. Their representatives provided feedback o n the concept note and participated in a launch workshop in Sri Lanka in July 2006.
The report i s dedicated to the hundreds o f thousands o f malnourished children and women in Sri Lanka whose lives the report’s recommendations seek to improve.
TABLE OF CONTENTS
Acknowledgments
Executive Summary ... i
1
.
Introduction ... 11.2. Repositioning Nutrition as Central to Development: A Strategy for Large-Scale Action .... 2
1.3. Structure o f this report ... 4
1.1. Rationale ... ... 1
2 . Dimensions of Malnutrition ... 5
2.1. Child undernutrition ... 2.2. Maternal undernutrition ... 2.3. Micronutrient deficiencies ... ... 17
2.4. Can Sri Lanka attain the nutrition MDG-the non-income face o f poverty? ... 22
2.5. Overweight ... 25
2.6. Conclusions ... 27
What Causes Undernutrition in S r i Lanka? ... 28
3.2. Exploratory analyses o f the causes o f undernutrition in Sri Lanka ... 31
3
.
3.1. Framework to analyze the causes o f undernutrition ... 283.3. Food security: food energy availability and dietary diversity ... 32
3.3. Health care and safe water and sanitation services ... 34
3.4. Maternal and c h i l d caring practices ... 38
3.5. Explaining variations in Undernutrition: multivariate analysis ... 43
3.6. Explaining the Poor Performance o f The Estate Sector ... 48
3.7. The South Asian Enigma . H o w Does Sri Lanka Fit In? ... 52
3.8. Conclusions ... 54
Policy and Programmatic Responses to Malnutrition: What i s being done?
...
564.2. Food subsidies and poverty alleviation programs ... 57
4.4. Integrated maternal and c h i l d health and nutrition programs ... 61
4.5. Programs to address micronutrient deficiencies and food fortification ... 65
4.6. Conclusions., ... 67
Political Economy of Malnutrition in S r i Lanka ... 69
5.1. National Stakeholders and the Policy -Making Process ... 69
5.2. Perceptions o f Nutrition Problem and Current Approaches ... 7 1 5.3. Family Health Bureau and Public Health M i d w i f e ... 7 1 Health System ... ... 5.5. Coordination and collaboration across sectors And the need for capacity strengthening ... 74
5.6. Conclusions ... 75
The Cost of Undernutrition in S r i Lanka ... 77
6.1. Losses to undernutrition: What does undernutrition cost Sri Lanka? ... 78
6.2. H o w much does Sri Lanka spend o n nutrition programs? ... 83
6.3. Cost-benefit analyses o f various interventions in Sri Lanka and potential for cost- effectiveness o f interventions ... 86
6.4. Selecting the right package o f interventions for S r i Lanka ... 88
6.5. Conclusions ... 88
7 . Next Steps and the Way Forward ... 96
Appendices ... 109
References ... 119
4 . 4.1. evolution of nutrition policies in S r i Lanka ... 56
4.3. Direct food assistance and supplementary feeding programs ... 57
5 .
5.4. Institutional Opportunities and Constraints to Integrate Nutrition Into Existing Public
6
.
List o f Figures
Figure 2.1. Overall Prevalence and Trends in Undernutrition among Children (0-5 years) in Sri
Lanka, 1987, 1993, and 2000 6
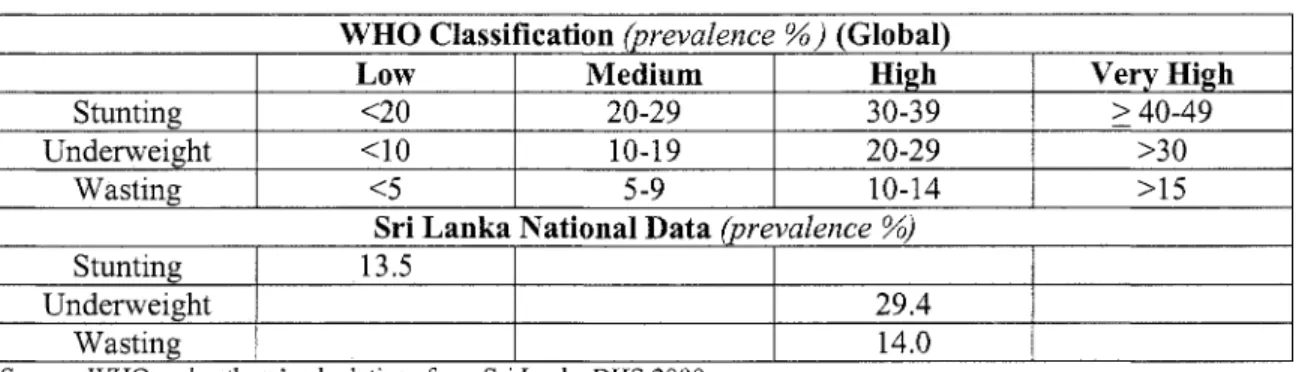
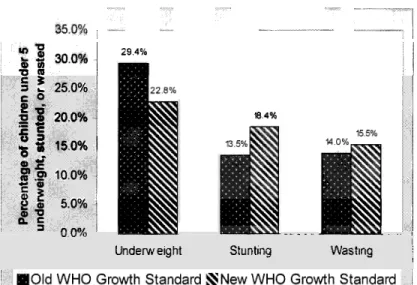
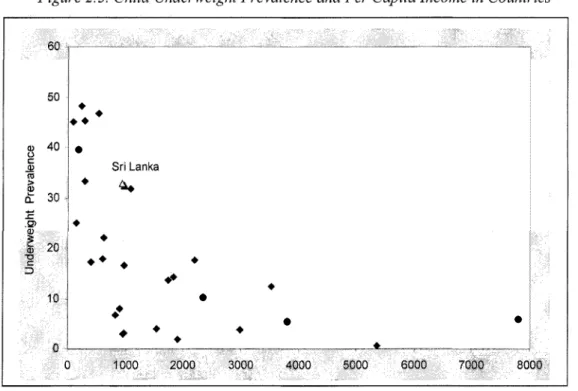
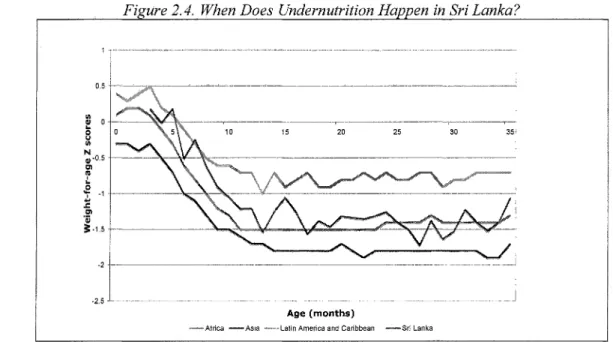
Figure 2.2. Prevalence of Undernutrition among Children Under Five in Sri Lanka according to New and Old RHO Growth Standards ... .... ... ... 7 Figure 2.3. Child Underweight Prevalence and Per Capita Income in Countries ... 8 Figure 2.4. When Does Undernutrition Happen in Sri LankaY ... 10 Figure 2.5. Children Born with Low Birthweights Track Lower for the Rest of Their Lives in Sri
Lanka ... ... 11
Figure in S ka,
1993-2000 ... 13 Figure 2.7. Underweight and Stunting Prevalence (percent) by Ethnic Group in Sri Lanka, 1993- 2000 ... 14 Figure 2.8. Underweight and Stunting Prevalence by Asset Quintiles in Sri Lanka, 1993-2000.. 15 Figure 2.9. Underweight and Stunting Prevalence by Mother’s Schooling in Sri Lanka ... 15 Figure 2. I O . Women’s (1 5-49 years) B M I and Underweight Prevalence by Region and Sector of Residence in Sri Lanka ... ... 17 Figure 2.11 Anemia Prevalence among
Figure 2.12. Anemia Prevalence Rates by Sector in Sri Lanka
Figure 2.13. Time Trends in Underweight Prevalence Rates in Sri Lanka, 1987-2015 ... 23 Figure 2.14. Predicted Prevalence of Underweight in 2015 under Various Economic Growth Scenarios in Sri Lanka ... . 2 4 Figure 2.15. Prevalence of Women ’s Overweight and Obesity by Wealth Quintile in Sri Lanka . 2 6 Figure 3.1. Conceptual Framework for the Causes of Undernutrition
Figure 3.2. Rich-Poor Differences in Skilled Assistance at Delivery
Figure 3.3. Rich-Poor Differences in Antenatal Care Use in South and Southeast Asia ... 35 Figure 3.4. Rich-Poor Differences in Vaccination Coverage in South and Southeast Asia ... 35 Figure 3.5. Access to Improved Water Supply and Sanitation by Sector, 2004.. ... 3 7 Figure 3.6. Exclusive Breastfeeding Rates (Infants Aged 0-3 Months) ...
Figure 5.1. Nutrition Stakeholders within the Ministqi of Healthcare and Nu
Figure 6.1. The Vicious Cycle of Poverty and Malnutrition ... 79 Figure 7. I Achieving Sustainable Improvements in Nutrition in Sri Lanka ... I 0 3
roups in Sri Lanka, 1996-2000
... ...
... .... ...
List o f Tables
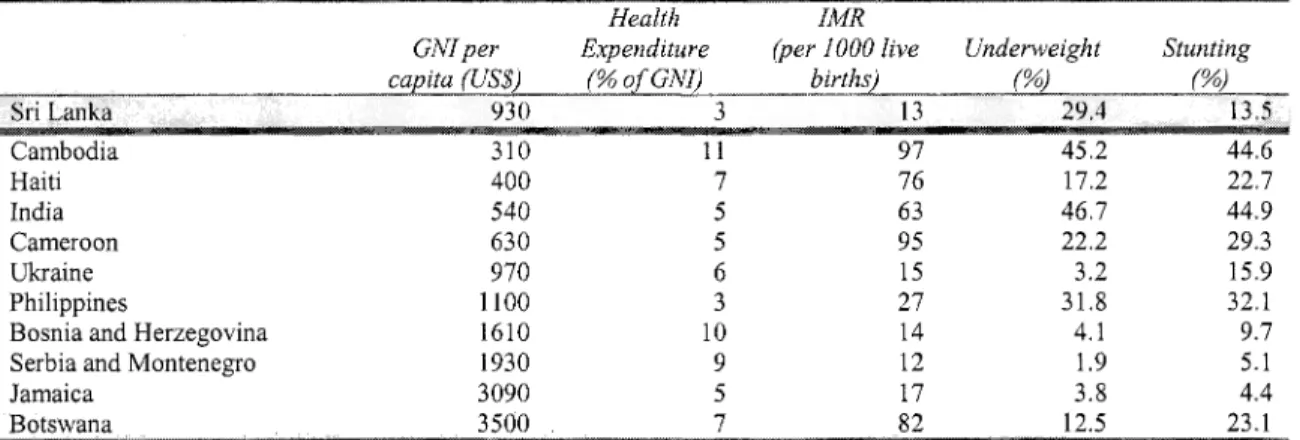
Table 2.2. Health and Nutrition Indicators for South Asia, 2005 ... 8 Table 2.3. International Comparisons of Health and Nutritional Outcomes, Expenditures, and Table 2.4. Prevalence
Group in Sri Lanka ... I 1 Table 2.5. Prevalence and Trends in Undernutrition among Children Aged 0-5 Years, by Gender
in Sri Lanka. ...
Table 2.6. Prevalence of Undernutrition among Children Under Five in Sri Lanka Based on Old and New RHO Growth Standards ...
Table 2.7. IdentiJLing the Public Health Signijkance of Anemia in Countries ... I 8 Table 2.8. Prevalence and Trends in Iron Deficiency Anemia in South Asia.. ... I 9 Table 2.9. Anemia Prevalence among Women and Children by Age Group in Sri Lanka, 2000 .. 20 Table 2. I Public Health SigniJcance of Undernutrition in Sui Lanka.. ... 6
GNP Per Capita ...
Table 2.10. Prevalence of Vitamin A Deficiency in South Asia .... ... 21 Table 2. 11. Prevalence of Iodine Deficiency Disorders in South Asia.. ... .22 Table 2.12 Sri Lanka: The Likelihood of Achieving the Nutrition M D G by 201 5 ... .23 Table 2.13. Prevalence of Overweight among Women 15-49 Years by Zone/Sector in Sui Lanka 26 Table 3.1. Proportion of Population below Minimum Energy Requirement in Sri Lanka ... 32 33 37 Table 3.4. Rates of Child Undernutrition among Children Aged 0-59 Months ing Practices, 2000 ... 39 Table 3.5. Children Exclusively Breastfed for Four Months @j ... 40 Table 3.6. Mother's Education and Caring Practices ... 41 Table 3.7. Marginal Effects of Key Underlying Determinants Estimated from Probit Regressions on the Probability of Low Birthweight, Underweight and Stunting
Table 3.9 Maternal and Child Health and Nutrition Ind
Quintile ... 51 Table 3. 10 Health and Nutrition Indicators by World Region.. ... 52 Table 4. 1. Summary of Direct Food Assistance and Supplementary Feeding Programs ... .60 Table 4.2. Summary of Integrated Maternal and Child Health and Nut
Table 4.3. Vitamin A Supplementation and Iodized Salt Consumption Table 6.1. Burden of Major Nutrition-Related Conditions, ...
Table 6.3. Nutrition-Related Expenditures by Program, Sr
Table 6.4. Nutrition-Related Expenditures by Program, Sri Lanka 2005.. ... 85 Table 6.5. Cost-Effectiveness and Cost-Benefit of Interventions for Protein-Energy Undernutrition in Sri Lanka .... ... 89 Table 6.6 Cost-Effectiveness and Cost-Benefit of Interventions for Micronutrient Deficiencies in Sri Lanka ... 91 Table 6.7 Total Cost, Impact, and Benefits of Interventions for Protein-Energy Malnutrition in Sri Lanka ... 93 Table 6.8. Total Cost, Impact, and Benefits of Interventions ... 94 Table 6.9. Influence of Targeting on Cost-Effectiveness and Cost-Benefit in Sri Lanka ... 95 Table 7.1 Programmatic Options for Mainstreaming Direct Nutrition Interventions through the
Health Sector in Sri Lanka 104
108 Table 3.2. Expenditure and Distribution of Food Expenditure by Sector in Sri Lan
Table 3.3. Access to Improved Water Supply and Sanitation in Countries in Asi
Table 3.8 Poverty Headcount Trends in Sri Lanka" ...
Table 6.2. Burden of Major Nutrition-Related Conditions, ...
Table 7.2 Cost of Scaling-Up Priority Nutrition Interventions in Sri Lanka ....
GLOSSARY
Anemia
B o d y m a s s index (BMI)
Iodine deficiency disorders (IDD)
L o w birthweight Malnutrition
Obesity Overweight
Stunting (measured as height-for-age)
Undernutrition
Underweight
V i t a m i n A deficiency
Wasting (measured by weight-for-height)
Z-score
L o w level o f hemoglobin in the blood, as evidenced by a reduced quality or quantity o f r e d b l o o d cells; 50 percent o f anemia worldwide i s caused by i r o n deficiency.
B o d y weight in kilograms divided by height in meters squared (kgim’). This i s used as an index o f “fatness” among adults. B o t h h i g h BMI (overweight, BMI greater than 2 5 ) and l o w BMI (thinness, BMI less than 18.5) are considered inadequate.
All the ill effects o f iodine deficiency in a population that can b e prevented by ensuring that the population has a n adequate intake o f iodine. The spectrum o f IDD includes goiter, hypothyroidism, impaired mental function, stillbirths, abortions, congenital anomalies, and neurological cretinism.
Birthweight less than 2,500 grams.
Various forms o f poor nutrition caused by a complex array o f factors including dietary inadequacy, infections, and sociocultural factors. B o t h underweight o r stunting and overweight are forms o f malnutrition.
Excessive b o d y fat content; commonly measured by BMI. The international reference for classifying an individual as obese i s a BMI greater than 30.
Excess weight relative to height, commonly measured by BMI among adults (see above). The international reference i s as follows:
25-29.99 for grade I (overweight ) 30-39.99 for grade I1 (obese)
> 40 for grade 111.
F o r children, overweight is measured as weight-for-height two standard deviations above the international reference.
Failure t o reach linear growth potential because o f inadequate nutrition o r p o o r health. I t implies long-term Undernutrition and poor health, measured as height- for-age two standard deviations b e l o w the international reference. Usually a good indicator o f long-term undernutrition among young children. F o r children under 12 months, recumbent length i s used instead o f height.
Poor nutrition: I t m a y occur in association with infection. Three most commonly used indexes for c h i l d undernutrition are length-for-age, weight-for-age, and weight-for-height. F o r adults, undernutrition i s measured by a BMI less than 18.5.
L o w weight-for-age i s t w o standard deviations b e l o w the international reference for weight-for-age. I t implies stunting o r wasting and is an indicator o f Undernutrition.
Tissue concentrations o f vitamin A l o w enough to have adverse health consequences such as increased morbidity and mortality, poor reproductive health, and slowed growth and development, even if there is n o clinical deficiency.
Weight divided by height that i s t w o standard deviations b e l o w the international reference. I t describes a recent or current severe process leading t o significant weight loss, usually a consequence o f acute starvation o r severe disease.
Commonly used as an indicator o f undernutrition among children, especially useful in emergency situations such as famine.
The deviation o f an individual’s value f r o m the median value o f a reference population, divided by the standard deviation o f the reference population.
Background Papers Commissioned for This Report
1. The Epidemiology o f Malnutrition in S r i Lanka. Lidan Du
2. Structural and Ideological Gaps that Affect Nutrition Improvement Programs in Sri Lanka.
N i m a l D. Kasturiaratchi
3. A Review o f Previous and Existing Nutrition Programs in Sri Lanka. Sunethra Atukorala 4. The Economic and Health Impact o f Undernutrition. Dariush Akhavan
5. Multivariate Analysis o f the Causes o f Undernutrition in Sri Lanka. Nistha Sinha
W C E OF iiNDfLWFlGilT IN CIIILDREN
SEVERITY OF MALNUTRITION:
% UNDERWEIGHT CHILDREN <5 YEARS OF AGE __ INTiR'UA7l3NAI BOUNDAi(3FF
I
SEVERITY OF MALNUTRITION:
% STUNTED CHILDREN <5 YEARS OF AGE VERY IIlGti l>.iilr/
Source Repositioning Nutrition, (World Bank 2006).
,2
Nutrition and the MDGs
Goal Nutrition Effect
Goal 1: Eradicate extreme 0 Malnutrition represents the “non-income face o f
poverty and hunger. poverty.”
0 Malnutrition erodes human capital through irreversible and intergenerational effects o n cognitive and physical development.
Goal 2: Achieve universal 0 Malnutrition affects the chances that a child will go t o primary education. school, stay in school, and perform well.
Goal 3: Promote gender 0 Anti-female biases in access to food, health, and care equality and empower women. resources m a y result in malnutrition, possibly reducing
women’s access to assets.
Addressing malnutrition empowers women more than Goal 4: Reduce child 0 Malnutrition i s directly or indirectly associated with most mortality. child deaths and i t i s the major contributor to the
burden o f disease in the developing world.
0 Vitamin A supplementation has the potential to reduce child mortality among deficient populations by as much as 23 percent.
Goal 5: Improve maternal 0 Maternal health i s compromised by malnutrition which i s health. associated with most major risk factors for maternal mortality. Maternal stunting and i r o n and iodine deficiencies particularly pose serious problems.
Goal 6: Combat HIV/AIDS, Malnutrition m a y increase risk o f HIV transmission, malaria, and other diseases. compromise the effectiveness o f antiretroviral therapy, and hasten the onset o f full-blown A I D S and premature death.
0 I t increases the chances o f tuberculosis infection resulting in disease, and it also reduces malarial survival rates.
men.
Source: Updated fkom Repositioning Nutrition (World Bank 2006).
EXECUTIVE SUMMARY
1. The Millennium Development Goals (MDGs) are a set o f eight goals that United Nations’ member countries have committed to reach by 2015. The first MDG i s t o eradicate poverty and hunger. I t s target i s to halve between 1990 and 2015 the proportion o f people living on less than $1 a day (a measure o f income poverty) and the proportion o f people w h o suffer f r o m hunger (a measure o f the non-income face of poverty). The latter i s measured using t w o indicators: the prevalence o f underweight among children under five and the proportion o f the population below a minimum level o f dietary energy consumption.
2. Although undernutrition represents the “non-income face o f poverty,” most global and country assessments focus o n the income poverty target. M o s t countries are o n track to achieve the poverty goal. A recent MDG study concluded that Sri Lanka m a y be among the countries to achieve several o f the health MDGs, and the income poverty MDG under certain conditions, but n o t the non-income poverty target (the “nutrition MDG”). Undernutrition in Sri Lanka i s very high (29 percent underweight), despite the fact that Sri Lanka has better basic health indicators than most countries with comparable incomes. The maternal mortality rate i s 46.9 per 100,000 l i v e births (2001); infant and under-five mortality rates are respectively 13 and 15 per 1,000 live births (2003); and l i f e expectancy at birth i s 73 years (2002). These are exceptional achievements for a country with an income level o f U S $ 9 3 0 per capita (2005).
3. The need to address malnutrition has been recognized by the Government o f Sri Lanka (GOSL). In 1978, a F o o d and Nutrition Policy Planning Division was established at the central level, followed later by a Nutrition Coordination Unit. A recent food and nutrition policy for 2004-1 0 emphasized focusing on the poor and integrating nutrition with other sectoral activities, including health, agriculture, education, economic reform, and rural development. Although the government i s developing a n e w action plan, a coherent programmatic framework i s n o t yet in place.
4. This Analytical and Advisory Activity’s (AAA) original goal was to systematically study the complex nutrition situation in Sri Lanka to accomplish three tasks: (1) I n f o r m the G O S L and development partners (including the W o r l d Bank) about the causes o f the malnutrition enigma and propose strateges to address it; (2) Support the GOSL in preparing an evidence-based programmatic framework to address malnutrition; and (3) Enhance the potential impact o f the Bank’s current investments in Sri Lanka. Limitations in available data prevented a sufficiently precise analysis o f malnutrition’s causality. The team did conduct some exploratory analyses which shed some light on these issues and identify potential strategy options. The epidemiological evidence presented in this paper will be useful for G O S L and partners to develop a programmatic framework and enhance the potential impact o f current and planned investments in Sri Lankan nutrition. Malnutrition prevention strategies span many sectors, and while this study identifies those sectors, it primarily focuses o n developing a programmatic framework for the health sector.
5. The AAA’ report structure i s as follows:
0
Chapter 1 explains the report’s background and rationale.
Chapter 2 documents the levels and trends in Sri Lanka’s malnutrition.
Chapter 3 reviews available data to assess the causes o f undernutrition.
Chapter 4 reviews the characteristics o f past and existing nutrition investments.
Chapter 5 reviews the complex political economy o f nutrition in Sri Lanka.
Chapter 6 explains the costs o f undernutrition-both the costs o f inaction and the costs o f taking action.
Chapter 7 proposes a way forward based o n the reports findings.
6. Sri Lanka i s faced with the double burden of both undernutrition and overweight.
Underweight prevalence i s s t i l l relatively high by global standards (higher than many countries in Sub-Saharan Africa), and Sri Lankan children remain extremely vulnerable during the first t w o critical years o f their lives. At the same time, overweight i s o n the rise, especially among high- income groups.
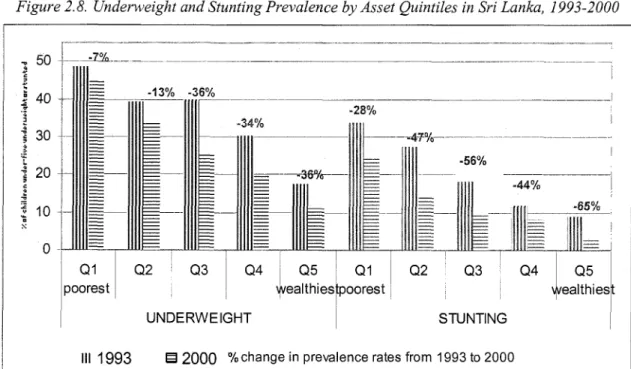
7 . Stunting and underweight rates among children have fallen between 1993 and 2000 (from 38 to 29 percent for underweight and 24 to 14 percent for stunting). However, the rates of decline have been greatest among children in wealthy households and those living in Colombo and other urban areas in the Western Province; the unequal rates of decline have increased existing inequities between the rich and the poor. I n I993, a child from the poorest household was 2.8 times more likely to be underweight than a child from the richest household. By 2000, this ratio had increased to 4. I . Increased inequality in stunting is even greater. I n 1993, a child from the poorest household was 3.7 times more likely to be stunted. By 2000, this ratio had more than doubled to 7.7. Undernutrition rates decline steadily with increasing income. However, undernutrition i s relatively high even in the third and fourth quintiles. Over 11 percent o f children in the highest wealth quintile are underweight, and nearly 20 percent are underweight in the fourth wealth quintile, suggesting that undernutrition continues t o plague even the non-poor.
Poverty analyses show that as poverty has declined in Sri Lanka, most o f the benefits have been concentrated in the Western provinces, leading to a sharp rise in inequities between the Estate sector and other zones/sectors. These important issues need to b e carefully considered when designing publicly funded interventions in Sri Lanka.
8. Maternal undernutrition remains high (23 percent) and i s a likely cause o f child undernutrition; maternal obesity i s increasing at the same time. Inequities are also increasing in this indicator. The difference in the mean B M I (a measure of adult nutrition) between the Estate and urban sectors increased dramatically between I995 and 2000 from 2.8 to 4.5.
9. Micronutrient deficiencies, especially anemia (40-60 percent among women and children), and vitamin A deficiency have been identified as problems o f public health proportion-especially for a country that has done as w e l l in the health sector. Sri Lanka has achieved high levels o f salt iodization (94 percent); the challenge i s t o sustain these high levels.
Collectively, these conditions continue to drain the Sri Lankan economy.
10. Malnutrition includes undernutrition and overweight. Overweight predisposes the population to higher r i s k s o f cardiovascular diseases, diabetes, and other noncommunicable diseases (NCDs). Some research, although inconclusive, suggests that children born with l o w birthweight who show rapid weight gain later in l i f e are more prone to NCDs than those born
11
with normal weight. Although this report focuses on undernutrition, overweight i s identified as an emerging public health problem in Sri Lanka which will impede economic growth i f unaddressed. Over 20 percent of Sri Lankan women are overweight and the trend is increasing.
U n l i k e undernutrition, overweight i s currently concentrated among the relatively well-off.
11. Even with relatively optimistic assumptions about economic growth, i t alone i s insufficient to meet the MDGs. Projected growth rates for Sri Lanka m a y not b e high enough given l o w income elasticities o f undernutrition And because economic growth is not equitable, it is unlikely to benejit those with the worst nutritional outcomes. B o t h economic growth and nutritional improvements have benefited the r i c h households living in urban areas, particularly in the Western province, more than the poor and those living in the Estate areas, increasing inequities sharply. Some evidence indicates that inequalities between ethnic groups are also increasing. Interventions targeted at these disadvantaged population groups are desirable from an equity and health perspective and also from the perspective of better governance, peace, and political stability. Without targeted interventions to reduce inequalities within and among the urban, rural, and Estate sectors, economic growth i s unlikely to have a significant impact on the poor’s nutrition outcomes.
12. Conservative estimates suggest that undernutrition alone costs Sri Lanka over US$ 1. I billion in lost productivity and over 230,000 disability-adjusted life years (DALYs) due to undernutrition-related disability and death. In contrast, the 2005 expenditures on malnutrition- related programs are estimated at a very modest level o f US$ 11.2 million, over one-third o f which i s from government resources and the rest f r o m development partners.
13. M a n y theories have been offered to explain why undernutrition rates remain very high in South Asia compared to Sub-Saharan Africa (the South Asian enigma). These explanations range f r o m the l o w status o f women (and inadequate accesshtilization o f health services and other resources for women and girls), to l o w birthweights, high population densities, and poor sanitation. None o f these theories have been empirically proven, however. The gender argument i s invalid for Sri Lanka since health service utilization and education levels are equally high for b o t h girls and boys. However, poor sanitation and low birthweights are potential explanations for Sui Lanka based on available data presented in this study.
14. Undernutrition in Sri Lanka seems to be rooted in household poverty, although i t also exists among the non-poor. Poor households are energy deficient, lack dietary diversity, and have limited access to clean water and sanitation. Maternal underweight and household wealth status are the most important predictors o f l o w birthweight, which in turn i s the single most important predictor o f child stunting and underweight. These effects are amplified by poor child care and feeding practices during the first t w o years o f life, practices which are even worse among the poor.
15. As is the case in most other countries, undernutrition in Sri Lanka happens in the vevy early years, and often duringpregnancy (leading to low birthweight). This early damage to children ’s cognitive and growth potential is tragically irreversible. Interventions must therefore focus on this window o f opportunity in a child’s life. Health care and access t o safe water and sanitation services potentially protect children f r o m disease and undernutrition. High levels o f access to health care have helped break this vicious cycle by ensuring that childhood illnesses are treated appropriately. However, access to safe water and sanitation and simple primary health care alone (such as oral re-hydration) are inadequate and could exacerbate the impacts o f poverty and poor caring practices on undernutrition.
16. The Government o f Sri Lanka’s current policy response to malnutrition consists o f three broad strategies: direct food assistance programs, poverty reduction programs and the provision o f an integrated package o f maternal and child health and nutrition services through the Ministry o f Healthcare and Nutrition. Smaller programs focused o n behavior change and communication also exist. Other national programs a i m at reducing micronutrient deficiencies through micronutrient supplementation and food fortification.
17. The political discourse in post-colonial S r i Lanka has l e d to divergent views about malnutrition, i t s causes, and potential solutions. Historically, food subsidies, free education and health services, and government employment with social security were the dominant expressions o f social justice in post-independent Sri Lanka. Given this political economy, the policy choices adopted have not always been based on evidence of what works, which has led to several mismatches between policy needs and policy response. For example, the training and skills of health workers focus on a medicalized approach, and success in attaining health goals may have contributed to the adherence to such policies. Similarly, the untargeted food assistanceprograms may be based on social equity arguments rather than evidence of success.
18. Though program evaluation data are very limited, a review o f the design, implementation, coverage, and potential for impact o f the existing programs in Sri Lanka shows that many programs may not have had signiJcant impact for two reasons. Some programs failed to target the most vulnerable groups in the population (for example the food supplementation programs aimed at reducing food insecurity such as Thriposha). Others were under-resourced or ill-equipped to deal with the causes of undernutrition (for example the Maternal and Child Health Program, which has been unable to address inadequate child care and feeding practices).
19. The continuing high rates of undernutrition are evidence that new paradigms and policy shifts are necessary now. An improved policy framework for nutrition would involve food assistance and programs to improve child care but would target the four groups to achieve maximal impact: pre-pregnant, pregnant, and lactating women, and children aged 0-3 years.
This will require b o t h changes in the training and s h l l s o f fi-ont-line workers and program managers, and stronger leadership and political commitment at the highest levels in Sri Lanka.
The health sector has followed a medicalized approach combined with hand-outs o f supplementary food, a legacy f r o m the social justice era and an unfortunate mismatch.
Nevertheless, with the tremendously successful improvements in infant and maternal mortality rates in recent years, the health system is nowpoised to maximize a new opportunity to redirect its focus on nutrition. This institutional and political opportunity must be seized.
20. In defining the way forward, Sri Lanka needs to focus on three k e y changes to appropriately address malnutrition: (a) Finance a technically correct set o f strategieshterventions in an economically justifiable formulation to maximize cost-effectiveness; (b) Ensure a high level o f political commitment t o sustain these actions; and (c) Identify the appropriate institutional arrangements and develop necessary capacities in these institutions. This study addresses the f i r s t issue in some detail. I t also touches o n the other t w o issues, but suggests additional strategizing to sustain political commitment and to identify details for institutional arrangements.
2 1. The study identifies seven k e y next steps for G O S L and i t s development partners:
sectors. These efforts must focus o n four key issues: (a) Poverty reduction strategies, specijkally designed to reduce income inequalities; (b) Strategies to improve access to safe water and
0 Addressing undernutrition in Sri Lanka will require sustained efforts f r o m multiple
i v
sanitation (and good hygiene behaviors): (c) Strategies to reduce food insecurity, especially among the poor in the Estate sector and in rural are;, and (d) Strategies to scale-up direct nutrition interventions in the health sector to fast track achieving the nutrition MDG. These multisectoral inputs need to be coordinated through a National Nutrition Coordination Committee under the prime minister’s office with members f r o m relevant ministries, a clear mandate, and a budget to achieve it.
0 Complementary strategies to reduce poverty or to improve access to safe water and sanitation must be specijkally designed to reduce inequalities. Improvements at an aggregate level are insufficient to advance nutrition outcomes in Sri Lanka or to achieve the lagging nutrition MDG. Follow-on w o r k i s needed to design such strategies, including potential demand- side innovations such as conditional cash transfers and conditional food transfers which can be implemented as part o f community-driven development programs.
0 While food assistance programs can act as a social safety net to mitigate the effects o f income poverty, the existing food assistance and food supplementation programs must b e reviewed through follow-on w o r k to outline specijk next steps for geographic, poverty and age targeting to improve their cost-effectiveness and potential for impact o n nutrition. The cost effectiveness o f the Thnposha program, for example, can vary f r o m a l o w o f 9.6 in the metropolitan Colombo area to a high o f 23.2 in the Estate sector. The potential for linking some o f these food programs with community-driven development programs needs to b e explored.
0 For the Estate sector, a special strategy must be implemented to address the high levels of undernutrition. This strategy should focus o n the following k e y issues: (a) Transfer the delivery o f basic social services (including health and nutrition) f r o m the Plantation Human Development Trust to the provincial government in consultation with the line ministry; (b) D e s i g n poverty reduction strategies to specifically address the inequities in the Estates; (c) Scale- up the lessons f r o m the Early Childhood Care and Development Project to increase community participation and utilization o f health and nutrition services among estate workers; and (d) Prioritize the delivery and quality o f priority services (list outlined under Option A in Table 7.2) to populations in the Estate sector.
0 In the medium- t o short-term, Sri Lanka will benefit f r o m scaling-up a select set of very carefully targeted direct nutrition interventions via the health sector. Three options are presented in the study for scaling-up a nutrition package through Sri Lanka ’s health sector, starting with a very basic intervention package targeted to maximize cost-effectiveness and the potential for impact. The proposed package options a i m to strengthen information, education, and communication programs targeted to the entire population. Enhanced knowledge and iizformation w i l l likely suffice to improve nutrition outcomes among the non-poor, conserving larger public resources to target the poor with more resource-intensive direct nutrition interventions such as anemia control and targeted supplementary feeding for the poor.
Operationalizing these recommendations through the health sector will require an investment o f at least US$ 20 m i l l i o n annually, plus costs to develop institutional capacity, monitor and evaluate, and to sustain political will. G O S L needs to adapt and adopt such a programmatic framework for the health sector (with a special strategy for the Estate sector), and development partners need to support the GOSL’s plan.
0 Whatever G O S L adopts as the final combination o f interventiondstrategies, they must include a strong monitoring and evaluation component to help identify what strategies are working and which m a y need mid-course corrections. Identifying and documenting the more
successful strategies will further strengthen political commitment for the right interventions and sustain these programs.
0 The following additional studies should be conducted with support from development partners and the W o r l d Bank: design o f poverty reduction strategies to reduce inequities; redesign food assistance programs so they are better targeted and more cost-effective; follow-on w o r k for the integration o f nutrition interventions in to health sector strategies; and additional analyses on the costs, causes, and strategies to address the emerging epidemic o f overweight. In addition, further surveys and studies are needed to strengthen causal inferences about the continuing enigma o f malnutrition in Sri Lanka.
vi
1. INTRODUCTION
This chapter explains the rationale for undertaking an analysis of malnutrition in Sri Lanka and outlines the report’s structure.
1.1. RATIONALE
The Millennium Development Goals (MDGs) are a set o f eight goals which United Nations’
member countries are committed to reach by 2015. The f i r s t MDG i s to eradicate poverty and hunger. I t s target i s to halve between 1990 and 2015 the proportion o f people living on less than
$1 a day (a measure o f income poverty) and the proportion o f people suffering from hunger (a measure o f the non-income face o f poverty). The latter i s measured using two indicators: the prevalence o f underweight among children under five and the proportion o f the population below a minimum level o f dietary energy consumption.
Though undernutrition represents the “non-income face o f poverty,” (Repositioning Nutrition, World Bank 2006) most global and country reports assessing progress toward the MDGs focus on the income poverty target and conclude that most countries are on track to achieve the poverty goal. The MDG report indicated that S r i Lanka may be among those countries that will achieve several o f the health MDGs and under certain conditions,’ potentially the income poverty MDG.
It will not, however, reach the non-income poverty target (also referred to as the “nutrition MDG”).
A recent report, “Attaining the Millennium Development Goals in S r i Lanka, ” notes that child undernutrition in S r i Lanka i s very high despite S r i Lanka’s basic health indicators, which are better than most countries with comparable per capita incomes. The maternal mortality rate i s 46.9 per 100,000 live births (2001); infant (under one year o f age) and under-five mortality rates in S r i Lanka are respectively 13 and 15 per 1,000 live births (2003); and l i f e expectancy at birth i s 73 years (2002). These are exceptional achievements for a country with a per capita income level o f US$ 930 ( W D I 2005). However, Sri Lanka faces an unfinished agenda o f undernutrition.
Underweight and stunting rates among children aged 0-5 years are respectively 29 percent and 14 percent. These are much higher rates than those reported for countries with lower gross national product (GNP) per capita. A key underlying factor for these high rates i s maternal undernutrition,
The MDG report’s simulation predicted that Sri Lanka attainment o f the poverty MDG i s plausible but only if the country maintains “strong economic growth, continued expansion o f male and female schooling, sustained improvement in infrastructure (particularly electricity coverage), and prevents income and consumption inequality f?om rising, in the years ahead.”