May 12, 2009
Document of the World Bank
Report No. 48968-LK Sri Lanka Agricultur al Commer cialization
Report No. 48968-LK
Sri Lanka
Agricultural Commercialization
Improving Farmers’ Incomes in the Poorest Regions
Poverty Reduction and Economic Management Sector Unit South Asia Region
Public Disclosure Authorized Public Disclosure Authorized Public Disclosure Authorized Public Disclosure Authorized
TABLE OF C O N T E N T S FOREWORD
EXECUTIVE SUMMARY ... i
1 . INTRODUCTION ... 1
2 . THE POVERTY. GROWTH AND AGRICULTURE NEXUS ... 8
3 . GOVERNMENT POLICIES AND PROGRAMS ... 13
3.1. AGRICULTURAL POLICIES ... 1 3 3.2. LAND TENURE POLICY ... 15
3.3. AGRICULTURAL TARIFFS ... 1 6 3.4. OTHER POLICY ISSUES ... 16
3.5. 4 . FUNDING FOR AGRICULTURE IN THE MAHINDA CHINTANA ... 17
MARKET TRENDS AND SUPPLY CONSTRAINTS ... 19
4.1. MARKETTRENDS ... 19
4.2. SUPPLY CONSTRAINTS: MESSAGES FROM STAKEHOLDER CONSULTATIONS ... 21
5 . VALUE CHAIN ANALYSIS OF MAIZE. MILK. AND VEGETABLES ... 23
5.1. SEGMENTS OF RURAL SRI LANKA ... 2 4 5.2. MARKET PROSPECTS FOR MAIZE, MILK AND VEGETABLES ... 2 6 5.3. COMPETITIVENESS AND PROFITABILITY ... 3 0 5.4 STRENGTHENING PRODUCT SPECIFIC VALUE CHAINS ... 33
6 . POLICY OPTIONS FOR STRENGTHENING COMMERCIALIZATION OF AGRICULTURE ... 36
6.1. IMPROVING PRODUCTION TECHNOLOGY ... 3 6 6.2. STRENGTHENING MARKET LINKAGES ... 3 7 6.3. IMPROVING ACCESS TO FINANCE ... 40
6.4 IMPROVING LAND MARKETS ... 4 1 IMPORTANCE OF MAIZE, MILK AND VEGETABLES FOR THE POOREST POPULATION 7 . CONCLUSIONS AND SUMMING UP ... 43
ANNEX 1: AGRICULTURAL RESOURCES ... 45
ANNEX 2: K E Y GOVERNMENT POLICIES IN THE MILK, MAIZE AND VEGETABLE SUB-SECTORS ... 48
ANNEX 3: RATIONALE FOR THE CHOICE OF AGRICULTURAL PRODUCTS FOR THE STUDY ... 50
Boxes Box 1 : Product Specific Recommendations ... v i i Box 4 . Considerations for Investments in Agricultural Market Infrastructure ... 40
Box 2: Agro-Ecological Zones in Sri Lanka ... 9
Box 3 : K e y Reasons for the Selection o f the Three Specific Products ... 24
Figures
Figure 1 : Real GDP Growth-Western Province vs . Rest of the Country ... - 1
Figure 2: GDP Per Capita by Province, 2006 ... 2
Figure 3: The Western Province’s Share o f Total National GDP ... 2
Figure 4: Number o f Draft Animals Per Agricultural Household ... 11
Figure 5: Distribution o f Plot Sizes ... 1 ... 15
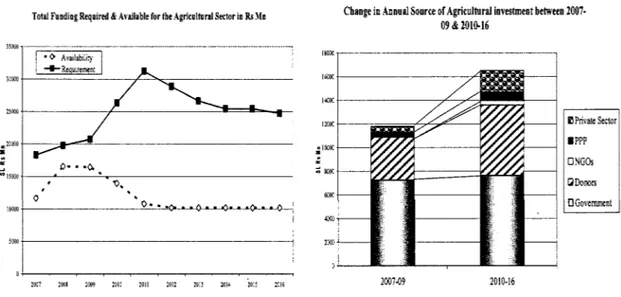
Figure 6: Agricultural Investment . Requirements ... 17
... 17
Figure 8: Food Expenditure by Income Quintile and Product Group ... 20
Figure 9: International Prices for Maize & Milk Powder ... 21
Figure 10: Geographical Distribution o f National Milk Herd ... 25
Figure 11: Percentage o f National Milk Herd by Holding Size ... 25
Figures 12a and 12b: Districts in Uva and Sabaragamuwa, by Accessibility and Vegetable Cultivation.26 Figure 13: Maize Production I s Flat While Imports Have Boomed ... 26
Figure 14 . Vegetables: Typical Costs and Returns in Colombo Wholesale Market ... -29
Figure 15 . Maize: Typical Costs and Returns Using Traditional Seed ... -31
Figure 16 . Maize: Typical Costs and Returns Using F 1 Seed ... 31
Figure 17 . Producers’ Costs for Milk, 2005 ... 31
Figure 18 . Impact on N e t Return o f Change in Producer Prices o f Vegetables ... 32
Figure 7: Expected Sources o f Future Funding Tables Table 1 : Policy Options for Strengthening Commercialization o f Agriculture ... v i Table 2: Poverty Head Count Index (1995/96-2006/07) ... 3
Table 3 : Human Capital Indicators by Province 2003 ... 4
Table 4: Provincial Access to Economic Infrastructure ... 5
Table 5: Agriculture’s Share in Provincial GDP ... 5
Table 6: Average Annual Real GDP Growth, 1996-2005 ... 8
Table 7: Composition o f Agricultural GDP, 2002-2008 ... 9
Table 8: Rural Household Distribution and Poverty Rates by Sector and Province, 2002 ... 10
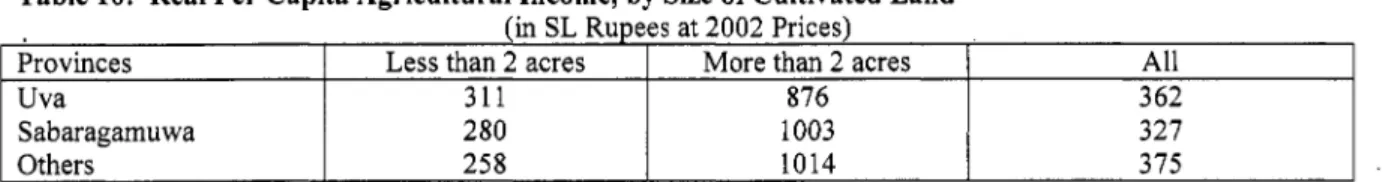
Table 9: Poverty Rates, by Cultivation o f Major Crops in Uva, Sabaragamuwa and Western Provinces . 1 1 Table 10: Real Per Capita Agricultural Income, by Size o f Cultivated Land ... 12
Table 1 1 : Poverty Rates (%), by Size o f Cultivated Land ... 12
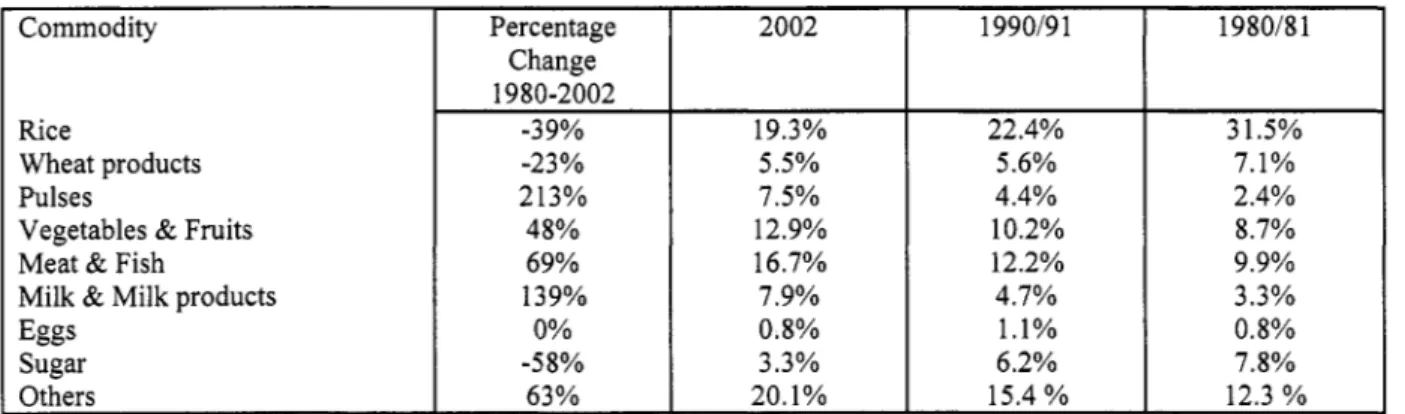
Table 12: Composition o f Household Food Expenditure ... 20
Table 13: Market Response to Maize Opportunities ... 28
Table 14: Maize: Import and Farm Gate Prices ... 30
Table 15: Policy Options to Develop the Maize Sub-sector ... 33
Table 16: Recommended Interventions to Develop the Milk Sub-sector ... 34
Table 17: Recommended Interventions to Develop the Lowland Vegetable Sub-sector ... 3 5
Foreword
The fundamental rationale for focusing policy research on agriculture i s that the majority o f poor people in Sri Lanka live in rural areas where agriculture i s the mainstay o f economic activity. Also, globally, as the World Development Report 2008 documents, GDP growth originating in agriculture can be at least twice as effective in reducing poverty as GDP growth originating outside o f agriculture.
By focusing on a few selected products-maize, milk and vegetables-and carefully analyzing the value chain in these sub-sectors, from farmers to wholesalers, this report attempts to draw out some general lessons about the key constraints to increased commercialization o f Sri Lankan agriculture. The report i s part o f a broader research program on spatial differences in economic development in Sri Lanka, and it will be followed by another report that will more deeply explore issues related. to spatial economic integration. This report also provides an analytical foundation and a basis for dialogue for a possible World Bank agricultural lending operation to strengthen the market orientation o f the agricultural sector in Sri Lanka.
The work on this report drew on a practical, bottom up approach to best take into account the local conditions. This involved extensive consultations with national and local government representatives, farmer representatives, members o f the local agribusiness sector, and representatives from
Ithe regional chambers o f commerce. The consultations focused on determining the main constraints to and opportunities for increasing farmers’ incomes, as perceived by local stakeholders.
The following people contributed to the report: Grahame Dixie (SASDA), Terrence Abeysekera (SASDA), Chai Happugale (consultant), Kirthisri Wijeweera (SASEP), and Nobou Yoshida (SASEP).
Preparation o f the report was initially led by Rocio Castro (SASEP). Paul Wade (SASEP) and Claus
Astrup (SASEP) led the completion o f the report.
SRI LANKA: AGRICULTURAL COMMERCIALIZATION--IMPROVING FARMERS’ INCOMES IN THE POOREST REGIONS
EXECUTIVE SUMMARY
1. The issue of regional differences has moved to the center o f the development debate in Sri Lanka. For the past many years, there have been significant and increasing differences between the Western Province on one side and all other provinces on the other side in terms o f per capita income levels, growth rates o f per capita income, poverty rates, and the structure o f provincial economies. This issue i s important for S r i Lanka’s inclusive-growth agenda because a large majority (about 71 percent) o f the country’s population lives outside the Western Province. There are concerns that failing to bring the lower-income provinces along in the country’s economic development could result in further income disparities that might add to social tensions and create obstacles to Sri Lanka’s future growth. Reflecting that these socio-economic differences have become increasingly clear in recent years, the Government emphasizes in i t s 10-year Development Framework, the Mahinda Chintana (2006), the need to reduce regional disparities through the implementation o f pro-poor growth strategies. The Mahindu Chintana also emphasizes the need to accelerate economic growth from the historical average o f 5 percent to around 8 percent a year. This will require the attainment o f substantially higher growth rates outside the Western Province.
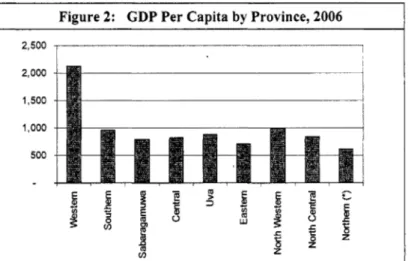
2. The Western Province has been the fastest growing region in S r i Lanka during the last decade, with an average annual real GDP growth o f 6.2 percent from 1997-2006. The rest o f the country, in comparison, grew by just 2.3 percent annually during the same period. Consequently, there are significant differences in GDP per capita between the Western Province and the rest o f the country. In 2006, GDP per capita in the Western Province exceeded US$ 2000 and was more than double that o f any other province. In parallel, the Western Province’s share in national GDP also increased steadily and has, in recent years, hovered around 50 percent o f Sri Lanka’s entire production o f goods and services. The other eight provinces-which together have two-and-a-half times the population o f the Western Province-share the remaining 50 percent o f economic activity amongst themselves.
3. These uneven growth outcomes are associated with uneven poverty outcomes. In 2006107, the poverty incidence (head count index) in the Western Province was 8 percent. With the exception of the Eastern Province’, the incidence o f poverty in all other provinces was substantially higher (ranging between 14 and 27 percent). Furthermore, the incidence o f poverty in rural areas i s nearly double that in urban areas. In 2006/07, the urban poor accounted for 7 percent o f the nation’s poor, the rural poor for 82 percent and the estate poor for 11 percent.
4. The majority o f the poor lives in rural areas and depends on agriculture for their food and livelihoods. U v a and Sabaragamuwa are the provinces with the highest incidence o f poverty. In these provinces, more than 80 percent o f both the population and the poor live in rural areas, with the vast majority o f households depending on income from agriculture.
’ The 2006/07 Household and Income Expenditure Survey (HIES) was the first to include information on the
5. I n order to address regional development issues in S r i Lanka it is necessary to address the development o f agriculture, given the substantial role the agricultural sector plays in the poorest provinces. Agriculture stands for a significant share o f value-added, employment and the share of households dependent on income from the sector. Poverty among households dependent on agriculture i s especially high, particularly in provinces with the highest incidence o f poverty. Also, as argued in the World Development Report 2008, increased agriculture income i s often more effective in eliminating poverty than increased income from other sources. More broadly, the usual transformation o f an economy in a dynamic growth process--shifting from a rural-based, agricultural economy to an urban-based economy--has so far happened only slowly outside the Western Province. Achieving higher growth in agricultural productivity i s a necessary part o f economic transformation; it i s the only way for the agricultural sector to release labor to other, higher-value-added sectors, while maintaining at least modest growth in rural/agricultural household incomes.
6. The focus o f this report on raising farmers’ incomes in the poorest provinces i s consistent with the Mahinda Chintana National Ten-Year Development Plan. To diminish regional disparities, the Mahinda Chintana advocates that Government policies stimulate economic growth by especially enhancing and expanding livelihood options in the regions where most o f Sri Lanka’s poor inhabitants live. The agricultural section of the Mahinda Chintana explicitly recognizes the need for greater private sector involvement in agriculture research and development and extension services. It also seeks the full participation o f community-based organizations in helping to transform subsistence agriculture into highly productive systems with linkages to agro-based industries. However, the Plan i s less specific as to how these partnerships with the private sector are going to be translated into policy and action.2 Thus, there i s a gap in the policy portfolio, related to how private sector investment in production and market infrastructure and sourcing raw materials from poor regions can be facilitated.
7. This report has three main objectives:
0
The first obiective i s to improve the understanding o f the poverty and agriculture nexus in Sri Lanka’s poorest regions (in particular Uva and Sabaragamuwa which show the highest recorded poverty levels in all surveys carried out in the past de~ade)~. I t should be emphasized, though, that the report does not attempt to analyze why poverty in Sri Lanka, including in Uva and Sabaragamuwa, declined significantly between 200 1/02 and 2006/07. Answering this question would, among other things, require detailed analysis o f the two rounds o f Household Income and Expenditure Surveys (HEIS) and, thus, require waiting for the Department o f Statistics to make the latest surveys available.
The second obiective i s to analyze the constraints for improving commercialization and profitability in the agriculture sector, based on the study o f a few select agricultural products. By focusing explicitly on agriculture commercialization and profitability, the report complements other World Bank studies-both previous and on-going-n the cross-cutting issues that are holding back growth in agriculture. These include inter alia the 2003 World Bank report on Promoting Agricultural and Rural Non-farm Sector Growth, from which a number o f conclusions remain valid today.
0
Finally, the third objective i s to provide a set o f practical policy options to address the constraints facing agricultural producers in terms o f commercialization and profitability.
I t should be noted that the Government does provide a number o f tax-based incentives to agri-businesses, targeting export The Northern and Eastern provinces are considered economically disadvantaged as they have borne the brunt o f the past three oriented production.
decades o f conflict. However, data availability for the Northern and Eastern Provinces i s generally poor, precluding detailed
analysis.
As such, the report i s intended to provide an analytical foundation and a basis for dialogue for possible donor support to strengthen the market orientation o f the agricultural sector in Sri Lanka.
8. I t should be noted that this report i s part o f a programmatic research program on spatial differences in economic development and social welfare in Sri Lanka. As such, this report will be followed by another report focusing on spatial economic integration in S r i Lanka. The latter will explore, in greater depth, more broader issues related to spatial economic integration, including the challenge o f managing the tension between the forces o f economic concentration and maintaining relative spatial uniformity in standards o f living.
9. The key analytical tool.employed in the report i s a value chain analysis o f three specific agriculture products, namely maize, milk and vegetables. The value chain analysis includes an assessment o f market prospects, competitiveness and potential enterprise profitability, as a basis for recommending interventions that will likely create sustainable and profitable opportunities for poor farmers. A key question that the analysis attempts to address is: What are the factors inhibiting the enhanced commercialization o f the three chosen products? The starting point for the value chain analysis was an agricultural ‘resource audit’ o f small-scale farmers in the poorest regions to analyze production, poverty and market data4. This was followed by an assessment o f income opportunities from the selected agricultural products, and identification o f product-specific constraints and gaps in the current policy portfolio that may be preventing this potential from materializing.’
10. The value chain analysis was complemented by extensive consultations with stakeholders.
The overall purpose o f these consultations, besides seeking validation o f the initial findings, was to elicit informed local opinions on the key constraints restricting farmer incomes, interventions that could help alleviate rural poverty, and the local resources (enterprises, skills, production capacities, etc.) that would best help enhance rural livelihoods. This approach would enable policy options to focus primarily on enhancing the profitability o f agricultural activities that are, or could be, significant sources o f income for poorer farmers. Stakeholder consultations were held in four provinces-Uva, Sabaragamuwa, and the Northern and Eastern provinces. A number o f meetings were held with farmer groups, farmer representatives, and the private sector (including local chambers o f commerce), besides local Government officials and managers o f projects that target the rural sector in the regions. The draft findings o f the report were also discussed at a workshop held in Colombo in June 2008, with braad stakeholder participation6.
11. Although the study may ignore some general issues due to its focus on a limited number of agricultural products, the approach used has the advantage of being based on data that reflects the actual situation in the sub-sectors discussed in the report. Moreover, experiences from elsewhere suggest that a narrow focus enables the analysis to better crystallize critical constraints and policy options.
It should also be emphasized that although maize, milk and vegetables were chosen for focused study, their selection does not imply that these products are the only ones with potential or necessarily have the best prospects. What are more important are the processes and techniques used to evaluate the value chains o f the individual products, assess the scale o f their prospects and identify the alternative entry points for interventions. Finally, while paddy and plantations crops (tea, rubber and coconuts) are, in
The initial identification o f broader constraints also relied on the World Bank’s 2005 Rural and Urban Investment Climate
Assessment (ICA) for provincial data and usefV insights into the constraints urban and rural firms face in doing business in Sri
Lanka.
many ways, the mainstay o f S r i Lankan agriculture, these crops were not included in the present study for a couple of reasons--these crops have already been the topic o f several studies and diversification is a key challenge for Sri Lankan agriculture. Therefore, from this perspective, an analysis o f somewhat untraditional products i s more valuable.
12.
value chain analysis:
There are two main reasons for choosing maize, milk and vegetables as the products for the
0
First, they are particularly important in the poorest regions of Sri Lanka and if their profitability i s increased the products can be expected to have a particularly strong impact on poverty reduction.
Maize i s primarily cropped by dry land farmers in Uva and the Eastern Province (together these two provinces account for 60 percent o f the national maize production). With respect to milk, around 40 percent of the national cattle herd i s concentrated in Uva, the North and the East.
Finally, vegetables (specifically, lowland tropical vegetables) were chosen because they are typically associated with poorer producers and are a popular crop diversification option.
0
Second, the projected market demand for two of the products (milk and maize) i s positive, and for the third, vegetables, profitability could be significantly improved by pro-market policies. For instance, in the case of maize the market prospects have been significantly stimulated through the increases in prices (that is, around 50 percent above typical international prices, in the mid- 2000s); the crop offers the potential o f an increase in net returns for domestic maize farmers to the tune o f about SLRs 1 billion annually and the prospects o f an annual increase in demand o f about 5 percent per annum over time. This reflects the increase in demand for maize as feed for the expanding S r i Lankan poultry industry-a demand that was hitherto mostly met by imports.
For milk, the market prospect was stimulated by price surges for imported milk powder o f 60 percent above the typical prices in the first half of the decade, and has been bolstered by the long- term trend, brought on by higher incomes, towards a higher share o f dairy products in people’s diets. The strong market prospects of milk have generated interest from the private sector, suggesting that domestic milk production can become competitive vis-a-vis imported milk powder and capture a substantial market share from milk imports that now amount to about SLRs 13 billion per annum. Finally, while market prospects for lowland vegetables are not as strong as for maize and milk, there i s still good potential for improvement and increased incomes for domestic farmers, primarily through better prices that can be achieved by improved market access. Vegetables also continue to remain the single largest contributor to agricultural GDP in S r i Lanka, making up 20.7 percent o f real agricultural GDP in 2007.
13.
main constraints to enhanced commercialization and profitability in Sri Lankan agriculture:
The value chain analysis and stakeholder consultations identified four issues as being the
0
First, the value chain analysis revealed inefficient production technologies. Poor producers
receive little in the way of technical support. This i s partly due to the weak agricultural extension
services and research system. Crop yields and production efficiency could be much higher if
farmers had better access to inputs and improved production technologies--for instance, in the
case o f maize, new seed varieties can more than double maize crop yields. On-farm drying
techniques reduce maize moisture content to acceptable levels but the seed mills need to be
developed and disseminated. In the case of milk, production per cow would increase substantially
with improved ‘milking herd germplasm’ through sustainable artificial insemination systems
delivering elite semen. Finally, for vegetables, extension services to facilitate the extension of the
growing season and limit the current strong seasonal pattern in production and prices would help
increase farm profitability significantly.
0
Second, farmers in the poorer provinces in particular have weak linkages to markets. Weak market linkages are the result o f a confluence o f factors. They include poor public infrastructure, in particular roads’. The lack o f ‘last-mile connectivity’ to farms-Le. road connection all the way to the farms-was identified as a particular acute issue. Moreover, poor supply chain infrastructure i s a key barrier to accessing markets-the number of storage facilities i s extremely limited (a particular problem for highly perishable products like milk) and there i s an absence of central collection points that would enable farmers to better benefit from the economies o f scale in distribution. Also, there i s a lack of adequate rural wholesale markets where produce can be aggregated into larger volumes, contributing to low farm gate prices. Lack of aggregation does not allow economy o f scales for wholesale purchase of produce and trucking to urban centers.
This leaves the farmers with no option but to sell separately to middlemen (or collectors) whose margins amount to a high share o f the farm gate price (for example, 45 percent in the case of lowland vegetables). A proportion o f this margin could become available to producers (and improve farm profitability substantially) if rural primary wholesale markets can be developed to attract larger-scale buyers and agribusiness by virtue o f the quality and quantity o f products available. Finally, market linkages are also weak because farmers have incomplete information about the supply and demand (and, consequently, inefficient market clearing prices) o f agricultural products. For the most part, farmers are ignored by agribusinesses’; this means there i s a significant need and potential for developing ‘marketing extension’ services to help them link up with the markets, tap into market information and make their production more consumer- oriented.
’
0
Third, access to finance i s a serious constraint for farmers and prevents them from making productivity-enhancing investments. Farmers largely depend on microfinance institutions, rural cooperatives, and regional development banks. The two State commercial banks and a few private banks also extend financing to small farmers but mainly through Government-sponsored programs. Small farmers also borrow from input suppliers and traders, and go to money-lenders to manage unforeseen liquidity constraints. The practice o f leasing agricultural machinery i s also underutilized. From the farmers’ perspective, the main problems in terms o f access to finance include inadequate access to term finance, limited suppliers’ credit, cumbersome paperwork, and strict collateral requirements. The constraints on the part of commercial finance institutions include high transaction costs (in part because remote clients are difficult to service), lack of tangible security, and high repayment risk due to poor supply chains and marketing linkages.
0
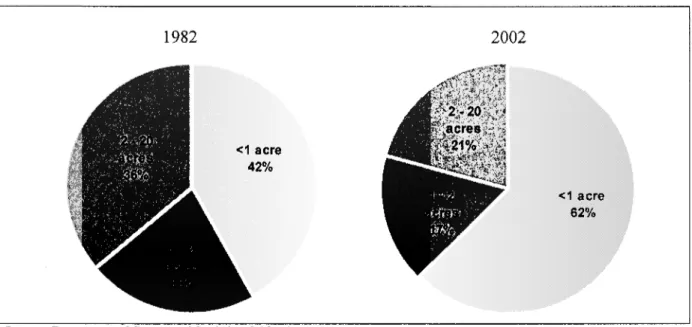
Fourth, a trend towards decreased sizes in agricultural land plots i s a cross-cutting issue that limits the commercialization o f agriculture in S r i Lanka. In 2002, 62 percent of all agricultural land plots were less than one acre in size. Two decades earlier, in 1982, this share was only 42 percent, suggesting a rapid fragmentation of agricultural lands. Moreover, since the Government owns the vast majority of all land, it cannot be used as collateral to access credit.
The combined effect o f these issues i s that the farmers’ incentives and capacity to make
productivity-enhancing investments are greatly reduced. In the medium-term, policy and
regulatory restrictions on buying and leasing land need to be removed and new policies to give
farmers full and transferable ownership rights to land should be introduced. The Land
Development Ordinance (LDO), which regulates the allocation of agricultural land, i s currently in
the process o f being amended to resolve some o f these issues.
14. The results o f the analysis in this report point to two sets o f policy options, namely general policy options that are o f relevance to the broader agriculture sector and policy options for the three specific products that have been studied in the value chain analysis. The former set o f policy options i s summarized in Table 1 and the latter in Box 1:
Challenge Issues Public Investments Policy Environment
Improving the extension system
Strengthening awareness of and demand for improved technology Bringing in the private sector
ImDrove Production Technoloev
Research and extension in Sri Lanka remains largely supply-driven and i s defined in a top-down manner Lack of consistent quality;
quality i s necessary for
commercialization enhancements and safety
Research and extension
toimprove links to their ultimate clients by more strongly involving them in setting agricultural priorities; possible introduction o f user fees.
Establish grades and standards Support farmer training on good
practices for quality High degree o f
fragmentation among Government entities;
poor focus on concrete, useful outputs;
low institutional capacity
Improving rural roads
infrastructure Aggregation of production
volumes and improved integration with agribusinesses Strengthening market in formation systems
Create a limited number o f mission-oriented innovation programs;
build capacity building in selected institutions with proven potential
Small production volumes increase marketing
costsand undermine producers’
abilities to integrate with agribusinesses
Farmers not well informed about changes in demand, availability o f inputs at the best prices, and other information that i s critical for well-functioning markets
Strengthening, or alternatively replacing, the existing Council for Agricultural Research Policy (CARP);
creating Provincial Agricultural Innovation Councils
Promote innovative modes offinancing
Absence of contract
financing and warehouse design and management; train resolutions receipt financing for
example
Train purchasers in contract farmers on rights and obligations
Strengthen institutions for dispute
Strengthen land tenure
Improve flexibility of land use
engthen .Market Linkages Selected rural roads upgrading
Matching grant support for selected supply chain infrastructure
Limited private land Reorganization of existing land
ownership administration agencies; and awareness campaign and investments in computerized land
tenure recording systems
Implementation o f a communication establishment of procedures necessary to formalize the change;
create a comprehensive regulatory (legal and procedural) framework for effective land titling
Remove the existing provision that requires paddy farmers to obtain permission from the Commissioner of Agrarian Services to shift to other crops in designated paddy lands
Designated paddy land cannot be used for alternative crops
Investments in market places to increase transparency and efficiency of wholesale markets;
support enhanced use o f communication technology
Strengthen system for maintenance
Supporting establishment of producer groups-for example, around compact collection routes for milk producers
Strengthening of commodity exchanges
Box 1: Product Specific Recommendations
The product-specific recommendations fall into two sub-categories: ‘within’ farm improvements of technology and production processes, and ‘between’ farm improvements to improve coordination and facilitate economies of scale.
The key ‘within’ farm recommendations for the sector include development of on-farm drying techniques to reduce moisture content to below 14 percent (without smoke contamination) and enhanced farmer training in maize agronomy, with a particular emphasis on expanding the use of F1 seeds. For the & sector, the recommendations to increase productivity include genetically improving the milk herds, for example through artificial insemination, and improving feed, fodder and pasture practices. Finally, for vegetables, the ‘within’ farm recommendations are to improve production techniques and help extend the growing season, and to improve long-terms storing techniques to minimize the vast seasonal fluctuations in prices.
‘Between’ farm recommendations for the maize sector include the creation of organized producer groups (for example, a maize industry association), to better integrate the value chain, in particular improving the business linkages with major feed mills.
There i s also a need to rationalize maize collection points and perhaps develop shared drying facilities. For the milk sector, i t i s critical to form village societies around compact milk routes to reduce collection costs, and-in view of the relatively high capital costs-improve the provision o f shared market structures like bulk chillers, collection centers and automatic quality testing equipment. For vegetables, i t i s necessary to improve marketing extension so that producers better understand the market and consider alternative marketing options. There i s also a need to improve rural market infrastructure as has happened, for example, in Dambulla, where the vegetable market has greatly facilitated the integration of the value chain.
Finally, across all the three products, ways of creating incentives for agribusinesses to operate in poorer regions and make
targeted investments that enable farmer groups to participate in modern agricultural supply chains should be considered.
1. INTRODUCTION
I
1. The issue o f regional differences in development has moved to the center o f the development debate in Sri Lanka, partly after the release o f regional poverty data.’ For the past many years, there have been significant and increasing differences between the Western Province and the rest o f the country” in terms o f per capita income levels, growth rates o f per capita income, poverty rates, and the structure o f provincial economies. This issue i s important in Sri Lanka’s inclusive-growth agenda because a large majority (about 71 percent) o f Sri Lanka’s population lives outside the Western Province. There are concerns that failing to bring the lower-income provinces along in the country’s economic development could result in further income disparities that might add to social tensions. There are also concerns that these inequalities could create obstacles to Sri Lanka’s future growth. Reflecting that the socio-economic differences have become increasingly significant in recent years, the Government emphasizes in i t s 1 0-year Development Framework, the Mahinda Chintana (Department o f National Planning, 2006), the need to reduce regional disparities through the implementation o f pro-poor growth strategies. The Mahinda Chintana also emphasizes the need to accelerate economic growth from the historical average o f 5 percent to around 8 percent a year, which will require the attainment o f substantially higher growth rates outside o f the Western Province.
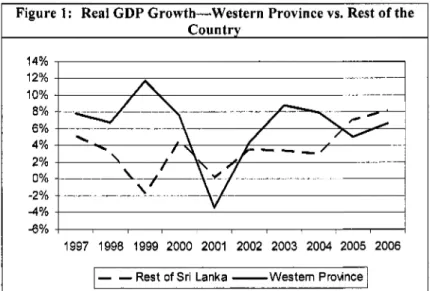
2. The Western Province has been, by far, the fastest growing region in S r i Lanka during the last decade, with an average real GDP growth o f 6.2 percent per annum between 1997 and 2006. The rest o f the country, in comparison, grew by just 2.3 percent per annum during the same period (figure 1)”. Average growth rates in Uva (3.2 percent) and Sabaragamuwa (0.7 percent) during this period were significantly below that o f the Western Province, and also below the national average (4.6 percent). However, the North and the East fared better-growing at 7.4 and 4.6 percent respectively--in large part because o f the substantial economic rebound between 2003 and 2005
Figure 1: Real GDP Growth-Western Province vs. Rest o f the Country
14%
12%
10%
8%
6%
4%
2%
0%
-2%
-4%
~ V-6% I
1997 1998 1999 2000 2001 2002 2003 2004 2005 2006
I - - Rest of Sri Lanka -Western Prounce 1
Source: Central Bank Department o f Census and Statistics (Sri Lanka), and World Bank Staff Estimates
(*): North excludes Mulaitivu and Kilinochchi districts
following the ceasefire agreement signed in early 2002. However, growth slowed again in this part of the country following the re-intensification o f the conflict in 2006/07. The Government’s capture o f the East i s likely to increase growth there, at least in the short run.
The Department o f Census and Statistics (DCS) released detailed spatial poverty data in 2004, based on household surveys
9
that o f any other province (Figure 2).
The income differences among other provinces are comparatively small. The both have average incomes o f around US$ 1,000 per capita, while the Eastern Northwestern and Southern provinces
4. Similarly, the Western Province’s share in the national GDP has increased and, in recent years, has hovered at around 50 percent o f the entire country’s production o f goods and services (figure 3). The other eight provinces-with two-and-a-half times the population o f the Western Province- share the remaining 50 percent o f economic activity among them. Among these provinces, the Northwestern and the Southern provinces are the largest in terms o f GDP, with each accounting for 9.3 percent o f the GDP in 2007. The Eastern and the Northern provinces contribute 4.7 percent and 2.9 percent, respectively, to the total GDP, on account o f relatively low average incomes and small populations.
4 $ 2
v)
Source: Central Bank and Department o f Census and Statistics
*): North excludes Mulaitivu and Kilinochchi districts Figure 2: GDP Per Capita by Province, 2006
--__-___I_-__._
I
Figure 3: The Western Province’s Share o f Total National GDP
5 2 %
50%
48%
46%
44%
4 2 ?‘o
40%
Source: Central Bank and Deoartment o f Census and Statistics (*): North excludes Mulaitiv; and Kilinochchi districts
5. The uneven growth outcomes are associated with uneven trends in poverty incidence.
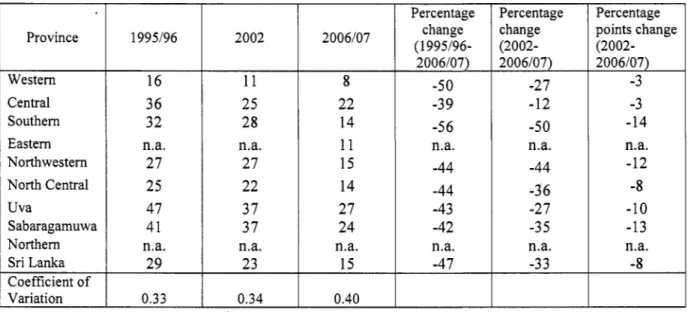
According to the HIES 2006/07 datal2, the Western Province has the lowest incidence o f poverty (8 percent) (Table 2) as measured by the poverty headcount index. However, during the past decade (1 995/06-2006/07), the Southern province experienced the largest reduction in poverty incidence--from 32 percent to 14 percent--while in the Western Province the poverty incidence dropped from 16 percent to 8 percent. In the most recent period (from 2002 to 2006/07), however, the Southern Province continued to
’’ The Department o f Census and Statistics (DCS) released summary data from its 2006107 surveys in August 2008. Poverty data
generally do not cover the North and East because o f incomplete coverage, although the 2006/07 survey did sample a number o f
Divisional Secretariat (DS) divisions in the East.
show a rapid drop in poverty incidence (14 percentage points) while the Western Province showed a reduction o f only three percentage point^.'^
0.34
Table 2: Poverty Head Count Index (1995/96-2006/07)
0.40 Province
Western Central Southern Eastern Northwestern North Central Uva
Sabaragamuwa Northern Sri Lanka
1995196
16 36 32 n.a.
27 25 47 41 n.a.
29 Coefficient o f
Variation I 0.33
2002
11 25 28 n.a.
27 22 37 37 n.a.
23
2006107
8 22 14 11 15 14 27 24 n.a.
15
Percentage change 2006107)
-50 -3 9 -56 n.a.
-44 -44 -43 -42 n.a.
-47 (1 995196-
Percentage change (2002- 2006107)
-2 7 -12 -50 n.a.
-44 -36 -27 -3 5 n.a.
-3 3
Percentage points change (2002- 2006107)
-3 -3 -14 n.a.
-12 -8 -10 -13 n.a.
-8
Source: Department o f Census and Statistics
6. Uva and Sabaragamuwa have the highest incidence o f poverty. A comparison o f poverty statistics shows that in 2006/07 Uva had the highest incidence o f poverty (27 percent), followed by Sabaragamuwa (24 percent) (Table 2). From 2002 to 2007, the overall rate o f poverty reduction in Sri Lanka was eight percentage points. However, Sabaragamuwa achieved a higher poverty reduction rate (13 percentage points) than the national average. The overall rate o f poverty reduction in U v a was 10 percent.
7. The sharp differences in growth and poverty outcomes between the Western province and the rest o f the country do not seem to be mirrored by commensurable differences in human capital.
The dispersion-as measured by the coefficient o f variation o f provincial literacy rates-is only 0.03,
confirming that public education policies in Sri Lanka have been, by and large, quite e q ~ i t a b l e ' ~ (Table
3). Despite the relative uniformity o f literacy rates there i s still, as expected, a negative correlation
between the provincial poverty rate and the average literacy rate. The dispersion in indicators for
educational attainment i s higher in particular at the extreme ends o f the achievement scale. The
population shares o f those who have not completed any schooling vs. those who have completed tertiary
education show much more regional variation than the share o f population with intermediate levels o f
educational attainment. Also, as expected, provinces with a high share o f people with no schooling have
higher poverty than provinces with a l o w share o f people with no schooling, as indicated by the positive
correlation coefficient o f 0.45. Conversely, provinces with high shares o f populations o f individuals who
have completed tertiary education have lower provincial poverty rates (correlation coefficient of -0.67).
rable 3: Human Capital Indicators by Province 2003
Central Eastern North Central Northwestern Northern Sabaragamuwa Southern Uva Western Sri Lanka
Coefficient o f variation
Correl. with prov. poverty rate ,
Literacy Rate 89 87 93 94 93 92 93 88 96 93 0.03 -0.49
Share o f Population that has Completed.. .
No Schooling 11 14 8 7 8 9 8 12
4 8 0.33 0.45
Primary 32 38 31 30 32 31 32 36 24 29 0.12 0.39
Secondary 40 31 44 42 32 43 38 39 46 41 0.13 0.1 1
Tertiary 18 17 17 21 29 17 22 14 27 21 0.25 -0.67 Source: Central Bank (Sri Lanka) Annual Report and World Bank Staff Calculations
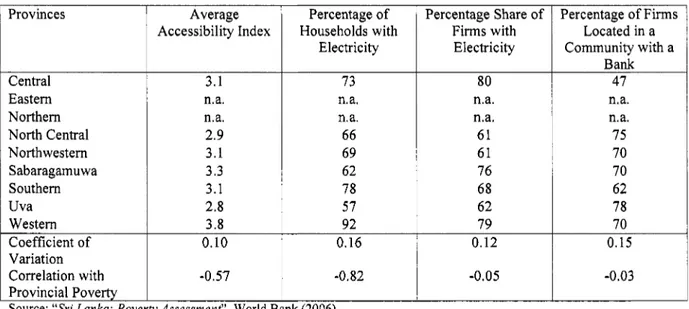
8. Regional gaps, in terms of access to economic infrastructure, may help explain the differences in growth and poverty outcomes (see Table 4). For example, in terms o f access to markets, the accessibility index15 for the Western province i s 25 percent higher than that o f Uva, which has the worst accessibility index in the country. The data suggest a negative correlation between accessibility and poverty--the better the accessibility the lower the poverty. Similarly, while over 90 percent o f households in the Western province have access to electricity the coverage in other regions i s around 60-80 percent, U v a being the least endowed province with only 57 percent having access t o electricity. The correlation between electricity coverage and poverty i s also strongly negative (correlation coefficient o f -0.82). Firm- specific infrastructure seems, however, not t o be strongly associated with regional differences in poverty.
For example, there i s only a l o w correlation between the share o f f i r m s connected t o the electricity grid and the provincial poverty rate (correlation coefficient o f only -0.05). The dispersion o f f i r m s ' access t o electricity i s somewhat lower than access by households, probably due to the fact that f i r m s are more concentrated in urban areas which, generally, have better access to electricity. The relationship between regional resources, returns o n assets, and regional differences in income levels will be further explored in a follow-up report.
The accessibility index measures at each point t h e sum o f the population totals o f surrounding cities and towns, inversely
weighted by the road network travel time to each town.
Table 4: Provincial Access to Economic Infrastructure
Coefficient o f Provinces
0.10 Central
Eastern Northern North Central Northwestern Sabaragamuwa Southern Uva Western
0.12 Average
Accessibility Index
0.15 3.1
ma.
n.a.
2.9 3.1 3.3 3.1 2.8 3.8 Variation
Correlation with
Percentage o f Households with
Electricity
-0.57
73
-0.05 n.a.
n.a.
66 69 62 78 57 92 0.16
-0.03 -0.82
1996 34%
34%
47%
34%
20%
26%
36%
53%
6%
Sri Lanka 22%
2000 32%
30%
45%
28%
19%
34%
3 8%
47%
5 yo 19%
Provincial Poverty
Source: “Sri Lanka:
PovertyAssessment”. World Bank (2006),
Percentage Share o f Firms with
Electricity 80 n.a.
n.a.
61 61 76 68 62 79
Percentage o f Firms Located in a Community with a
Bank 47 n.a.
n.a.
75 70 70 62 78 70
9. Agriculture i s a dominant economic sector in all provinces o f Sri Lanka except the Western province. The usual transformation o f the economy from a rural-based, agricultural economy to an urban- based economy i s happening only slowly outside the Western province. The share o f agriculture in national GDP was 16.5 percent in 2006, a decline from 22.4 percent in 1996. In the Western province, the share o f agriculture in provincial GDP was less than 3 percent in 2005 (Table 5). Agriculture’s share i s highest in Uva (44 percent in 2006), which also has the highest poverty rate. Accordingly, in the Western province the vast majority o f the labor force i s employed in industry and services (92 percent in 2004), whereas the rural-urban transformation in the rest o f the country i s at a much less pronounced stage and agriculture s t i l l accounts for close to half o f regional employment. According to the Central Bank o f Sri Lanka statistics, in Uva, over 63 percent o f the population i s directly employed in agriculture, while in Sabaragamuwa the share i s close to 37 percent. In Uva and Sabaragamuwa, the estate population i s 14 and 9 percent, respectively, o f the province populations.
Table 5: Agriculture’s Share in Provincial GDP
Central Eastern North Central Northwestern Northern Sabaragamuwa Southern Uva Western
2005 3 4%
28%
44%
23%
24%
29%
3 1%
49%
3 yo
17%
10. I n summary, the picture that emerges i s one o f significant disparities in economic growth and poverty reduction among different provinces during the past couple o f decades. Areas outside the Western province have significantly lower per capita incomes and higher poverty rates than the Western province. This i s consistent with the slower transformation o f these provincial economies compared to the Western province--in terms of migration of people from rural to urban areas, more rapid economic growth in urban areas, and an increasing shift from primary industries (agriculture, fishery, etc.) to secondary and tertiary industries.
1 1. Addressing regional development issues in Sri Lanka also requires addressing the development o f agriculture, given the substantial role o f the sector in the poorest provinces.
Agriculture stands for a significant share of value-added and employment, and the number o f households dependent on income from this sector in the poorest regions of the country i s very large. At the same time, poverty i s particularly pervasive among households dependent on agriculture. For this reason, as research presented in the World Development Report on Agriculture (WDR 2008) shows, increased agricultural income, in general, has a stronger effect on eliminating poverty than growth in other sources o f income. More broadly, agricultural productivity growth i s a necessary part of economic transformation because it allows the agricultural sector to release labor to other, higher-value-added sectors, while maintaining at least modest growth in rural/agricultural household incomes.
12. This report has three main objectives. In keeping with the Government’s objective o f increasing competitiveness in the agriculture sector and raising farmers’ incomes, the first objective of this report i s to strengthen the understanding of the growth, poverty and agriculture nexus in the poorest regions (in particular North, East, Uva and Sabaragamuwa)16 in Sri Lanka. The second objective i s to identify, through empirical analysis and local stakeholder consultations, a few agricultural products with high potential for income growth and study the key constraints to improving the profitability o f these commodities. The third objective i s to provide practical recommendations for interventions to address the constraints facing the value chains o f these products, as well as recommendations to alleviate cross- cutting constraints to broader agriculture sector growth. The ultimate objective i s that these interventions and improvements in broader policies would mitigate poverty over the medium-term by spurring growth in the poorest regions. The report i s also intended to provide an analytical foundation for a possible World Bank agricultural lending operation to strengthen the market orientation of this sector-something the Government has expressed interest in. I t should be noted that although productivity improvements in agriculture would play an important role in any strategy to increase growth in poorer regions and facilitate economic transformation towards higher value-added production, there are many other issues related to the question o f spatial economic integration and managing the tension between the forces o f economic concentration on one side and maintaining relatively spatial uniformity in standards o f living on the other side. These broader issues will be analyzed in a follow-up report.
13. The report relies on extensive consultations with a broad spectrum of stakeholders in Sri Lanka. Consultative meetings were held in Sri Lanka with numerous stakeholders, including the Government, the private sector, NGOs, and farmers. Most recently, the draft findings o f this report were discussed at a workshop held in Colombo in June 2008, with broad stakeholder participation”, coupled with a series o f individual stakeholder meetings. The main objective of these consultations was to identify key resources, constraints and market opportunities in the agricultural sector, using an explicit value- chain approach. International experience suggests that this approach works best if the focus i s kept on a limited number of value chains, and if the focus i s on products with a strong market potential and on clusters o f enterprises or farmers rather than on individual firms. Attention i s then paid to resolving a
l6
Given the limited availability of data for the North and East, the discussion, to a large extent, focuses on Uva and Sabaragamuwa
Bank, Finance Commission, Council for Agricultural research Policy, and the private agribusiness sector.
This included representatives from the Ministries of Finance and Planning, Nation Building, Agriculture, Livestock, Central
limited number of major constraints. The long-term aim i s to turn the identified potential strengths into a competitive advantage for the producers in high-poverty areas. The consultative process in Sri Lanka, supported by quantitative analysis o f the product value chain, helped in assessing the competitiveness and profitability o f the products studied in this report. It also helped identify gaps in the policy framework which currently limit the Government's scope for supporting the planned range o f interventions. Finally, the most recent consultations also, to a large extent, validated the findings and recommendations of this analysis.
14. The focus on three specific products (maize, milk and vegetables) does not mean that they are the only products with the potential for growth in S r i Lankan agriculture. The report argues that the domestic growth potential for maize and milk i s substantial. For maize the potential i s linked to the rapid growth in the domestic poultry industry which relies heavily on maize for feed, while in the case of milk, domestic production of fresh milk has the potential to compete with imported dried milk which currently dominates the domestic market. Vegetable production has arguably a lower growth potential, but i s included because of i t s importance for the poorest farmers in particular. Nevertheless, other products-for example tropical fruits, where Sri Lanka might have an unexploited export potential- could also reasonably have been included in the analysis. As such, the focus on the three selected products i s also intended to serve as an example o f how a value-chain based analysis can be carried out and replicated for other sectors as well.
15. The structure of the report i s as follows. Chapter 2 looks at the poverty/growth/agriculture nexus in the poorest regions o f Sri Lanka. It presents data on poverty and growth in the poorest provinces, especially Uva and Sabaragamuwa, and provides an analysis o f factors associated with the rural poor.
Chapter 3 provides an overview and brief discussion of the Government's agricultural policies and
programs. Chapter 4 identifies constraints that restrict farmers' incomes in the four poorest provinces. I t
presents results from extensive stakeholder consultations carried out in these provinces. These results are
complemented with findings from the 2005 Rural Investment Climate Assessment to identify some of the
general constraints in the agriculture sector in Sri Lanka. Chapter 5 presents the findings o f an agricultural
resource audit of small-scale farmers in the poorest regions that analyzed production, poverty and market
data. The chapter identifies income opportunities, in particular for a few agricultural products with high
income potential for poor farmers, whose production could take off with appropriate interventions. This
chapter also provides a value chain analysis of these products and identifies product-specific constraints
and gaps in the current policy portfolio that could potentially limit the Government's capacity to support
the whole range o f needed interventions. Drawing on the findings in previous chapters, Chapter 6 presents
recommendations. One set of recommendations i s specific to the three products with high income
potential and focuses on effective interventions for their production. Another set consists of cross-cutting
recommendations that would further improve performance in the targeted areas but also benefit
agricultural production more broadly. Chapter 7 sums up and concludes.
2. THE POVERTY, GROWTH AND AGRICULTURE NEXUS
Agriculture Industry Services GDP
16. Given the importance of agriculture in many o f the poorest provinces in Sri Lanka, this chapter looks at the poverty/growth/agriculture nexus. It reviews the overall growth performance o f the agricultural sector and the composition o f i t s sub-sectors, and analyses the relationship between households’ reliance o n agriculture and their poverty status. It should be emphasized, however, that this section only provides a perspective o f the link between agriculture, growth and poverty in the poorest regions. This means that the section focuses o n the correlation between poverty and agricultural characteristics, but does not seek to explain the possible link between trends in agriculture and the sharp decline in poverty that the most recent HIES reports. Such analysis has t o wait until the unit-record HIES i s made available for detailed analysis.
Western Province Rest o f the Country S r i Lanka
-1.8% 1.9% 1.5%
6.1% 3.1% 4.8%
6.8% 4.0% 5.6%
6.2% 2.7% 4.6%
17. Agricultural growth has lagged behind growth in other sectors in all parts o f the country.
F r o m 1996 to 2005, overall real GDP increased at an average annual rate o f 4.6 percent. The services sector expanded the fastest, by 5.6 percent o n average, while industry grew by 4.8 percent. By contrast, agriculture production increased by only 1.5 percent. The differences in sectoral growth rates have been even larger in the Western province compared to the rest o f the country. The rapid sectoral transformation in the Western province i s mainly explained by the fact that agricultural real GDP shrank by close to 2 percent per year over the last decade while industrial and services production grew between 6 and 7 percent annually in real terms (Table 6) over the same period. However, in the rest o f the country as well, there was a measurable growth differential between agriculture and other sectors--agriculture growth averaged a l o w 1.9 percent annually between 1996 and 2005, while industry and services grew by 3.1 percent and 4.0 percent, respectively.
18. Although agricultural growth has been sluggish and productivity low, there are signs that farmers are diversifying their crop production. The traditional mainstays o f agricultural production in Sri Lanka-the plantation crops (tea, rubber and coconut) and paddy-ontinue to play an important role.
In 2007 (the last year for which full-year data i s available), these crops made up 44.8 percent o f total
agricultural GDP, o f which paddy contributed the largest single share with 14.6 percent (Table 7). Over
time, however, the share o f these traditional mainstays has declined. In 2002, their share was 46.8 percent,
down from almost 55 percent in 1995. Vegetables, fruits, spices, and other commodities are n o w more
important within the agricultural sector than the traditional mainstays. Vegetables are the largest
agricultural commodity group, contributing 22.9 percent o f agricultural G D P in 2007. In 2005, the share
o f non-traditional crops in U v a and Sabaragamuwa amounted to 71 and 53 percent, respectively. The
distribution o f types o f crops grown in different provinces varies significantly, mainly reflecting,
differences in agro-ecological characteristics (Box 2).
Table 7: Cornpositit Plantation Crops
Tea Rubber Coconut
Minor export crops Paddy
Livestock Other food crops
Highland crops Vegetables Fruits Other
cropsI
o f Agricultural GDP, 2002-2008
2002 2003 2004 2005 2006 2007 2008 I
31.3% 31.1% 3 1.7% 30.5% 30.1% 30.2% 27.4%
12.9% 12.3% 12.5% 12.1% 1 1.4% 11 .O% 10.5%
2.0% 2.0% 2.0% 2.1% 2.1% 2.2% 1.8%
12.5% 12.7% 13.1% 1 1.9% 12.3% 12.6% 11.3%
4.0% 4.1% 4.0% 4.4% 4.3% 4.4% 3.7%
15.5% 16.2% 13.9% 16.0% 15.9% 14.6% 18.5%
7.7% 7.6% 7
I6% 7.3% 7.6% 8.1% 7.3%
34.9% 34.2% 35.4% 34.9% 34.7% 35.4% 36.0%
12.2% 1 1.5% 1 1.2% 11.3% 1 1.5% 11.8% 12.9%
21.9% 22.0% 23.4% 22.8% 22.5% 22.9% 22.4%
0.7% 0.8% 0.8% 0.8% 0.7% 0.8% 0.7%
10.6% 10.9% 11.4% 11.3% 11.6% 11.8% 10.8%
Source: Department o f Census and Statistics, Sri Lanka
Notes. Percent o f real agricultural GDP (2002 prices), excluding fisheries.
Box 2: Agro-Ecological Zones in Sri Lanka
The agro-ecological zones extending across Sri Lanka’s 66,000 square kilometers are diverse. Elevations rise from sea level throughout the coastal lowlands to more than 1,500 meters in the central highlands. The climate i s tropical, with l i t t l e seasonal variation in temperature. Rainfall patterns are dictated by the southwest monsoon which blows from M a y to September, and the northeast monsoon which rings rains from November to February. The intensity o f rainfall i s influenced by the central highlands which l i e in the path o f the rain-bearing winds.
The island i s divided into two broad agro-climatic zones: the wet zone and the dry zone. The wet zone covers the southwest quadrant o f the island, including the central highlands. Rainfall i s well distributed throughout the year, ranging from 2,000 to 5,000 millimeters per annum. Though accounting for only 25 percent o f the land area, the wet zone supports about 60 percent o f the island’s 20 million strong population All o f Sri Lanka’s export crops, which are primarily perennial, are found in this zone.
The dry zone i s characterized by low and highly seasonal rainfall which i s heavily concentrated during the northeast monsoon. The zone thus experiences a long dry period from about February to August when agriculture i s impossible without irrigation. In ancient times, the dry zone was the base o f a hydraulic civilization and much o f the current development in this zone has been associated with renovating and rehabilitating the ancient tank systems and resettling or colonizing the zone. The zone remains sparsely populated, except for these settlements in rehabilitated areas. Even so, rice and other annual crops produced in this zone help the island to meet its food requirements.
Twenty-five percent o f the land in Sri Lanka i s used for agriculture. Rice, coconut, tea, and rubber are the major
crops; they are grown on more than 80 percent o f the agricultural land area and account for about 60 percent o f the
value added from agriculture. I t i s common to distinguish between food crops and export crops (also referred to as
non-plantation and plantation crops). Non-plantation crops include, besides rice, other cereal grains such as maize,
finger millet, and sorghum; pulses such as green gram and black gram; condiments such as chilies and onions; tubers
such as manioc (cassava), potato, and sweet potato; oilseeds such as gingelly (sesame) and soybean; and h i t s and
vegetables. Apart from tea, rubber, and coconut, plantation crops include coffee, cocoa, cinnamon, and other spices
such as pepper, cardamom and nutmeg.
19. The incidence o f poverty in rural areas i s nearly double that o f urban areas. According to the 2006/07 HIES", the poverty headcount index (HCI)" for Sri Lanka as a whole i s 15.2 percent (nearly 2.8 million people), with the urban poor accounting for 7 percent o f the poor, the rural poor for 82 percent, and the estate poor for 11 percent. The H C I also indicates that the regions with the highest poverty in Sri Lanka are Uva and Sabaragamuwa,*' both o f which are predominantly rural. According to the HIES 2001/02, in Uva and Sabaragamuwa 81 and 87 percent of the population, respectively, live in rural areas, as do and 8 1 and 90 percent o f the poor.
Poverty Rates (%) by Sector
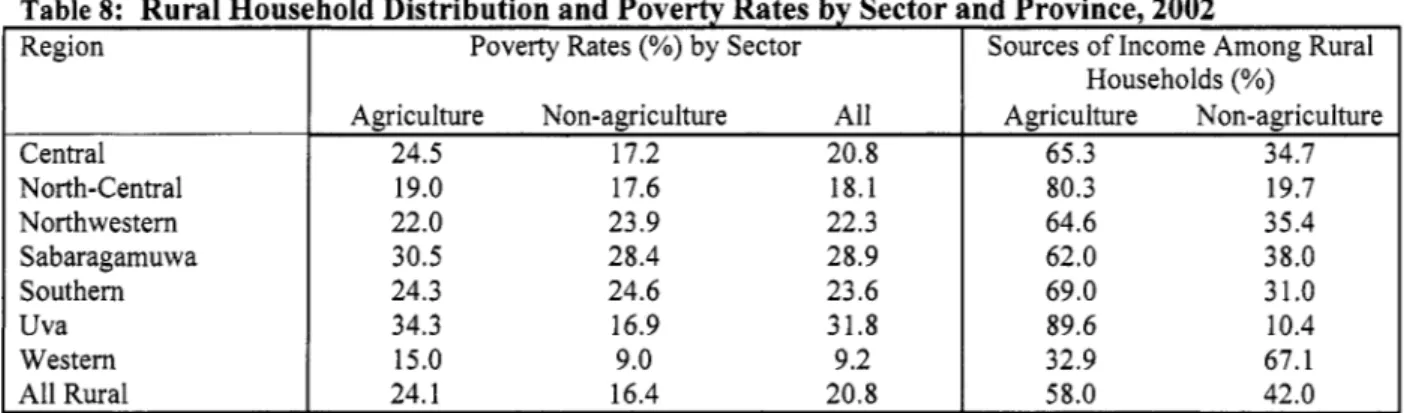
20. Poverty among households dependent on agriculture i s particularly high. Agriculture i s an important source o f income in rural Sri Lanka. According to the HIES 2001/02, agricultural households (that is, those deriving their income from crop production, livestock raising or agricultural wage labor) comprise over 60 percent o f rural households in a l l provinces with the exception o f the Western province (Table 8). In Uva, nearly 90 percent of rural households derive some income from agriculture, and more than 60 percent of rural households cultivate crops. In rural Sabaragamuwa, agriculture i s somewhat less important, with about 60 percent o f households deriving some income from agriculture and around 4 1 percent cultivating crops. In most provinces, poverty among households that are dependent on agriculture i s higher than among households not dependent on agriculture. The difference i s largest in Uva, where poverty among those depending on agriculture i s 34 percent as opposed to 17 percent for non-agricultural households. The differences are also significant in the Western and Central provinces but are more moderate in the remaining provinces.
Sources o f Income Among Rural Households (%)
Table 8: Rural Hous
Agriculture Non-agriculture All
24.5 17.2 20.8
Region
Agriculture Non-agriculture
65.3 34.7
19.0 17.6 18.1
22.0 23.9 22.3
30.5 28.4 28.9
24.3 24.6 23.6
34.3 16.9 31.8
15.0 9.0 9.2
80.3 19.7
64.6 35.4
62.0 38.0
69.0 31.0
89.6 10.4
32.9 67.1
24.1 16.4 20.8
Central North-Central Northwestern Sabaragamuwa Southern Western A l l Rural
Note: In agriculture-depenl wage labor.
Source: Staff Calculations from HIES (2001102).
58.0 42.0
I t
should be noted that the unit record data from the HIES o f 2006107 have not been released as yet, and only broad trends are The basic measure o f poverty i s the size o f the population that falls beneath the Poverty Line; the poverty head count index known. The detailed information presented here i s based on the HIES o f 2001102.
(HCI or PO) reports this as a percentage o f the population.
2o