www.biogeosciences.net/13/2971/2016/
doi:10.5194/bg-13-2971-2016
© Author(s) 2016. CC Attribution 3.0 License.
Biogeochemical characteristics of a long-lived anticyclonic eddy in the eastern South Pacific Ocean
Marcela Cornejo D’Ottone1, Luis Bravo2, Marcel Ramos3, Oscar Pizarro4, Johannes Karstensen5, Mauricio Gallegos6, Marco Correa-Ramirez7, Nelson Silva8, Laura Farias9, and Lee Karp-Boss10
1Escuela de Ciencias del Mar, Pontificia Universidad Católica de Valparaíso, P.O. Box 1020, Valparaíso Chile and Millennium Institute of Oceanography, Valparaíso, Chile
2Centro de Estudios Avanzados en Zonas Áridas (CEAZA), Facultad de Ciencias del Mar, Universidad Católica
del Norte & Millennium Nucleus for Ecology and Sustainable Management of Oceanic Islands (ESMOI), Coquimbo, Chile
3Departamento de Biología Marina, Facultad de Ciencias del Mar, Universidad Católica del Norte & Millennium Nucleus for Ecology and Sustainable Management of Oceanic Islands (ESMOI) &Centro de Estudios Avanzados en Zonas Áridas (CEAZA), Coquimbo, Chile
4Department of Geophysics, University of Concepcion, Chile and Millennium Institute of Oceanography, Concepción, Chile
5Physical Oceanography, GEOMAR Helmholtz Centre for Ocean Research Kiel, Kiel, Germany
6Departamento de Ecología, Pontificia Universidad Católica de Chile, Santiago, Chile
7Escuela de Ciencias del Mar, Pontificia Universidad Católica de Valparaíso, P.O. Box 1020, Chile and Instituto Milenio de Oceanografía (IMO), Valparaíso, Chile
8Escuela de Ciencias del Mar, Pontificia Universidad Católica de Valparaíso, P.O. Box 1020, Valparaíso, Chile
9Departamento de Oceanografía, Centro ciencia de Clima y la Resielcia (CR2) and Instituto Milenio de Oceanografia (IMO), Concepción, Chile
10School of Marine Science, University of Maine, Orono, ME 04469, USA Correspondence to: Marcela Cornejo D’Ottone (marcela.cornejo@ucv.cl)
Received: 23 April 2015 – Published in Biogeosciences Discuss.: 2 September 2015 Revised: 15 March 2016 – Accepted: 1 April 2016 – Published: 20 May 2016
Abstract. Mesoscale eddies are important, frequent, and per- sistent features of the circulation in the eastern South Pa- cific (ESP) Ocean, transporting physical, chemical and bi- ological properties from the productive shelves to the open ocean. Some of these eddies exhibit subsurface hypoxic or suboxic conditions and may serve as important hotspots for nitrogen loss, but little is known about oxygen consump- tion rates and nitrogen transformation processes associated with these eddies. In the austral fall of 2011, during the Tara Oceans expedition, an intrathermocline, anticyclonic, mesoscale eddy with a suboxic (< 2 µmol kg−1of O2), sub- surface layer (200–400 m) was detected ∼900 km off the Chilean shore (30◦S, 81◦W). The core of the eddy’s sub- oxic layer had a temperature-salinity signature characteristic of Equatorial Subsurface Water (ESSW) that at this latitude is normally restricted to an area near the coast. Measure- ments of nitrogen species within the eddy revealed under-
saturation (below 44 %) of nitrous oxide (N2O) and nitrite accumulation (> 0.5 µM), suggesting that active denitrifica- tion occurred in this water mass. Using satellite altimetry, we were able to track the eddy back to its region of forma- tion on the coast of central Chile (36.1◦S, 74.6◦W). Field studies conducted in Chilean shelf waters close to the time of eddy formation provided estimates of initial O2and N2O concentrations of the ESSW source water in the eddy. By the time of its offshore sighting, concentrations of both O2
and N2O in the subsurface oxygen minimum zone (OMZ) of the eddy were lower than concentrations in surrounding water and “source water” on the shelf, indicating that these chemical species were consumed as the eddy moved off- shore. Estimates of apparent oxygen utilization rates at the OMZ of the eddy ranged from 0.29 to 44 nmol L−1d−1and the rate of N2O consumption was 3.92 nmol L−1d−1. These results show that mesoscale eddies affect open-ocean biogeo-
denitrification and loss of fixed nitrogen from the system.
1 Introduction
Mesoscale eddies play a major role in vertical and horizon- tal transport of heat, salts and other physical, chemical and biological constituents (Chelton et al., 2007; Chaigneau et al., 2008, 2009). In the eastern South Pacific (ESP) Ocean, mesoscale eddies frequently form in the coastal transition zone off central Chile due to the instability of the along- shore currents (Hormazábal et al., 2013; Morales et al., 2010, 2012). These eddies transport water for long distances and over several months across biogeographic boundaries, from the productive Humboldt (Peru-Chile) Current to ad- jacent oligotrophic waters of the subtropical gyre (Pizarro et al., 2006). While cyclonic eddies transport surface wa- ters and are seen as negative anomalies by altimetry data, anticyclonic eddies, including the Intrathermocline eddies (ITE) are deeper and transport low oxygen and salty subsur- face waters from the Equatorial Subsurface Waters (ESSW;
Chaigneau et al., 2011).
Although eddies have been considered a net loss of nu- trients from the coastal zone (Gruber, 2011), they constitute a nutrient source in the open ocean that stimulates produc- tion in oligotrophic regions (McGillicuddy et al., 1998). In addition, eddies introduce spatial heterogeneity in produc- tivity, community structure and particle flux, as has been observed in the Sargasso Sea (McGillicuddy et al., 1998;
Sweeney et al., 2003). Impacts of eddies on biogeochemical processes are of particular interest for coastal transition zones of eastern boundary currents, where oxygen minimum zones (OMZs) and eddies interact (Altabet et al., 2012; Stramma et al., 2013). Open-ocean eddies associated with subsurface hypoxic or suboxic conditions have been observed in both the eastern tropical Atlantic and eastern tropical Pacific (e.g., Lukas and Santiago-Mandujano, 2001; Stramma et al., 2014;
Karstensen et al., 2015). High surface productivity, down- ward particle flux and oxygen respiration, combined with sluggish exchange between the eddy interior and surrounding waters, have been proposed as mechanisms leading to the for- mation of “dead zones” observed within anticyclonic-mode water eddies (Karstensen et al., 2015). Oxygen consumption rates within an eddy can be 3 to 5 times higher than in the sur- rounding oligotrophic water (Karstensen et al., 2015). Eddies containing hypoxic or suboxic water can become hotspots for nitrogen cycling, including biogenic production of N2 and loss of fixed nitrogen from the system (Altabet et al., 2012;
Stramma et al., 2013). Recently, Stramma et al. (2013) sug- gested that in the eastern tropical Pacific Ocean, coastal mode
a pronounced subsurface OMZ, such as in the ESP, eddies may play an important role in transporting OMZ waters and their microbial communities to the open ocean. The OMZ in the upwelling region of the ESP is associated with Equa- torial Subsurface Water (ESSW) that has been transported poleward, from the Pacific Ocean equatorial belt, along the coast with the Peru-Chile undercurrent. The ESSW is char- acterized by high salinity and nutrient concentrations, low oxygen concentrations and an active, bacterially mediated nitrogen cycling, including production and consumption of the greenhouse gas nitrous oxide (N2O). Intense nitrification, denitrification and nitrous oxide (N2O) production associated with ESSW is generally confined to a narrow coastal band and contributes to net nitrogen loss in this region (Lam and Kuypers, 2011).
Intriguing questions about the role of coastally generated eddies abound: what biogeochemical transformations occur as this volume of water is advected offshore? Do concen- trations of dissolved oxygen decrease, increase or remain the same? If changes in dissolved oxygen concentrations occur during transport, what are the other biogeochemical consequences in both surface and subsurface layers? Here, we present results from a study on the physical and chem- ical characteristics of a single anticyclonic eddy observed
∼900 km offshore, off central Chile. We tracked the eddy back to its region of formation and examined changes in con- centration of oxygen and nitrogen species from the time it left the coast to the time it was sampled in the oligotrophic ocean.
2 Methods
2.1 Hydrography and nitrogen data
Hydrographic data and water samples for analyses of nutri- ents, N2O and surface15N-POM were collected along a tran- sect from Valparaíso, Chile (33◦S, 71.6◦W) to Easter Island (28.2◦S, 107.4◦W) during the Tara Oceans Expedition (11–
31 March 2011, Fig. 1; Karsenti et al., 2011). Sampling con- sisted of 11 vertical profiles using a Sea-Bird 911 equipped with an oxygen sensor (SBE43, sampling rate 24 Hz;
Picheral et al., 2014). Due to logistical constraints, the oxy- gen sensor could not be calibrated on board. It was calibrated at the start of the expedition (July 2009) and a year later (Au- gust 2010 during a stopover in Cape Town, South Africa).
A third calibration was conducted in September 2011 (dur- ing a stopover in Papeete). The sensor showed mean drifts of 0.101 (August 2010) and 0.405 µmol kg−1 (September 2011), between successive calibrations. Because oxygen cal- ibrations could not be done routinely, post-cruise validation
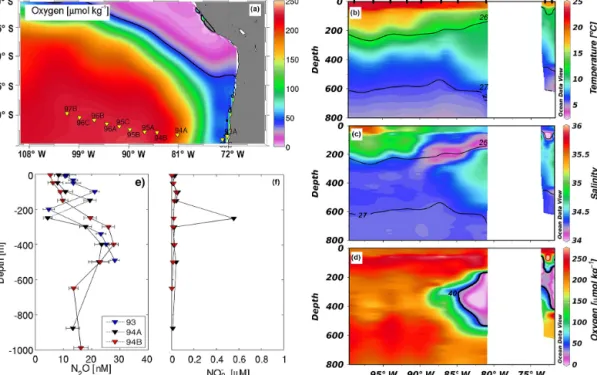
Figure 1. (a) Climatology of dissolved oxygen distributions (µmol kg−1)at a depth of 200 m in the eastern South Pacific Ocean. Yel- low triangles indicate locations of stations during the Tara Oceans cruise. Vertical distributions of (b) temperature (◦C), (c) salinity and (d) dissolved oxygen along the transect of the Tara Ocean cruise, from coastal water off Chile to the open ocean. Black lines in (b) and (c) indicate the 26.0 and 27.0 kg m−3σt isopycnals. Black line in (d) indicates the isoclines of 40 µmol kg−1 of dissolved oxy- gen. (e) Vertical distribution of N2O at Tara stations 093 (34.0◦S/73.0◦W, blue triangles; TARA_20110312T1637Z_093_EVENT_CAST), 094-A (33.2 ◦S/81.1◦W, black triangles; TARA_20110316T1152Z_999_EVENT_CAST) and 094-B (32.8◦S/84.8◦W, red triangles;
TARA_20110317T1815Z_999_EVENT_CAST). (f) Vertical distribution of NO−2 at Tara stations, 094-A (black triangles) and 094-B (red triangles). For a complete detail of the Tara CTD cast please refer to (Picheral et al., 2014).
of oxygen data included comparison of raw oxygen mea- surements with WOA13 climatology (Garcia et al., 2014) as described by Roullier et al. (2014). For the ESP transect, absolute differences between measured dissolved oxygen (SBE 43) and climatology for the upper 500 m of the water column averaged 9.1 µmol kg−1(0.03–24.47 µmol kg−1)for oceanic stations and 16.7 µmol kg−1(0.06–36.24 µmol kg−1) for the coastal stations. Below 850 m, absolute differences between in situ measurements and climatology averaged 6.62 µmol kg−1(0.81–19.08 µmol kg−1).
Discrete water samples for N2O (in triplicate) and nutrient (in duplicate) analyses were obtained from a rosette equipped with 10 L Niskin bottles. Samples were collected at 0, 50, 100, 150, 200, 250, 300, 400, 500, and 900 m. N2O samples (20 mL) were taken after the inorganic carbon samples, us- ing a tygon tubing to avoid bubble formation. Samples were fixed with 50 µL of saturated mercuric chloride and stored in the dark. N2O concentrations were determined onshore using a gas chromatograph equipped with an electron capture de- tector (ECD), following a headspace technique (McAullife, 1971). A four-point calibration curve was determined with air (0.32 ppm) and N2O standards of 0.1, 0.5 and 1 ppm (Scotty gas mixture; Air Liquid Co.).
Nutrient samples (NO−3, NO−2 and PO−34 )were collected by filtering seawater (GF/F 0.7 µm filters); filtrates were stored at−20◦ C until analysis onshore. Concentrations of NO−3, NO−2 and PO−34 were measured using a Seal Analyti- cal AA3 AutoAnalyzer (Grasshoff et al., 1983).
2.2 Eddy identification and tracking
Presence and position of mesoscale eddies in the region were determined by analyzing weekly maps of anomalies in sea level and geostrophic velocities from the multi-satellite AVISO product (Ssalto/Duacs, http://www.aviso.altimetry.fr/
en/data.html), from April 2010 to September 2011. This grid- ded, multi-satellite altimeter product provides spatial reso- lution of 1/3◦ and allows resolution of eddies with an e- folding scale > 40 km (Chaigneau et al., 2011; Chelton et al., 2011). For eddy tracking, we used the Okubo-Weiss param- eter method (W), which evaluates the relative dominance of strain and vorticity (Chelton et al., 2007; Okubo, 1970; San- grà et al., 2009; Weiss, 1991):
W=Sn2+Ss2−ω2 (1)
Ss=∂v
∂x+∂u
∂y; (3)
ω=∂v
∂x−∂u
∂y; (4)
where Sn and Ss are the normal and shear components of strain, respectively, andωis the relative vorticity.
This approach confirmed that the water mass sampled in station 094-A (30◦S, 81◦W;
TARA_20110316T1152Z_999_EVENT_CAST;
http://doi.pangaea.de/10.1594/PANGAEA.836473; Fig. 1a) was associated with an eddy. The path of this eddy was reconstructed from its time of origin (28 April 2010) to the time of its decay (29 June 2011) by tracing the eddy center (i.e., the region with highest vorticity) in successive geostrophic fields.
Vertical hydrographic profiles obtained from station 094- A (within the identified eddy) were compared with vertical profiles of temperature, salinity and dissolved oxygen con- centration collected during other studies in the area and with nearby Argo buoy profiles and climatological information from WOA13 data (Garcia et al., 2014). Data available for the nearest grid (1◦×1◦) to station 094-A were used in this analysis.
2.3 Glider information at the origin of the eddy To characterize the properties of water near the time and location of eddy formation we used temperature, salinity and oxygen data from a cross-shore transect (73.0–74.8◦W, 36.5◦S) conducted with a Slocum glider (Teledyne Tech- nologies) in June 2010 (Pizarro et al., 2015). The data cov- ered an area that extended to within 160 km from the pre- sumed starting point of the eddy based on satellite backtrack- ing. The glider was equipped with an optical oxygen sen- sor (Aanderaa Data Instrument oxygen Optode model 3830).
Oxygen sensor calibrations are routinely done at the Physical Oceanography Laboratory, Universidad de Concepción, with a two-point calibration (0 and 100 % of oxygen saturation).
Details of the sensor and the physical principles involved in the measurements are described in Körtzinger et al. (2005) and Uchida et al. (2008).
3 Results and discussion 3.1 Hydrography
A vertical section of temperature, salinity and oxygen, mea- sured along the transect from Valparaíso (33.4◦S, 71.6◦W) to Easter Island (27.08◦S, 109.3◦W) in March 2011 pro- vides regional context (Fig. 1b, c, d, respectively). A sub-
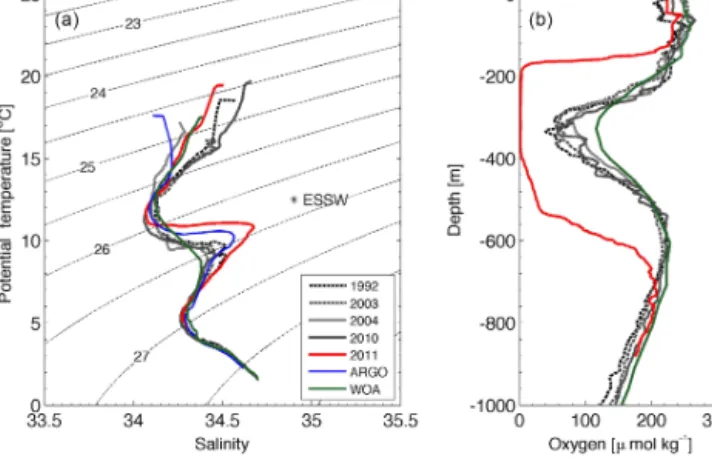
Figure 2. (a)T−S diagram from various sampling programs in the study area; (b) dissolved oxygen profiles at Tara station 094- A (red line) and stations in its vicinity from cruises conducted on 1992 (black dashed line), 2003 (gray dashed line), 2010 (thick gray line) and 2004 (thin gray line); from Argo buoys (blue line, without oxygen), and the WOA 2013 climatology (green line). More details on data sources are provided in Table 1.
surface oxygen minimum layer (with dissolved oxygen con- centration as low as 1.17 µmol O2kg−1)was detected at sta- tion 094-A, 922 km offshore (30◦S, 81◦W, Fig. 1d). Dis- solved oxygen concentrations observed at 094-A are anoma- lous given that at this latitude the boundary of the OMZ (defined as O2< 44.6 µmol kg−1) and its core (defined as O2< 22.3 µmol kg−1)do not typically extend beyond∼600 and∼500 km from the shoreline, respectively (Silva et al., 2009). Suboxic conditions (O2< 10 µmol kg−1)are thought to be confined to the shelf region and were reported only in some bottom waters over the continental shelf (Farías, 2003).
Climatological data indicate that subsurface water in the vicinity of station 094-A is typically oxygenated (Fig. 1e).
According to the above classification of dissolved oxygen concentrations, the OMZ observed at station 094-A has its upper and lower boundaries at depths of 164 and 536 m, re- spectively, while suboxic conditions were observed between 174 and 421 m (66 % of the OMZ).
The low-oxygen water mass was associated with higher salinities (34.60–34.66) compared to surrounding water (Fig. 1c) and climatology for this region (34.15–34.36, for the years 1965–2012). Historical data from previous cruises conducted along the P06-WOCE transect (32.5◦S) or north of the study region (e.g., 28◦S, Scorpio; Silva et al., 2009;
27◦S, CIMAR 5 cruise; Fuenzalida et al., 2006) do not show such anomalies in physical and chemical conditions at this longitude (Fig. 2a and b). The presence of the anomalous salinity signature observed in this study is supported by an independent Argo float that profiled in the vicinity of 094-A (33.86◦S, 79.84◦W) during the Tara Oceans’ sampling pe- riod (Fig. 2).
Table 1. Sources of hydrographic data used in this study. The name, location, and distance between the nearest location of the measurements and station 094-A are reported.
Name of Year Station Location Distance to Kind
the program 094-A [km] of data
P06E (WOCE)1 1992, 2003 2010 24 32.52◦S/80.64◦W 93.1 Profile
Biosope2 2004 STB19 33.04◦S/81.18◦W 23.8 Profile
Float ARGO3 2011 – 33.86◦S/79.84◦W 137.3 Float
WOA132 Climatology 13237 33.50◦S/81.50◦W 41.7
1http://www.nodc.noaa.gov/woce.2Source: http://www.nodc.noaa.gov/OC5/indprod.html.
3Source: http://www.coriolis.eu.org.
Figure 3. Vertical anomalies of (a) temperature (◦C), (b) salinity, (c) dissolved oxygen (µmol kg−1)in station 094-A compared with WOA 2013 climatology (range of years for climatology).
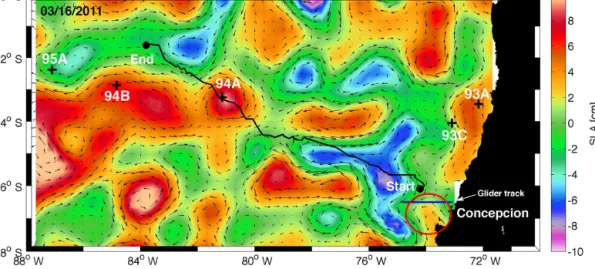
Vertical profiles of salinity and temperature anomalies at 094-A show a warm and salty core centered between 230 and 270 m, accompanied by the dome and bowl shapes of the upper and lower thermocline, respectively (Fig. 3). This feature is characteristic of an intrathermocline, anticyclonic eddy (ITE, Xiu and Chai 2011; Chaigneau et al., 2011; Hor- mazábal et al., 2013). Positive sea-level anomalies (SLA) and associated geostrophic currents further indicate that station 094-A was located close to the center of a mesoscale anti- cyclonic eddy (∼150 km in diameter), centered at 33.45◦S, 80.85◦W (Fig. 4).
Reconstruction of this mesoscale eddy suggests that it was formed in the coastal transition zone off Concepción (36.09◦S, 74.21◦W), approximately 315 d prior to our sam- pling at station 094-A, and advected northwest at a mean ve- locity of 2.4 cm s−1, approx. 2 km d−1(Fig. 4). Reconstruc- tion of the eddy’s velocity and direction agrees well with pre- viously reported trajectories of eddies in the area (Chaigneau, 2005).
3.2 OMZ evolution in the eddy
In the ESP, eddies could frequently transport suboxic water from the coastal OMZ to oceanic regions (Hormazábal et al., 2013). Low-oxygen water masses (O2< 44.6 µM) have been detected in the middle of the South Pacific Ocean (2000 km offshore at 28◦S; Silva et al., 2009), but at the time the au- thors did not associate these water masses with mesoscale eddies. In the North Pacific Ocean, low concentrations of dis- solved oxygen in the subsurface open ocean have been pre- viously described in association with anticyclonic mesoscale eddies (Altabet et al., 2012; Chaigneau et al., 2011; John- son and McTaggart, 2010; Lukas and Santiago-Mandujano, 2001), and have been attributed to low-oxygen source waters (Lukas and Santiago-Mandujano, 2001) or to local consump- tion during the transport of an eddy (Karstensen et al., 2015).
To estimate temporal changes in concentrations of dis- solved oxygen in the subsurface layer of our sampled eddy, we used underwater glider measurements, collected in June 2010, at 36.5◦S/74◦W (120 km from shore). This is the es- timated location of the eddy 1 month after its formation and oxygen concentrations of source water are in agreement with those reported for other ITEs in the same region (Hormazábal et al., 2013). Glider measurements of dissolved oxygen showed a well-developed OMZ (O2< 44.6 µM; Fig. 5) be- tween 104 and 352 m, with a suboxic layer located between 135 and 226 m. We refer to these values as the eddy’s “initial”
subsurface oxygen concentrations. Dissolved oxygen con- centrations were then compared along isopycnals between the estimated location of the eddy’s origin and its offshore lo- cation at station 094-A (Fig. 6). By the time the eddy reached its offshore location, the OMZ in the eddy was deeper and thicker (located between 164 and 537 m) than the OMZ measured in the coastal transition zone, and the lowest dis- solved oxygen concentration decreased from 7.34 µmol kg−1 at 173 m to 1.17 µmol kg−1 at a depth of 338 m. The sub- oxic layer of the eddy in the open-ocean was located be- tween 174 and 422 m, almost three times thicker than the suboxic layer of the “source water” (Fig. 6). This suggests that the observed OMZ offshore is a result of both advec- tion of low-oxygen coastal water by an eddy and continuing
Figure 4. Sea surface hight from satellite data at the time of sampling in Tara station 094-A (March 2011). The position of the sampling stations (black crosses) and estimated eddy trajectory (black line) with start and end locations (black circles) of the trajectory are also indicated. The red circle off Concepción (36◦S) shows the probable eddy generation zone.
biological consumption during its transport. Estimated oxy- gen consumption rate in the OMZ of the eddy ranged from 0.29 to 44 nmol O2L−1d−1(∼0.1–15 µmol O2L−1yr−1)in the core of the eddy (Fig. 6), which is quite high compared to previously reported oxygen consumption rates in other OMZs in this depth range (Karstensen et al., 2008). Consid- ering the eddy’s area (20×103km2; transport of ESSW of
∼1.38 Sv) and the thickness of the layer with dissolved oxy- gen concentrations < 44.6 µM (373 m), an oxygen deficit of 12.2 Tg is expected in the subsurface eddy’s layer. This cal- culation is likely to underestimate the oxygen deficit since mixing with surrounding oxygen-rich water has not been taken into account here. If the whole sub-saturated oxygen layer of the eddy is considered (from ∼80 to 1000 m), the estimated oxygen deficit transported to the oceanic region is even larger. While this crude, back-of-the-envelope calcula- tion of oxygen deficit should be taken with a grain of salt, it highlights the significant influence of eddies on OMZs in the open ocean. When the eddy dissipates, the oxygen deficit in the subsurface layer will be redistributed and will contribute to the overall oxygen budget of the ESP OMZ region.
The area of the “birth” of the studied eddy (∼36◦S) has been identified as a hotspot of eddy generation (Hormazábal et al., 2013), with ∼5–7 ITEs that can reach a diameter
> 100 km being formed every year. If the eddy studied here is representative of eddies generated in the OMZ of the eastern boundary of the Pacific Ocean, between 31 and 36◦S, ad- vection of and continued respiration within oxygen-deficient waters could produce a deficit as high as 60–85 Tg O2yr−1 within the oceanic region.
Figure 5. Vertical distributions of dissolved oxygen (µmol kg−1) in a cross-shore section at 36.5◦S near the time of eddy formation (June 2010). Black line indicates the isoline of 25 µmol kg−1.
3.3 Subsurface biogeochemical implications of the eddy OMZ regions of eastern boundary current systems are con- sidered important with respect to the nitrogen cycle. These are areas where nitrogen is lost due to denitrification and anammox, and are often associated with the buildup of ni- trite (NO−2; Lam and Kuypers, 2011). Water masses with these features can be advected and the processes enhanced offshore as indicated by the observed accumulation of high subsurface NO−2 in anticyclonic coastal eddies (Stramma et al., 2013).
Off the Chilean coast, elevated NO−2 concentrations are generally found within the core of the OMZ (Cornejo and Farías, 2012a; Silva et al., 2009). Previous studies con- ducted in the region of the eddy’s formation show that ni- trite concentrations in hypoxic waters (< 7 µmol O2kg−1)are
< 0.1 µM (Cornejo and Farías, 2012b). In the present study, initial oxygen concentrations in the OMZ of the eddy were
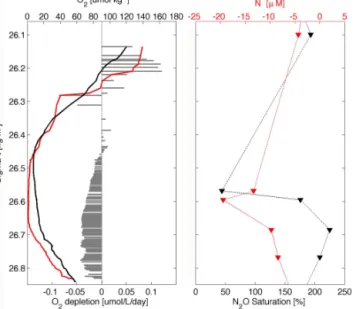
Figure 6. (a) Vertical distribution of Oxygen as a function ofσt at Tara station 094-A (within the eddy) in March 2011 (red line) and at the coast in June 2010 (black line). Estimated O2depletion rates are shown as gray bars, where the vertical dotted line marks zero O2 consumption rate. (b) Vertical distributions of Nitrate deficit (N*) and Nitrous oxide saturation (black triangles and line) as a function ofσt within the eddy at station 094-A.
low enough to support high denitrification and anammox and, consequently, the accumulation of NO−2. The vertical distribution of NO−2 in station 094-A (oligotrophic ocean) shows a subsurface NO−2 maximum (up to 0.56 µM) at a depth of 250 m (Fig. 1f). The apparent buildup of NO−2 con- centration within the eddy corresponds to a NO−3 deficit (N*) of −13.90 µM (Fig. 6) relative to surrounding water (deter- mined from the deviation of the NO−3 : PO−34 molar ratio from the Redfield ratio according to Deutsch et al., 2001), suggesting that conditions in the eddy’s anoxic zone were fa- vorable for denitrification. A subsurface water mass with low oxygen concentrations and marked nitrate deficit has been previously observed in the oligotrophic, oceanic water of the EPS, during the Scorpio cruise (Fig. 7, Silva et al., 2009), but other nitrogen species indicative of denitrification were not measured, and tools to link this water mass to eddy activity were not well developed at that time.
Another indication of the existence of anaerobic condi- tions within the OMZ of the eddy is the presence of a N2O consumption layer. This greenhouse gas is produced by nitrification and denitrification under hypoxic conditions and consumed by denitrification under suboxic conditions (< 8 µM of O2; Bonin et al., 1989). The vertical distribution of N2O in the eddy (station 094-A) shows a double peak with a supersaturation at the upper and lower boundaries of the subsurface OMZ (up to 224 %) and subsaturation (44 %) in the upper region of the OMZ core (Fig. 1e), suggesting that both production and consumption of N2O occurred in the
Figure 7. Vertical distributions ofσt, dissolved oxygen and nitrate deficit (N*; according to Deutsch et al., 2001) in a cross-shore transect along 28◦S in the Eastern Southern Pacific Ocean (72 to 100◦S) during Scorpio cruise (June 1967). Black lines refer toσt of 26 and 27 kg m−3.
eddy. Layers depleted in N2O have been previously observed in different OMZs in coastal environments where denitrifi- cation takes place (Cornejo and Farías, 2012a). To the best of our knowledge, this is the first reported N2O consump- tion layer in oceanic subsurface waters of the South Pacific Ocean.
Oxygen concentrations in the area where the eddy was formed are often too high to support significant N2O con- sumption (Cornejo and Farías, 2012b; Cornejo et al., 2015).
Thus N2O is being accumulated alongshore in the coastal OMZ (up to 25 nM) and consumed only in bottom waters associated with suboxic conditions. In the absence of di- rect measurements of N2O concentrations at the time of eddy formation, we use the mean coastal N2O concentrations (22.68±2.99 nM) from three previous cruises (FIP; Cornejo et al., 2015) observed at the isopycnal σt=26.56 kg m−3 (depth with N2O undersaturation at station 094-A) as the
“initial” concentration of N2O in the eddy. We estimated a consumption rate of 3.92 nmol N2O L−1d−1 during the time the eddy was advected offshore. This N2O consump- tion rate is half of those reported from incubation experi- ments conducted at the upper (shallower) boundary of the OMZ off Perú (8.16 nmol L−1d−1; Dalsgaard et al., 2012).
Higher rates might have occurred in the center of the eddy, where more active denitrification is expected. Furthermore, it is likely that we have underestimated N2O production since mixing with upper and lower layers that are supersaturated
considering that N2O consumption does not occur at dis- solved oxygen concentrations > 8 µM (Bonin et al., 1989).
Within the eddy, this layer was 60 m thick (210–270 m) meaning that net consumption was at least ∼0.15 Gg N2O during the offshore transfer. This N2O consumption repre- sents only 14 % of the N2O accumulation estimated above and below the consumption layer, suggesting that the eddy provided a net supply of ∼0.85 Gg of N2O to the oceanic region. Observing both production and consumption of N2O in the eddy signifies net nitrogen loss, with possible impacts on even global nitrogen and N2O balances.
This study provides new evidence that anticyclonic mesoscale eddies play important roles in the biogeochem- istry of the ESP (Altabet et al., 2012; Stramma et al., 2013).
Previous studies have shown that mesoscale eddies act as hotspots for microbially mediated nitrogen loss via denitri- fication in coastal water; here we show that open-ocean anti- cyclonic eddies can play a similar role in parts of the ocean that are far removed from productive coastal waters and their associated OMZs.
Acknowledgements. This study is partly based on data sets gath- ered by the Tara Oceans Expeditions 2009–2012. We are keen to thank the committed people and the following sponsors who made this singular expedition possible: CNRS, EMBL, Genoscope/CEA, ANR, Agnès B., the Veolia Environment Foundation, Region Bretagne, World Courier, Cap l’Orient, the Foundation EDF Diver- siterre, FRB, the Prince Albert II de Monaco Foundation, Etienne Bourgois and the Tara schooner, crew. Moreover, this integrated sampling strategy couldn’t have been done without the involvement of École Normale Supérieure, Université Pierre et Marie Curie, Stazione Zoologica, University College Dublin, University of Milan-Bicocca, Institute de Ciences del Mar, University of Bremen, Institute de Microbiologie de la Mediterranée, MNHN, MIT, UofA, Bigelow Institute, Universite Libre de Bruxelles, University of Hawaii. We thank Sarah Searson for providing technical support onboard, Marc Picheral for calibrations of the oxygen sensor and Sabrina Speich for providing satellite images that helped guiding sampling during the cruise. We thank Peter Jumars and John Dolan for his helpful comments and edits. This work is part of the Mil- lennium Scientific Initiative, grant IC 120019. Marcel Ramos and Luis Bravo are grateful for support from Chilean Millennium Ini- tiative (NC120030) grant. Luis Bravo acknowledges support from Posdoctoral-FONDECYT/Chile-3130671. Oscar Pizarro thanks support from FONDECYT 11021041, PFB 37/02 and MI-LOCO (Gordon and Betty Moore Foundation). Johannes Karstensen was supported by the DFG project SFB 754 (http://www.sfb754.de).
M. Correa-Ramirez was supported by FONDECYT no. 11130463.
Laura Farias was supported by FONDAP program no. 15110009.
The authors thank the Goddard Space Flight Center, Greenbelt, MD 20771, USA, for the production and distribution of MODIS data. SLA data were produced by Ssalto/Duacs and distributed by Aviso http://www.aviso.altimetry.fr/en/data.html. This article is
References
Altabet, M. A., Ryabenko, E., Stramma, L., Wallace, D. W.
R., Frank, M., Grasse, P., and Lavik, G.: An eddy-stimulated hotspot for fixed nitrogen-loss from the Peru oxygen minimum zone, Biogeosciences, 9, 4897–4908, doi:10.5194/bg-9-4897- 2012, 2012.
Bonin, P., Gilewicz, M., and Bertrand, J. C.: Effects of oxygen on each step of denitrification on Pseudomonas nautica, Can. J. Mi- crobiol., 35, 1061–1064, 1989.
Chaigneau, A.: Eddy characteristics in the eastern South Pacific, J.
Geophys. Res., 110, C06005, doi:10.1029/2004JC002815, 2005.
Chaigneau, A., Gizolme, A., and Grados, C.: Mesoscale eddies off Peru in altimeter records: Identification algorithms and eddy spatio-temporal patterns, Prog. Oceanogr., 79, 106–119, doi:10.1016/j.pocean.2008.10.013, 2008.
Chaigneau, A., Eldin, G., and Dewitte, B.: Eddy activ- ity in the four major upwelling systems from satellite altimetry (1992–2007), Prog. Oceanogr., 83, 117–123, doi:10.1016/j.pocean.2009.07.012, 2009.
Chaigneau, A., Le Texier, M., Eldin, G., Grados, C., and Pizarro, O.: Vertical structure of mesoscale eddies in the eastern South Pacific Ocean: A composite analysis from altimetry and Argo profiling floats, J. Geophys. Res., 116, C11025, doi:10.1029/2011JC007134, 2011.
Chelton, D. B., Schlax, M. G., Samelson, R. M., and de Szoeke, R.
A.: Global observations of large oceanic eddies, Geophys. Res.
Lett., 34, L15606, doi:10.1029/2007GL030812, 2007.
Chelton, D. B., Schlax, M. G., and Samelson, R. M.: Global ob- servations of nonlinear mesoscale eddies, Prog. Oceanogr., 91, 167–216, doi:10.1016/j.pocean.2011.01.002, 2011.
Cornejo, M. and Farías, L.: Following the N2O consumption in the oxygen minimum zone of the eastern South Pacific, Biogeo- sciences, 9, 3205–3212, doi:10.5194/bg-9-3205-2012, 2012a.
Cornejo, M. and Farías, L.: Meridional variability of the vertical structure and air–sea fluxes of N2O off cen- tral Chile (30–40◦S), Prog. Oceanogr., 92–95, 33–42, doi:10.1016/j.pocean.2011.07.016, 2012b.
Cornejo, M., Murillo, A. A., and Farías, L.: An unaccounted for N2O sink in the surface water of the eastern subtropical South Pacific: Physical versus biological mechanisms, Prog. Oceanogr., doi:10.1016/j.pocean.2014.12.016, 2015.
Dalsgaard, T., Thamdrup, B., Farías, L., and Peter Revsbech, N.:
Anammox and denitrification in the oxygen minimum zone of the eastern South Pacific, Limnol. Oceanogr., 57, 1331–1346, doi:10.4319/lo.2012.57.5.1331, 2012.
Deutsch, C., Gruber, N., Key, R. M., and Sarmiento, J. L.: Denitrifi- cation and N2fixation in the Pacific Ocean, Global Biogeochem.
Cy., 15, 483–506, 2001.
Faías, L.: Remineralization and accumulation of organic carbon and nitrogen in marine sediments of eutrophic bays: the case of the Bay of Concepcion, Chile, Estuar. Coast. Shelf Sci., 57, 829–
841, doi:10.1016/S0272-7714(02)00414-6, 2003.
Fuenzalida, R., Schneider, W., Blanco, J. L., Garcés-Vargas, J., and Bravo, L.: Sistema de corrientes Chile-Perú y masas de agua en- tre Caldera e Isla de Pascua, Com. Ocean. Nac., 2006.
Garcia, H. E., Locarnini, R. A., Boyer, T. P., Antonov, J. I., Bara- nova, O. K., Zweng, M. M., Reagan, J. R., and Johnson, D. R.:
World ocean atlas 2013, Volume 3, Dissolved Oxygen, Apparent Oxygen Utilization, and Oxygen Saturation, 2014.
Grasshoff, K., Ehrhardt, M., and Kremling, K.: Methods of seawater analysis, edited by: Grasshoff, K., Kremling, K., and Ehrhardt, M., Verlag Chemie, 1983.
Gruber, N.: Warming up, turning sour, losing breath: ocean biogeo- chemistry under global change, Philos. T. R. Soc. A., 369, 1980–
96, doi:10.1098/rsta.2011.0003, 2011.
Hormazábal, S., Combes, V., Morales, C., Correa-Ramirez, M. A., Di Lorenzo, E., and Nuñez, S.: Intrathermocline eddies in the coastal transition zone off central Chile, 2013.
Johnson, G. C. and McTaggart, K. E.: Equatorial Pacific 13◦C Water Eddies in the Eastern Subtropical South Pacific Ocean*, J. Phys. Oceanogr., 40, 226–236, doi:10.1175/2009JPO4287.1, 2010.
Karsenti, E., Acinas, S. G., Bork, P., Bowler, C., De Vargas, C., Raes, J., Sullivan, M., Arendt, D., Benzoni, F., Claverie, J.-M., Follows, M., Gorsky, G., Hingamp, P., Iudicone, D., Jaillon, O., Kandels-Lewis, S., Krzic, U., Not, F., Ogata, H., Pesant, S., Reynaud, E. G., Sardet, C., Sieracki, M. E., Speich, S., Ve- layoudon, D., Weissenbach, J., and Wincker, P.: A holistic ap- proach to marine eco-systems biology, PLoS Biol., 9, e1001177, doi:10.1371/journal.pbio.1001177, 2011.
Karstensen, J., Stramma, L., and Visbeck, M.: Oxygen minimum zones in the eastern tropical Atlantic and Pacific oceans, Prog.
Oceanogr., 77, 331–350, 2008.
Karstensen, J., Fiedler, B., Schütte, F., Brandt, P., Körtzinger, A., Fischer, G., Zantopp, R., Hahn, J., Visbeck, M., and Wallace, W.: Open Ocean dead zone in the tropical North Atlantic Ocean, Biogeosciences, 12, 1–9, doi:10.5194/bg-12-1-2015, 2015.
Körtzinger, A., Schimanski, J., and Send, U.: High quality oxygen measurements from profiling floats: A promising new technique, J. Atmos. Ocean. Technol., 22, 302–308, 2005.
Lam, P. and Kuypers, M. M. M.: Microbial Nitrogen Cycling Pro- cesses in Oxygen Minimum Zones, Annu. Rev. Mar. Sci., 3, 317–
345, doi:10.1146/annurev-marine-120709-142814, 2011.
Lukas, R. and Santiago-Mandujano, F.: Extreme water mass anomaly observed in the Hawaii Ocean Time-series, Geophys.
Res. Lett., 28, 2931–2934, 2001.
McAullife, C.: GC determination of solutes by multiple phase equi- libration, Chem. Technol., 1, 46–51, 1971.
McGillicuddy, D., Robinson, A., Siegel, D., Jannasch, H., Johnson, R., Dickey, T., McNeil, J., Michaels, A., and Knap, A.: Influence of mesoscale eddies on new production in the Sargasso Sea, Na- ture, 395, 263–266, 1998.
Morales, C. E., Loreto Torreblanca, M., Hormazabal, S., Correa- Ramírez, M., Nuñez, S., and Hidalgo, P.: Mesoscale structure of copepod assemblages in the coastal transition zone and oceanic waters off central-southern Chile, Prog. Oceanogr., 84, 158–173, doi:10.1016/j.pocean.2009.12.001, 2010.
Morales, C. E., Hormazabal, S., Correa-Ramirez, M., Pizarro, O., Silva, N., Fernandez, C., Anabalón, V., and Torreblanca, M.
L.: Mesoscale variability and nutrient–phytoplankton distribu- tions off central-southern Chile during the upwelling season:
The influence of mesoscale eddies, Prog. Oceanogr., 104, 17–29, doi:10.1016/j.pocean.2012.04.015, 2012.
Okubo, A.: Horizontal dispersion of floatable particles in the vicin- ity of velocity singularities such as convergences, Deep-Sea Res., 17, 445–454, 1970.
Picheral, M., Searson, S., Taillandier, V., Bricaud, A., Boss, E., Stemmann, L., Gorsky, G., and Consortium, Tara Oceans Co- ordinators Tara Oceans Expedition, P.: Vertical profiles of envi- ronmental parameters measured from physical, optical and imag- ing sensors during Tara Oceans expedition 2009–2013, Pangaea, doi:10.1594/PANGAEA.836321, 2014.
Pizarro, G., Montecino, V., Astoreca, R., Alarcón, G., Yuras, G., and Guzmán, L.: Variabilidad espacial de condiciones bio-òpticas de la columna de agua entre las costas de Chile insular y continental.
Primavera 1999 y 2000, Cienc. Tecnol. Mar., 29, 45–58, 2006.
Pizarro, O., Ramírez, N., Castillo, M., Cifuentes, U., Rojas, W., and Pizarro-Koch, M.: Underwater glider observations in the oxy- gen minimum zone off central Chile, B. Am. Meteorol. Soc., doi:10.1175/BAMS-D-14-00040.1, 2015.
Roullier, F., Berline, L., Guidi, L., Durrieu De Madron, X., Picheral, M., Sciandra, A., Pesant, S., and Stemmann, L.: Parti- cle size distribution and estimated carbon flux across the Arabian Sea oxygen minimum zone, Biogeosciences, 11, 4541–4557, doi:10.5194/bg-11-4541-2014, 2014.
Sangrà, P., Pascual, A., Rodríguez-Santana, Á., Machín, F., Ma- son, E., McWilliams, J. C., Pelegrí, J. L., Dong, C., Ru- bio, A., Arístegui, J., Marrero-Díaz, Á., Hernández-Guerra, A., Martínez-Marrero, A., and Auladell, M.: The Canary Eddy Corridor: A major pathway for long-lived eddies in the sub- tropical North Atlantic, Deep-Sea Res. Pt. I, 56, 2100–2114, doi:10.1016/j.dsr.2009.08.008, 2009.
Silva, N., Rojas, N., and Fedele, A.: Water masses in the Hum- boldt Current System: Properties, distribution, and the nitrate deficit as a chemical water mass tracer for Equatorial Subsur- face Water off Chile, Deep-Sea Res. Pt. II, 56, 1004–1020, doi:10.1016/j.dsr2.2008.12.013, 2009.
Stramma, L., Bange, H. W., Czeschel, R., Lorenzo, A., and Frank, M.: On the role of mesoscale eddies for the biological productiv- ity and biogeochemistry in the eastern tropical Pacific Ocean off Peru, Biogeosciences, 10, 7293–7306, doi:10.5194/bg-10-7293- 2013, 2013.
Stramma, L., Weller, R. A., Czeschel, R., and Bigorre, S.: Eddies and an extreme water mass anomaly observed in the eastern south Pacific at the Stratus mooring, J. Geophys. Res.-Ocean., 119, 1068–1083, 2014.
Sweeney, E. N., McGillicuddy, D. J., and Buesseler, K. O.: Bio- geochemical impacts due to mesoscale eddy activity in the Sargasso Sea as measured at the Bermuda Atlantic Time- series Study (BATS), Deep-Sea Res. Pt. II, 50, 3017–3039, doi:10.1016/j.dsr2.2003.07.008, 2003.
Uchida, H., Kawano, T., Kaneko, I., and Fukasawa, M.: In situ cali- bration of optode-based oxygen sensors, J. Atmos. Ocean. Tech- nol., 25, 2271–2281, 2008.
Weiss, J.: The dynamics of enstrophy transfer in two-dimensional hydrodynamics, Physica D, 48, 273–294, 1991.
Xiu, P. and Chai, F.: Modeled biogeochemical responses to mesoscale eddies in the South China Sea, J. Geophys. Res., 116, C10006, doi:10.1029/2010JC006800, 2011.