Measurement of CP Violating Processes
Christian Kiesling
Max-Planck-Institute for Physics, Munich, Germany
In this report we summarize the present status of CP violation as measured in the two B- Factories in the US and in Japan. Both these machines have stopped operation (the SLAC machine in 2008, the KEKB accelerator end of June 2010) and are now in process of analyz- ing their full statistics. While several final analyses on CP violation are still underway, the emerging picture concerning the measurements of the quark flavor mixing matrix shows overall good consistency with the Standard Model of CP violation, as formulated by Kobayashi and Maskawa. Still there are a few tantalizing hints of possible deviations from the conventional wisdom, so that strong arguments exist to push for a new round of high-precision experiments, which will become available with the next generation of ultra-high luminosity machines such as SuperKEKB in Japan.
1 Introduction
Within the Standard Model (SM) the three observed generations of quarks and leptons show the remarkable feature that the weakly interacting (flavor) eigenstates are misaligned with the corresponding mass eigenstates. This misalignment can be represented by a 3× 3 mixing matrix, one for the quarks and one for the leptons. In the quark sector this leads to the Cabibbo- Kobayashi-Maskawa (CKM) matrix, where the CP violation phenomena are explained by a single irreducible phase. The BaBar and Belle collaborations, performing experiments at the Υ(4S) resonance formed in asymmetric e
+e
−colliders (“B-factories”) have made essential contributions to establish the theory of Kobayashi and Maskawa. For their outstanding achievement Kobayashi and Maskawa were awarded the Nobel Prize in 2008.
Although the observed CP violation using K and B mesons are extremely well described quantitatively within the SM, there is clear evidence for physics beyond. One such indication comes from the observed matter-antimatter asymmetry (“baryon asymmetry”) in the Universe which cannot be explained by the SM. To explain the baryon asymmetry new sources of CP violation would be needed, producing much larger CP violation effects at energies much larger than presently accessible. However, precise measurements of CP violation at low energies and possible (small) deviations from the prediction of the SM would point to such new sources.
From the B-factories the total data samples comprise 470 million (BaBar) and 770 million
(Belle) B B ¯ events, mostly from the Υ(4S) state. In this article we summarize the measure-
ments on CP violation using a large fraction of this data (final analyses are still going on) and
compare them with the predictions of the SM. Although generally in good agreement, there are
indeed a few interesting observations which motivate further increasing the precision of these
measurements.
2 CP Violation in the Standard Model
Within the SM the weak eigenstates (d
′, s
′, b
′) are linear combinations of the mass eigenstates (d, s, b), connected by a 3
×3 matrix, referred to as the CKM matrix1,2V
CKM. The CKM matrix is unitary and their elements V
ijdescribe the coupling strengths of the flavor changing currents at the quark level, such as b
→c or b
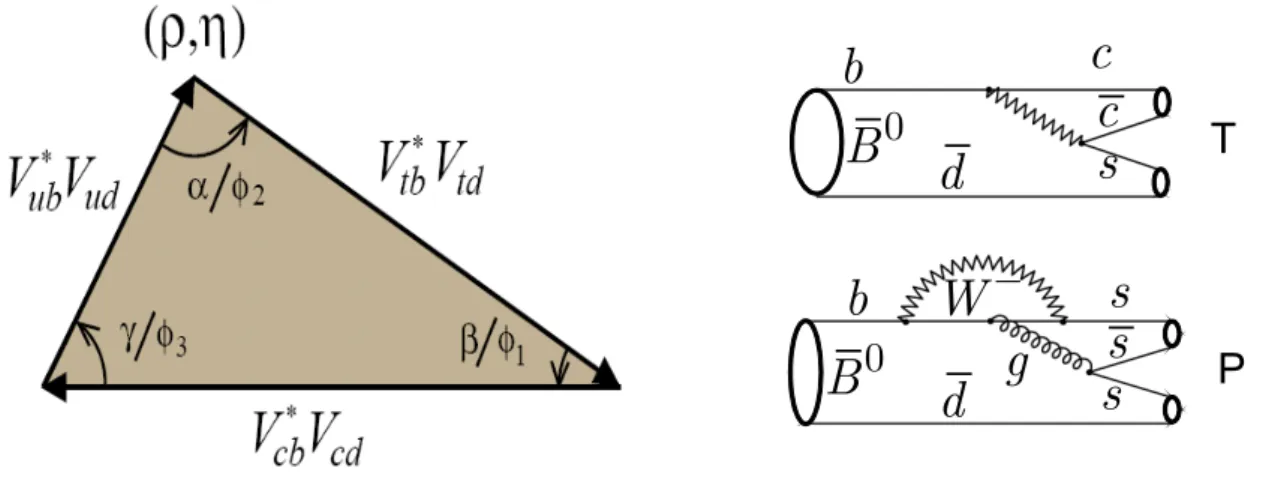
→u. The unitarity of the CKM matrix gives rise to a total of six so-called unitarity triangles, one of them involving the b-quark couplings (“B-triangle”, see fig. 1, left side). In the so-called Wolfenstein parameterization of the CKM matrix two elements are complex: V
tdand V
ub. If the corresponding phase is non-zero, the triangles have a finite area and CP violation will occur. In the B-triangle all three sides are of similar length, corresponding to large angles and thus giving rise to large CP violating effects. As one can see in fig. 1, combinations of the CKM matrix elements build up the unitarity triangle. Within the SM the B-triangle is highly over-constrained (5 observables for only 2 independent quantities), so a precise and consistent measurement of all the three angles and the two sides is a crucial check of the validity of the SM.
b
d g
B 0 s
s W - s
P
b c
d
c s
B 0 T
Figure 1: Left: The B unitarity triangle constructed from the Cabibbo-Kobayashi-Maskawa matrix. Right:
Feynman diagrams for tree level (“T”) and penguin (“P”) decays of the ¯B0meson.
The charged current interactions of the quarks are mediated by W boson emission, they change the quark flavor, e.g. in b
→c transitions. As an example, the tree diagram (“T”) for the decay B
0 →J/ψK
0is shown in fig. 1( right side, upper graph). Here, the CKM matrix elements V
cband V
cscontribute. In contrast, neutral currents are flavor-conserving, therefore flavor-changing processes (FCNC) can only proceed in higher order (see fig. 1, right side, lower graph). In this “penguin” diagram (“P”), describing, e.g., the decay B
0 →φK
0, the matrix elements V
tband V
tsenter.
An important FCNC process is B
0−B ¯
0mixing, which allows a B
0meson to transform into its anti-particle ¯ B
0(and vice-versa) with a time evolution given the mass eigenstates B
Land B
H:
|
B
Li= p
|B
0i+ q
|B ¯
0i, |B
Hi= p
|B
0i −q
|B ¯
0iThe normalized (complex) parameters p, q are given by the off-diagonal elements of the mass mixing matrix in the time evolution described by the Schr¨ odinger equation (see, e.g.,
3).
Consider now the decay of a neutral B meson and its anti-particle ¯ B
0into the same CP eigenstate f
CP, e.g. B
0( ¯ B
0)
→J/ψK
S. The corresponding decay rates Γ(B
0(t)
→f
CP) and Γ( ¯ B
0(t)
→f
CP) are time-dependent and are governed by the parameters p, q and the respective decay amplitudes A
f=
hfCP |B
0iand ¯ A
f=
hfCP |B ¯
0ivia the parameter
λ
f= q p
A ¯
fA
f(d) B
0→ J/ ψ K
00 100 200 300
400
q=+1q=−1Entries / 0.5 ps
-0.5 0 0.5
-7.5 -5 -2.5 0 2.5 5 7.5 - ξ
f∆ t(ps)
Asymmetry
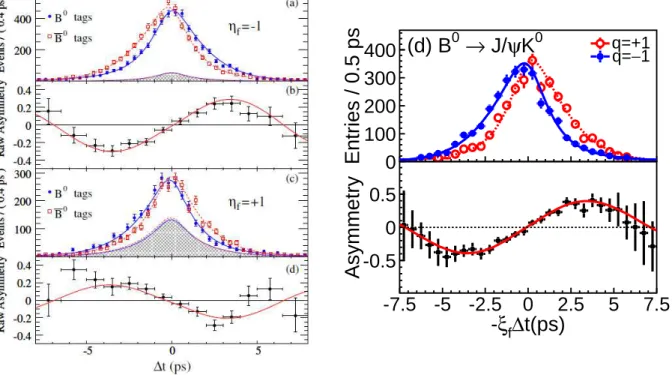
Figure 2: Recent measurements of the time-dependent CP asymmetry from the charmonium final statesJ/ψKS, ψ(2S)KS,χc1KS andηcKS by BaBar (see5), left side, and combined J/ψKS and J/ψKLdata by Belle (right side). The measurements are in good mutual agreement. The curves drawn result from fits based on the SM.
One of the flagship measurements at the B-factories are the time-dependent CP violating asym- metries. These asymmetries are measured by observing the decay rate, as function of the time difference ∆t, of a B
0meson into the specific CP eigenstate f
CP, as compared to the same final state coming from the ¯ B
0. The CP violating time-dependent asymmetry is then defined as:
A(f
CP, ∆t) = Γ( ¯ B
0→f
CP; ∆t)
−Γ(B
0→f
CP; ∆t)
Γ( ¯ B
0→f
CP; ∆t) + Γ(B
0→f
CP; ∆t) =
Afcos ∆M ∆t +
Sfsin ∆M ∆t.
Here, ∆M is the mass difference between the heavy and light mass eigenstates ∆M = M(B
H)
−M (B
L). The direct (A
f) and indirect or “mixing-induced” (S
f) CP asymmetries are given by the parameter λ
f:
Af
= 1
− |λf|21 +
|λf|2,
Sf= 2ℑλ
f1 +
|λf|2.
In order to determine which of the two flavors (B
0or ¯ B
0, “CP side”) has decayed into the common final state f
CP, the other B-decay (“tag side”) is analyzed for a specific flavor, using, e.g., semi-leptonic decays (B
0 →Xl
−ν, ¯ B ¯
0 →Xl
+ν ). The charge of the lepton uniquely identifies (“tags”) the flavor of the B meson. Since the two B mesons are produced at the B-factories in an entangled state by virtue of the quantum numbers of the Υ(4S), the tag side uniquely
adetermines the flavor of the B-meson that decayed into the CP eigenstate. The time difference ∆t is given by the difference in decay times between the tag side and the CP side.
Note that ∆t can be positive or negative.
athe quantum entanglement is broken when the first of theB-mesons decays. From then on the otherB-meson is freely oscillating betweenB0and ¯B0, but with a known time dependence.
K
+K
-K
Sβ ( φ K
S)
HFAG ICHEP 2010
-10 0 10 20 30 40 50
BaBar
arXiv:0808.0700
7.7 ± 7.7 ± 0.9
Belle
arXiv:1007.3848
32.2 ± 9.0 ± 2.6 ± 1.4
Average
HFAG correlated average
16.9 ± 6.0
H F A GH F A G
ICHEP 2010 PRELIMINARY
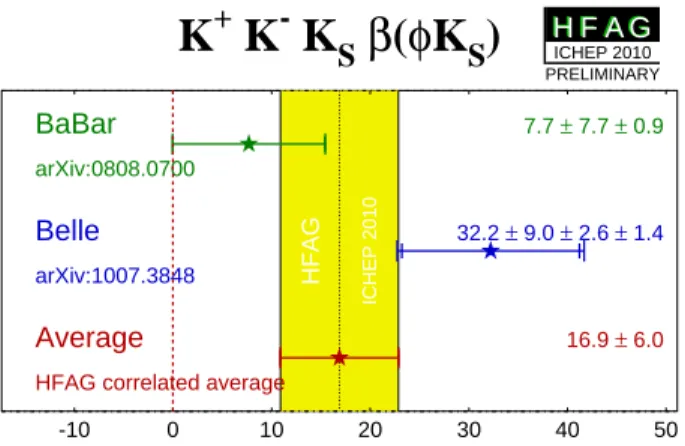
Figure 3: Measurements ofφ1using the channelB→φKS, exhibiting the FCNC transitionb→ss¯sfrom BaBar and Belle (see text).
3 Measurements on CP Violation in the
B
Meson SystemDepending on the CP eigenstate chosen, any of the three angles φ
1(β), φ
2(α) or φ
3(γ) of the B- triangle can be measured. Chosing, e.g., the final state J/ψK
0, the angle φ
1(or β) is determined.
For a measurement of the angle φ
2decays into charmless mesons are used, e.g. B
→ππ, ρρ and B
→ρπ . Finally the angle φ
3is measured with the help of decays such as B
→D
(∗)K. Using the time-dependent CP asymmetries, the coefficients
Af(direct CP violation) and
Sf(mixing- induced CP violation, giving access to the angles of the unitarity triangle) can be determined in all the cases.
3.1 Measurement of the Angle
φ
1Since the so-called “Golden Channel” B
0 →J/ψK
0is dominated by the tree diagram, direct CP violation is negligible. In this case the parameter λ
fdirectly measures the angle φ
1: λ
f= e
−2iφ1. Recent measurements from the BaBar
5and Belle
4collaborations of the time-dependent CP asymmetry for the J/ψK
0channel are shown in fig. 2. For BaBar (left side), the asymmetry is given for the charmonium states +K
S, while for Belle (right side) the contributions from J/ψK
Sand J/ψK
Lare combined. Since the ∆t distributions for the two neutral B mesons are different (blue and read symbols), CP violation is established. Due to the high statistics (“golden channel”) the value of φ
1is determined with an accuracy of less than one degree when averaging over the available experimental data
6: φ
1= (21.1
±0.9)
◦.
An important cross-check is to measure the angle φ
1also in processes which are dominated by penguin diagrams. In principle, both measurements (tree- and penguin-dominated) should yield the same results. On the other hand, penguins (loop diagrams) are well suited to look for New Physics, manifesting itself through a significant deviation from the SM prediction.
Considering the FCNC quark transitions b
→sq q, a large number of possible ¯ B decays, such as B
→φK, K
+K
−K
0, π
+π
−K
0, ωK
0and many others (with mesons containing a strange quark) can be utilized. As an example of a recent measurement of φ
1the final state φK
Sis shown in fig. 3, comparing the measurements from Babar
7and Belle
8. The average of both measurements agrees within the error of the charmonium modes. However, the measurement from BaBar is consistent with zero, while the new value from Belle, based on almost the full statistics (657 M B B ¯ events) measures a value for φ
1consistent with the tree measurement.
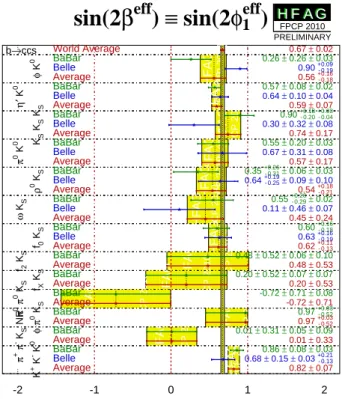
A compilation of the presently available FCNC transitions mediated by penguins (b
→sq q) ¯
in comparison to the tree value from the Golden Channel is shown in fig. 4. It should be
noted that the channels with non-strange mesons in the final state, such as ππK
0, may receive
contributions from tree level diagrams (here: b
→u¯ us). These, however, are expected to be
sin(2 β
eff) ≡ sin(2 φ
e1 ff)
HFAGFPCP 2010HFAG FPCP 2010HFAGFPCP 2010HFAG FPCP 2010
HFAG FPCP 2010HFAG FPCP 2010
HFAG FPCP 2010HFAG FPCP 2010
HFAG FPCP 2010
HFAG FPCP 2010
HFAG FPCP 2010 HFAG FPCP 2010
HFAG FPCP 2010 HFAGFPCP 2010
b→ccs φ K0η′ K0 KS KS KS
π0 K0 ρ0 KS
ω KS f0 KS
f2 KS fX KS
π0π0 KS φπ0 KS
π+π- KS NR K+ K- K0
-2 -1 0 1 2
World Average 0.67 ± 0.02
BaBar 0.26 ± 0.26 ± 0.03
Belle 0.90 +-00..0199
Average 0.56 +-00..1168
BaBar 0.57 ± 0.08 ± 0.02
Belle 0.64 ± 0.10 ± 0.04
Average 0.59 ± 0.07
BaBar 0.90 +-0
0. .1
28 0+
-0 0. .0
03
Belle 0.30 ± 0.32 ± 0.084
Average 0.74 ± 0.17
BaBar 0.55 ± 0.20 ± 0.03
Belle 0.67 ± 0.31 ± 0.08
Average 0.57 ± 0.17
BaBar 0.35 +-00..2361 ± 0.06 ± 0.03
Belle 0.64 +-0
0. .1 29
5 ± 0.09 ± 0.10
Average 0.54 +-00..1281
BaBar 0.55 +-0
0. .2
26 9 ± 0.02
Belle 0.11 ± 0.46 ± 0.07
Average 0.45 ± 0.24
BaBar 0.60 +-0
0. .1
16
Belle 0.63 +-00..11869
Average 0.62 +-0
0. .1
11
BaBar 0.48 ± 0.52 ± 0.06 ± 0.103
Average 0.48 ± 0.53
BaBar 0.20 ± 0.52 ± 0.07 ± 0.07
Average 0.20 ± 0.53
BaBar -0.72 ± 0.71 ± 0.08
Average -0.72 ± 0.71
BaBar 0.97 +-00..0532
Average 0.97 +-00..0532
BaBar 0.01 ± 0.31 ± 0.05 ± 0.09
Average 0.01 ± 0.33
BaBar 0.86 ± 0.08 ± 0.03
Belle 0.68 ± 0.15 ± 0.03 +-0
0. .2
11
Average 0.82 ± 0.073
H F A GH F A G
FPCP 2010 PRELIMINARY
Figure 4: Compilation of the variousb→sq¯qFCNC transitions dominated by penguin contributions, compared to the tree value from the Golden Channel (see text).
small (less than 5 %) due to the small coupling V
ub. On the other hand, one observes a tendency for almost all of the FCNC transitions to result in values of sin 2φ
eff1below the one from the flavor-changing tree diagram. Indeed such a systematic shift may be a mild hint for New Physics.
3.2 Measurement of the Angle
φ
2As can be seen from the sides of the unitary triangle in fig. 1, the angle φ
2is essentially defined by the two CKM matrix elements V
uband V
td. The corresponding quark transition is b
→u¯ ud, an example is the decay B
0→π
+π
−. Both tree and penguin contribute with comparable strength and the “penguin pollution” might prevent a clean measurement of the angle φ
2. However, the bias to the angle φ
2from the penguin contribution can be determined in an isospin analysis
9: The di-pion state is either I = 0 or I = 2 (I = 1 is forbidden by Bose-Einstein statistics). While the tree diagram contributes to both the I = 0 and I = 2 amplitudes, the penguin b
→du¯ u can only contribute to I = 0. By measuring the branching ratios of all three differently charged di-pion states (B
0 →π
+π
−, π
0π
0, B
+ →π
+π
0) one can separate the two isospin contributions and therefore correct for the penguin bias in the measurement of φ
2.
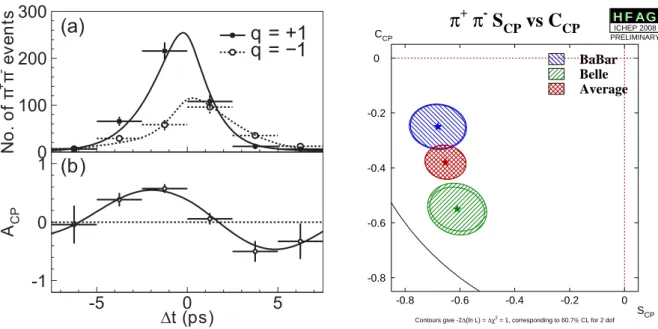
Measurements of the time-dependent CP asymmetry from Belle
10, based on 535 million B B ¯ events, are shown on the left side of fig. 5, similar measurements exist from BaBar
11. Here, one can clearly see a contribution from direct CP violation (A
f 6= 0). The measurements onAfand
Sffrom both experiments are compared on the right side of the figure. Please note that here the BaBar convention for the direct asymmetry term (C
f=
−Af) is used. The plot shows the 1σ confidence contours for both measurements. One can observe a mild disagreement between Belle and BaBar for the π
+π
−channel.
Apart from π
+π
−, there are some other decay channels sensitive to the angle φ
2such as
B
→ρπ and B
→ρρ. Taking these channels together, penguin pollution effects (via isospin
analyses) can be corrected for and angular ambiguities can be lifted, resulting in a combined
value for φ
2as given by the CKMfitter group
12: φ
2= (89.0
+4.4−4.2)
◦can be derived (see fig. 6).
0 100 200 300
q = +1 q = −1 (a)
No . o f π
+π
-ev en ts
-1 0 1
-5 0 5
∆t (ps) A
CP(b)
π
+π
-S
CPvs C
CPContours give -2∆(ln L) = ∆χ2 = 1, corresponding to 60.7% CL for 2 dof
-0.8 -0.6 -0.4 -0.2 0
-0.8 -0.6 -0.4 -0.2 0
SCP CCP
BaBar Belle Average
H F A GH F A G
ICHEP 2008 PRELIMINARY
Figure 5: Left: Measurement of the ∆tdistribution for the decayB0→π+π−(q= +1) and ¯B0→π+π−(q=−1) from Belle (upper plot) and the corresponding time-dependent CP asymmetry (lower plot). Right: comparison
of the parameters Af ≡ −CCP andSf=SCP between BaBar and Belle is shown.
CKM fit meas. in the fit φ2
no
(deg) φ2
0 20 40 60 80 100 120 140 160 180
1 - CL
0.0 0.2 0.4 0.6 0.8 1.0
Moriond 09
CK M
f i t t e r B →ππ/ρρ/ρπ (BABAR)
(Belle) π ρ ρ/ ρ π/ π
→ B
(WA) π ρ ρ/ ρ π/ π
→ B
Figure 6: Confidence level distribution6 for the angleφ2 (see text).
3.3 Measurement of the Angle
φ
3In the Wolfenstein quark phase convention used here, all CKM matrix elements except V
uband V
tdare real to a very good approximation. For this reason the weak phase φ
3is simply given by φ
3 ≡argV
ub∗. One can therefore use
13the interference between the b
→c¯ us and b
→u¯ cs transitions to access the angle φ
3. Both transitions proceed at the tree level, so penguins do not contribute significantly and the theoretical uncertainties are therefore very small. Several methods have been proposed to exploit this interference in the decays B
→D
(∗)0K, such as the GLW or the ADS methods
13,14which look for two-body D decays with definite CP parity or for doubly Cabibbo-suppressed final states of the D
0meson.
Larger statistics is obtained with three-body final states, such as K
Sπ
+π
−, which, however,
necessitate a Dalitz plot analysis
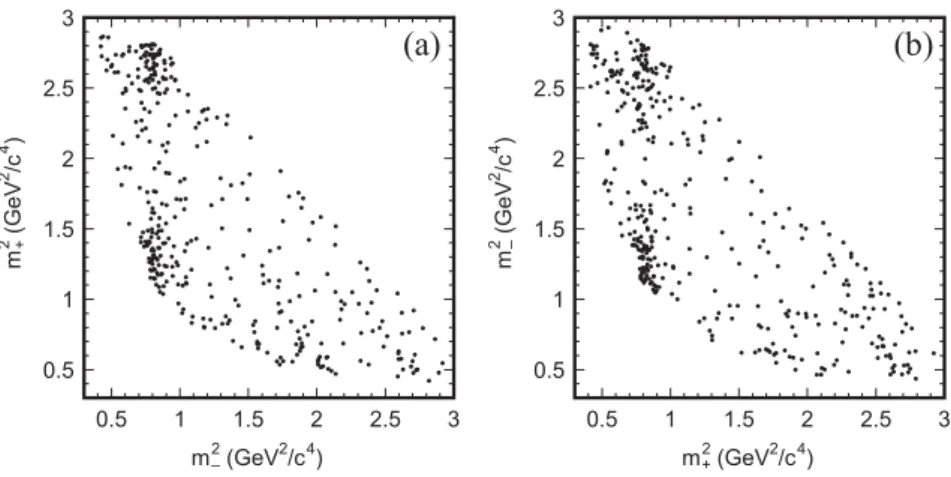
15. Data from Belle
16on this final state are shown in fig. 7
(B
+→DK
+on the left, B
−→DK
−on the right), which present the Dalitz plot distributions
of the decay D
0 →K
Sπ
+π
−. As can be seen, the distributions are highly asymmetric under
the exchange of the pion charge, indicating that the interference between the D
0and ¯ D
0parts
0.5 1 1.5 2 2.5 3
0.5 1 1.5 2 2.5 3
m2–(GeV2/c4) m2 +(GeV2/c4)
(a)
0.5 1 1.5 2 2.5 3
0.5 1 1.5 2 2.5 3
m2+(GeV2/c4) m2 –(GeV2 /c4 )
(b)
Figure 7: Dalitz distributions ofD→KSπ+π−fromB+→DK+ (left) and fromB−→DK−(right).
has a good sensitivity to the angle φ
3. A confidence level analysis
12of the various extraction methods (as indicated) is shown in fig. 8. The combined fit yields a value for φ
3of (70
+14−21)
◦.
(deg) φ3
0 20 40 60 80 100 120 140 160 180
1 - CL
0.0 0.2 0.4 0.6 0.8 1.0
ICHEP 10
CKMf i t t e r
Full Frequentist treatment on MC basis
D(*) K(*) GLW + ADS
D(*) K(*) GGSZ Combined CKM fit
WA
Figure 8: Confidence level distribution12for the angle φ3.
3.4 Measurement of Direct CP Violation
As was mentioned above, direct CP violation manifests itself, e.g., in a non-vanishing
Afterm of the time-dependent analysis, such as for the π
+π
−case shown in fig. 5. In this channel the interesting feature was a mild discrepancy between Belle and BaBar, although the average value resulting for φ
2was in agreement with the unitarity property of the B-triangle, i.e. in agreement with the SM. There is, however, a tantalizing indication of a possible deviation from the SM in the direct CP violation (Br(B
→f )
6=Br( ¯ B
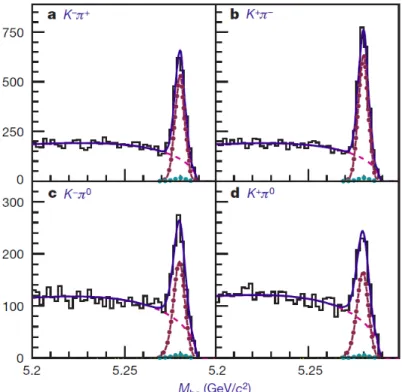
→f ¯ ) of the charged and neutral B meson decaying into a kaon and a pion. Direct CP violation can be observed simply by counting the number of B( ¯ B) leading to the final state f ( ¯ f). Such a counting experiment
17is shown in fig. 9, Here, the invariant masses of the Kπ system are plotted in the various charge combinations, coming from the ¯ B
0(a), B
0(b), B
−(c) and B
+(d). Direct CP violation is defined by the ratio
A
CP= N ( ¯ B )
−N (B ) N ( ¯ B ) + N (B ) ,
where the numbers of B mesons are given by the signal yields N , represented by the dashed-
dotted Gaussians. Direct CP violation (A
CP 6= 0) is evident for both the neutral (upper row)Figure 9: Distributions of the invariant (Kπ) masses for the charged B∓mesons (lower row) compared to their neutral partners ¯B0, B0 (upper row). The dotted-dashed lines represent the respective signal contributions.
and the charged (lower row) B mesons. What is surprising and unexpected, however, is the relative sign of this CP asymmetry: While A
CPis negative for the neutral B mesons, it is positive for the charged B mesons. Since the charged and neutral B mesons only differ by a light companion anti-quark to the flavor defining b-quark, the CP asymmetries should have the same sign. Quantitatively, the effect is established at the 4.4 σ level. There are a number of theoretical speculations about the possible origin
17of this discrepancy, one of them being a possible sign of New Physics beyond the Standard Model.
There is another effect in the like-sign muon pair production reported at this conference from the D0 experiment
18at Fermilab. Here, a CP violation via mixing is observed, in disagreement with the SM prediction at the 3.2 σ level. This effect may also be interpreted as a sign for New Physics and will need further investigation with higher statistics in the same way as the CP violation puzzles in the B system. For the latter, an ambitious project, SuperKEKB, is underway
19, scheduled to start operation in the year 2014 and providing a 50-fold increased integrated luminosity by the year 2020 compared to the world-record number of KEKB.
4 Conclusions
Flavor physics continues to be the key to the puzzle of the observed matter-antimatter asym-
metry in the universe, intimately connected to CP violation. CP violation effects in the B
meson has been beautifully established by the B factories. These measurements provide a con-
sistent picture within the framework of the SM, nicely supporting the CKM model of a unitary
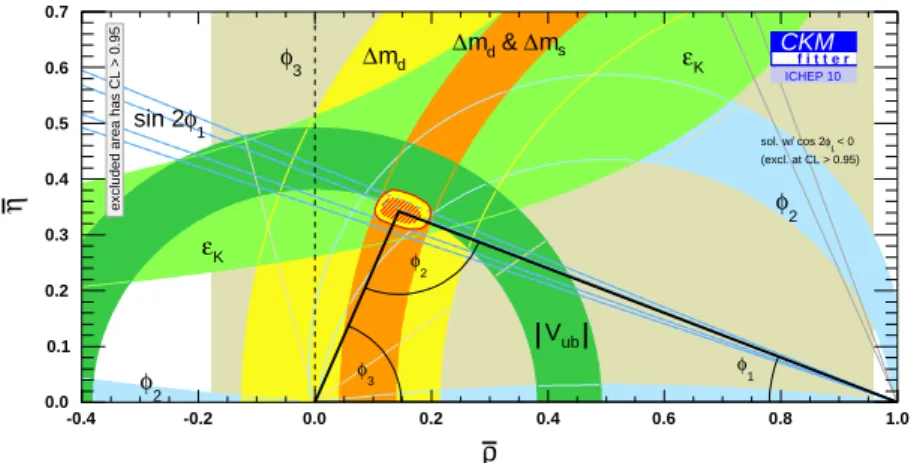
B-triangle (see
12, e.g., fig. 10). However, some “tensions” exist comparing theory with exper-
iment, suggesting possible hints for New Physics beyond the Standard Model. While the full
statistics of the B-Factories are being analyzed presently, a new generation of Super Flavor Fac-
tories, running in parallel with the LHC experiments, is being planned and which will have the
potential to probe the Standard Model at energy scales beyond several tens of TeV.
φ3
φ2
φ2
md
∆
εK
εK
ms
∆ &
md
∆
Vub
φ1
sin 2
(excl. at CL > 0.95) < 0 φ1 sol. w/ cos 2
φ2
φ1
φ3
ρ
-0.4 -0.2 0.0 0.2 0.4 0.6 0.8 1.0
η
0.0 0.1 0.2 0.3 0.4 0.5 0.6 0.7
excluded area has CL > 0.95
ICHEP 10
CKM
f i t t e r
Figure 10: Fit of the available measurements on CP violation to the unitaryB triangle. The yellow area at the apex represents the 95 % CL contour.
Acknowledgments
The author is very much indebted to the organizers of the Rencontres de Blois for the excellent preparation and smooth running of the meeting, held in the absolutely gorgeous castle and town of Blois, and for creating a very warm and relaxed, but nevertheless highly stimulating, atmosphere of scientific discussions. He also wishes to thank Karim Trabelsi for his careful reading of the manuscript and his valuable advice.
References