arXiv:2011.00793v1 [hep-ex] 2 Nov 2020
Measurement of time-dependent CP violation parameters in B 0 → K S 0 K S 0 K S 0 decays at Belle
K. H. Kang, 42 H. Park, 42 T. Higuchi, 36 K. Miyabayashi, 56 K. Sumisawa, 18, 14 I. Adachi, 18, 14 J. K. Ahn, 41 H. Aihara, 87 S. Al Said, 80, 38 D. M. Asner, 4 V. Aulchenko, 5, 64 T. Aushev, 20 R. Ayad, 80 V. Babu, 9 S. Bahinipati, 24 A. M. Bakich, 79 P. Behera, 26 C. Bele˜ no, 13 J. Bennett, 51 V. Bhardwaj, 23 T. Bilka, 6 J. Biswal, 34
G. Bonvicini, 91 A. Bozek, 60 M. Braˇcko, 48, 34 T. E. Browder, 17 M. Campajola, 31, 55 L. Cao, 3 D. ˇ Cervenkov, 6 M.-C. Chang, 10 V. Chekelian, 49 A. Chen, 57 B. G. Cheon, 16 K. Chilikin, 44 K. Cho, 40 S.-K. Choi, 15 Y. Choi, 78
D. Cinabro, 91 S. Cunliffe, 9 N. Dash, 24 G. De Nardo, 31, 55 Z. Doleˇzal, 6 T. V. Dong, 11 S. Eidelman, 5, 64, 44 J. E. Fast, 67 T. Ferber, 9 B. G. Fulsom, 67 R. Garg, 68 V. Gaur, 90 N. Gabyshev, 5, 64 A. Garmash, 5, 64 A. Giri, 25
P. Goldenzweig, 35 B. Golob, 45, 34 D. Greenwald, 82 Y. Guan, 8 O. Hartbrich, 17 K. Hayasaka, 62 H. Hayashii, 56 M. Hernandez Villanueva, 51 W.-S. Hou, 59 C.-L. Hsu, 79 K. Inami, 54 G. Inguglia, 29 A. Ishikawa, 18, 14 M. Iwasaki, 66 Y. Iwasaki, 18 W. W. Jacobs, 27 E.-J. Jang, 15 H. B. Jeon, 42 S. Jia, 2 Y. Jin, 87 K. K. Joo, 7 A. B. Kaliyar, 81 G. Karyan, 9
T. Kawasaki, 39 H. Kichimi, 18 C. Kiesling, 49 C. H. Kim, 16 D. Y. Kim, 77 K.-H. Kim, 93 S. H. Kim, 16 Y.-K. Kim, 93 K. Kinoshita, 8 P. Kodyˇs, 6 S. Korpar, 48, 34 D. Kotchetkov, 17 P. Kriˇzan, 45, 34 R. Kroeger, 51 P. Krokovny, 5, 64
R. Kulasiri, 37 R. Kumar, 71 A. Kuzmin, 5, 64 Y.-J. Kwon, 93 J. S. Lange, 12 I. S. Lee, 16 S. C. Lee, 42 J. Li, 42 L. K. Li, 28 Y. B. Li, 69 L. Li Gioi, 49 J. Libby, 26 K. Lieret, 46 D. Liventsev, 90, 18 J. MacNaughton, 52 C. MacQueen, 50
M. Masuda, 86 T. Matsuda, 52 D. Matvienko, 5, 64, 44 M. Merola, 31, 55 H. Miyata, 62 R. Mizuk, 44, 20 G. B. Mohanty, 81 T. J. Moon, 74 T. Mori, 54 T. Morii, 36 M. Mrvar, 29 R. Mussa, 32 M. Nakao, 18, 14 H. Nakazawa, 59 Z. Natkaniec, 60 M. Nayak, 83 N. K. Nisar, 70 S. Nishida, 18, 14 K. Nishimura, 17 K. Ogawa, 62 S. Ogawa, 84 H. Ono, 61, 62 Y. Onuki, 87
P. Oskin, 44 P. Pakhlov, 44, 53 G. Pakhlova, 20, 44 S. Pardi, 31 S.-H. Park, 93 S. Patra, 23 S. Paul, 82 T. K. Pedlar, 47 R. Pestotnik, 34 L. E. Piilonen, 90 T. Podobnik, 45, 34 V. Popov, 20 E. Prencipe, 21 M. T. Prim, 35 M. V. Purohit, 65
M. Ritter, 46 M. R¨ ohrken, 9 A. Rostomyan, 9 N. Rout, 26 M. Rozanska, 60 G. Russo, 55 D. Sahoo, 81 Y. Sakai, 18, 14 S. Sandilya, 8 A. Sangal, 8 L. Santelj, 45, 34 T. Sanuki, 85 V. Savinov, 70 G. Schnell, 1, 22 J. Schueler, 17 C. Schwanda, 29 A. J. Schwartz, 8 Y. Seino, 62 K. Senyo, 92 M. E. Sevior, 50 M. Shapkin, 30 V. Shebalin, 17 J.-G. Shiu, 59 E. Solovieva, 44
S. Staniˇc, 63 M. Stariˇc, 34 Z. S. Stottler, 90 T. Sumiyoshi, 89 W. Sutcliffe, 3 M. Takizawa, 75, 19, 72 U. Tamponi, 32 K. Tanida, 33 F. Tenchini, 9 K. Trabelsi, 43 M. Uchida, 88 T. Uglov, 44, 20 Y. Unno, 16 S. Uno, 18, 14 P. Urquijo, 50 Y. Ushiroda, 18, 14 G. Varner, 17 A. Vinokurova, 5, 64 V. Vorobyev, 5, 64, 44 C. H. Wang, 58 E. Wang, 70 M.-Z. Wang, 59 P. Wang, 28 X. L. Wang, 11 S. Watanuki, 85 E. Won, 41 X. Xu, 76 B. D. Yabsley, 79 W. Yan, 73 S. B. Yang, 41 H. Ye, 9
J. H. Yin, 28 C. Z. Yuan, 28 Y. Yusa, 62 Z. P. Zhang, 73 V. Zhilich, 5, 64 V. Zhukova, 44 and V. Zhulanov 5, 64 (The Belle Collaboration)
1
University of the Basque Country UPV/EHU, 48080 Bilbao
2
Beihang University, Beijing 100191
3
University of Bonn, 53115 Bonn
4
Brookhaven National Laboratory, Upton, New York 11973
5
Budker Institute of Nuclear Physics SB RAS, Novosibirsk 630090
6
Faculty of Mathematics and Physics, Charles University, 121 16 Prague
7
Chonnam National University, Gwangju 61186
8
University of Cincinnati, Cincinnati, Ohio 45221
9
Deutsches Elektronen–Synchrotron, 22607 Hamburg
10
Department of Physics, Fu Jen Catholic University, Taipei 24205
11
Key Laboratory of Nuclear Physics and Ion-beam Application (MOE) and Institute of Modern Physics, Fudan University, Shanghai 200443
12
Justus-Liebig-Universit¨ at Gießen, 35392 Gießen
13
II. Physikalisches Institut, Georg-August-Universit¨ at G¨ ottingen, 37073 G¨ ottingen
14
SOKENDAI (The Graduate University for Advanced Studies), Hayama 240-0193
15
Gyeongsang National University, Jinju 52828
16
Department of Physics and Institute of Natural Sciences, Hanyang University, Seoul 04763
17
University of Hawaii, Honolulu, Hawaii 96822
18
High Energy Accelerator Research Organization (KEK), Tsukuba 305-0801
19
J-PARC Branch, KEK Theory Center, High Energy Accelerator Research Organization (KEK), Tsukuba 305-0801
20
Higher School of Economics (HSE), Moscow 101000
21
Forschungszentrum J¨ ulich, 52425 J¨ ulich
22
IKERBASQUE, Basque Foundation for Science, 48013 Bilbao
23
Indian Institute of Science Education and Research Mohali, SAS Nagar, 140306
24
Indian Institute of Technology Bhubaneswar, Satya Nagar 751007
25
Indian Institute of Technology Hyderabad, Telangana 502285
26
Indian Institute of Technology Madras, Chennai 600036
27
Indiana University, Bloomington, Indiana 47408
28
Institute of High Energy Physics, Chinese Academy of Sciences, Beijing 100049
29
Institute of High Energy Physics, Vienna 1050
30
Institute for High Energy Physics, Protvino 142281
31
INFN - Sezione di Napoli, 80126 Napoli
32
INFN - Sezione di Torino, 10125 Torino
33
Advanced Science Research Center, Japan Atomic Energy Agency, Naka 319-1195
34
J. Stefan Institute, 1000 Ljubljana
35
Institut f¨ ur Experimentelle Teilchenphysik, Karlsruher Institut f¨ ur Technologie, 76131 Karlsruhe
36
Kavli Institute for the Physics and Mathematics of the Universe (WPI), University of Tokyo, Kashiwa 277-8583
37
Kennesaw State University, Kennesaw, Georgia 30144
38
Department of Physics, Faculty of Science, King Abdulaziz University, Jeddah 21589
39
Kitasato University, Sagamihara 252-0373
40
Korea Institute of Science and Technology Information, Daejeon 34141
41
Korea University, Seoul 02841
42
Kyungpook National University, Daegu 41566
43
LAL, Univ. Paris-Sud, CNRS/IN2P3, Universit´e Paris-Saclay, Orsay 91898
44
P.N. Lebedev Physical Institute of the Russian Academy of Sciences, Moscow 119991
45
Faculty of Mathematics and Physics, University of Ljubljana, 1000 Ljubljana
46
Ludwig Maximilians University, 80539 Munich
47
Luther College, Decorah, Iowa 52101
48
University of Maribor, 2000 Maribor
49
Max-Planck-Institut f¨ ur Physik, 80805 M¨ unchen
50
School of Physics, University of Melbourne, Victoria 3010
51
University of Mississippi, University, Mississippi 38677
52
University of Miyazaki, Miyazaki 889-2192
53
Moscow Physical Engineering Institute, Moscow 115409
54
Graduate School of Science, Nagoya University, Nagoya 464-8602
55
Universit` a di Napoli Federico II, 80055 Napoli
56
Nara Women’s University, Nara 630-8506
57
National Central University, Chung-li 32054
58
National United University, Miao Li 36003
59
Department of Physics, National Taiwan University, Taipei 10617
60
H. Niewodniczanski Institute of Nuclear Physics, Krakow 31-342
61
Nippon Dental University, Niigata 951-8580
62
Niigata University, Niigata 950-2181
63
University of Nova Gorica, 5000 Nova Gorica
64
Novosibirsk State University, Novosibirsk 630090
65
Okinawa Institute of Science and Technology, Okinawa 904-0495
66
Osaka City University, Osaka 558-8585
67
Pacific Northwest National Laboratory, Richland, Washington 99352
68
Panjab University, Chandigarh 160014
69
Peking University, Beijing 100871
70
University of Pittsburgh, Pittsburgh, Pennsylvania 15260
71
Punjab Agricultural University, Ludhiana 141004
72
Theoretical Research Division, Nishina Center, RIKEN, Saitama 351-0198
73
University of Science and Technology of China, Hefei 230026
74
Seoul National University, Seoul 08826
75
Showa Pharmaceutical University, Tokyo 194-8543
76
Soochow University, Suzhou 215006
77
Soongsil University, Seoul 06978
78
Sungkyunkwan University, Suwon 16419
79
School of Physics, University of Sydney, New South Wales 2006
80
Department of Physics, Faculty of Science, University of Tabuk, Tabuk 71451
81
Tata Institute of Fundamental Research, Mumbai 400005
82
Department of Physics, Technische Universit¨ at M¨ unchen, 85748 Garching
83
School of Physics and Astronomy, Tel Aviv University, Tel Aviv 69978
84
Toho University, Funabashi 274-8510
85
Department of Physics, Tohoku University, Sendai 980-8578
86
Earthquake Research Institute, University of Tokyo, Tokyo 113-0032
87
Department of Physics, University of Tokyo, Tokyo 113-0033
88
Tokyo Institute of Technology, Tokyo 152-8550
89
Tokyo Metropolitan University, Tokyo 192-0397
90
Virginia Polytechnic Institute and State University, Blacksburg, Virginia 24061
91
Wayne State University, Detroit, Michigan 48202
92
Yamagata University, Yamagata 990-8560
93
Yonsei University, Seoul 03722
We measure the time-dependent CP violation parameters in B
0→ K
S0K
S0K
S0decays using 772 × 10
6BB pairs collected at the Υ(4S) resonance with the Belle detector at the KEKB asymmetric-energy e
+e
−collider. The obtained mixing-induced and direct CP asymmetries are
−0.71 ± 0.23 (stat) ± 0.05 (syst) and 0.12 ± 0.16 (stat) ± 0.05 (syst), respectively. These values are consistent with the Standard Model predictions. The significance of CP violation differs from zero by 2.5 standard deviations.
PACS numbers: 13.20.He, 14.40.Nd
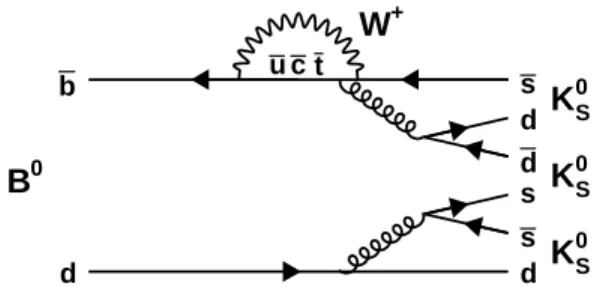
In the Standard Model (SM), CP violation in the quark sector is described by an irreducible phase in the Kobayashi-Maskawa (KM) mechanism [1]. The charm- less three-body decay B 0 → K S 0 K S 0 K S 0 is mediated by the b → sqq quark transition, which is prohibited in the lowest-order SM interaction. Instead, this CP-even de- cay occurs via a “penguin” amplitude, as shown in Fig. 1.
Deviations from the SM expectations for CP -violating parameters provide sensitivity to new physics [2].
Time-dependent CP violation can be caused by inter- ference between the decay and mixing amplitudes. When one of the neutral B mesons produced from the Υ(4S ) de- cays into a CP eigenstate, f CP , at time t CP , and the other into a flavor-distinguishable final state, f tag , at time t tag , the time-dependent decay rate is given by [3]
P (∆t) = e −|∆t|/τ
B04τ B
0×
(1 + q[S sin(∆m d ∆t) + A cos(∆m d ∆t)]), (1)
where ∆t ≡ t CP − t tag , measured in the center-of-mass (CM) frame, and the CP -violating parameters S and A are related to mixing-induced and direct CP viola- tion, respectively. Here the flavor q is +1 (−1) for B 0 (B 0 ), τ B
0is the B 0 lifetime, and ∆m d is the mass dif- ference between the two mass eigenstates of the B 0 -B 0 system. The SM predicts that S = − sin 2φ 1 and A = 0 in B 0 → K S 0 K S 0 K S 0 , where φ 1 ≡ arg[−V cd V cb ∗ /V td V tb ∗ ] [4].
Previous measurements of S at Belle and BaBar have yielded values of −0.30 ± 0.32 (stat) ± 0.08 (syst) using 535 × 10 6 BB pairs, and −0.94 +0.24 −0.21 (stat) ± 0.06 (syst) using 468 × 10 6 BB pairs, respectively [5, 6]. To search for physics beyond the SM containing a new CP -violating phase, we measure S and A in B 0 → K S 0 K S 0 K S 0 decays with the final Belle data set of 772 × 10 6 BB pairs.
The Belle detector is a large-solid-angle magnetic spec- trometer that consists of a silicon vertex detector (SVD), a 50-layer central drift chamber (CDC), an array of aero-
B 0
b
d
s d d s s d
S
K 0
S
K 0
S
K 0
u c t W +
FIG. 1. Penguin amplitude for the B
0→ K
S0K
S0K
S0decays.
gel threshold Cherenkov counters (ACC), a barrel-like ar- rangement of time-of-flight scintillation counters (TOF), and an electromagnetic calorimeter comprised of CsI(Tl) crystals (ECL). These detector components are located inside a superconducting solenoid coil that provides a 1.5 T magnetic field. An iron flux-return located outside the magnetic coil is instrumented to detect K L 0 mesons and identify muons (KLM). The detector is described in detail elsewhere [7]. Two inner detector configurations were used. A 2.0 cm radius beampipe with a double-wall beryllium structure and a three-layer SVD were used for the first sample of 152 × 10 6 BB pairs, while a 1.5 cm radius beampipe, a four-layer SVD and a small-inner-cell CDC were used to record the remaining 620 × 10 6 BB pairs [8]. The latter data sample has been reprocessed with improved software, which incorporates an improved vertex reconstruction [9, 10].
The Υ(4S) is produced at the KEKB asymmetric- energy e + e − collider [11] with a Lorentz boost (βγ) of 0.425; it subsequently decays to B and B mesons, which are nearly at rest in the CM frame. The Lorentz boost introduces a sufficient distance between the B and B de- cay vertices to be measurable nearly along with the z axis, which is antiparallel to the e + beam direction. The distance is related to ∆t ≈ (z CP − z tag )/cβγ, where z CP
and z tag are the coordinates of the decay positions of f CP
and f tag , respectively. To avoid the large backgrounds ac- companying γ and π 0 detection, we reconstruct the K S 0 only through its decay to two charged pions. The event selection and measurement of CP violation parameters are optimized using Monte Carlo (MC) events. The MC events are generated by E VT G EN [12], and the detector response is modeled using G EANT 3 [13]. We simulate the B-meson decay to three K S 0 as uniformly distributed in the available phase space.
The K S 0 is selected from charged pion pairs using a neural network (NN) [14, 15] with 13 inputs: the K S 0 momentum in the lab frame (> 0.06 GeV/c); the distance between the pion tracks in the z-direction (< 20 cm); the flight length in the x-y plane; the angle between the K S 0 momentum and the vertex displacement vector; the angle between the K S 0 momentum and the pion momentum;
for each daughter pion, the distance of closest approach to the interaction point (IP); the existence of the SVD hits; and the number of axial- and stereo-wire hits in the CDC. The mass ranges allowed are 0.474 GeV/c 2
< M (π + π − ) < 0.522 GeV/c 2 when only one pion hits the SVD, and 0.478 GeV/c 2 < M (π + π − ) < 0.517 GeV/c 2 otherwise.
To identify the signal B-decay, we use the energy differ- ence ∆E ≡ E beam −E B and the beam-energy-constrained mass M bc ≡ p
(E beam ) 2 − |~ p B | 2 c 2 /c 2 , where E beam is the beam energy, and E B and ~ p B are the energy and momen- tum, respectively, of the B 0 candidate. All quantities are evaluated in the CM frame. The B 0 candidates are re- quired to lie in the region of M bc > 5.2 GeV/c 2 and
|∆E| < 0.2 GeV.
We find that seven percent of the events have more than one B 0 candidate. When there are multiple B 0 candidates in an event, we choose the one with the small- est χ 2 as defined by χ 2 = P 3
i=1 [(M i (π + π − )−m K
0S)/σ i ] 2 , where M i (π + π − ) and σ i are the invariant mass and mass resolution for the i-th K S 0 , respectively, and m K
0Sis the nominal K S 0 mass [16].
The dominant source of background is continuum e + e − → qq (q = u, d, s, c) events. To suppress this background, we use another NN with the following in- puts: the cosine of the polar angle of the B 0 -candidate flight direction in the CM frame (cos θ B ); the cosine of the angle between the thrust axis of the B 0 can- didate and that of the rest of the event (cos θ T ); and a likelihood ratio obtained from modified Fox-Wolfram moments [17]. The NN outputs (O NN ) range between +1 and −1, where O NN close to +1 (−1) indicates a signal-like (background-like) event. The O NN criterion is obtained by maximizing a figure-of-merit (FOM = N sig / p
N sig + N qq ), where N sig and N qq are the num- ber of signal and continuum MC events. The FOM is maximal at the value of O NN = 0.08. The signal re- gion is defined as M bc > 5.27 GeV/c 2 and |∆E| < 0.1 GeV. The O NN requirement retains 81% of the signal
and reduces continuum background by a factor of 10 in the signal region.
The O NN is transformed by using the formula O ′ NN = log( O NN − O NN,min
O NN,max − O NN
). (2)
The value of O NN,min is selected to be 0.08, thus max- imizing the FOM. The value of O NN,max is set to 0.99, the highest observed value of O NN .
Among the B 0 → K S 0 K S 0 K S 0 decays, there are quasi- two-body intermediate states, where both b → c and b → s transitions contribute. The former contami- nates the measurement of CP violation in b → s tran- sitions. Among possible b → c transition-induced B decays, we expect significant contributions solely from B 0 → χ c0 (χ c0 → K S 0 K S 0 )K S 0 decays; this contribution is estimated to be 16.3 ± 3.1 events. We use the invariant mass, M K
S0K
S0, to veto B 0 → χ c0 K S 0 decays: we reject the B 0 candidate if any K S 0 pair among its decay products has an invariant mass within ±2σ of the nominal mass, where σ is the reconstructed χ c0 mass resolution from simulation. The veto range is 3.388 GeV/c 2 < M K
0SK
S0<
3.444 GeV/c 2 , and this removes 83% of the B 0 → χ c0 K S 0 decays.
To identify the B meson flavor, a flavor tagging al- gorithm [18] is used that utilizes inclusive properties of particles not associated with the signal decay. This al- gorithm returns the value of q (defined earlier) and a tagging quality variable r. The latter varies from r = 0 for no tagging information to r = 1 for unambiguous fla- vor assignment. The probability density function (PDF) for signal events modifies Eq. (1) by taking the wrong-tag fraction, w, and its difference between B 0 and B 0 , ∆w, into account:
P sig (∆t, q) = e −|∆t|/τ
B04τ B
01 + q∆w + (1 − 2w)q
×[S sin(∆m d ∆t) + A cos(∆m d ∆t)]
. (3)
The events are categorized into seven r bins. For each of these bins, w and ∆w are determined by high statistics flavor-specific B meson decays [10].
The parameter ∆t in Eq. (3) is determined through vertex reconstruction for the signal B 0 (B CP ) and the accompanying B 0 (B tag ). For reconstruction of the B CP
vertex, we use those K S 0 trajectories in which both daugh- ter pions have SVD hits in the z direction. B CP can have up to three K S 0 that satisfy this requirement. According to the signal MC, 14% of events do not have any K S 0 producing sufficient SVD hits. The IP information is in- corporated as a virtual straight track along the z axis, called the “IP tube”, to provide a constraint for kine- matical fits to reconstruct the B decay vertex. The B CP
vertex is obtained from the available K S 0 trajectories and
the IP tube. The IP tube is also used to reconstruct the B tag vertex using the charged tracks not assigned to B CP , as described in more detail in Ref. [19]. Because of this treatment, we can reconstruct the B CP (B tag ) vertex with only one K S 0 trajectory (charged track).
Events with poorly reconstructed vertices are rejected by requiring:
(1) |∆t| < 70 ps;
(2) a vertex quality for each of B CP and B tag of less than 50, when the vertex is constrained by multiple tracks; and
(3) uncertainties on the z position of the vertices for both B CP and B tag of less than 0.2 mm when the vertex is constrained by multiple tracks, and less than 0.5 mm when the B CP (B tag ) vertex is con- strained by a single K S 0 trajectory (single track).
The vertex quality is χ 2 per degree of freedom, where χ 2 is obtained from the vertex fit without the IP tube constraint. After the poorly reconstructed events are dis- carded, the remaining data events amount to 73% of the total number of events in the signal region.
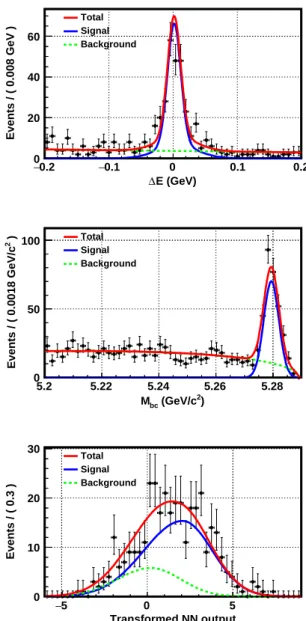
We determine the signal yield by performing an ex- tended unbinned maximum-likelihood fit. The fit is done in the ∆E-M bc -O ′ NN three-dimensional space, with each PDF expressed as the product of the one-dimensional PDFs. The signal PDFs are modeled as a double Gaus- sian, a Gaussian, and an asymmetric Gaussian, respec- tively, and the background PDFs are modeled as a first- order polynomial, an ARGUS function [20], and an asym- metric Gaussian, respectively. The parameters of the sig- nal PDF are fixed according to fits to the signal MC; the parameters of the background PDF are left free in the fit. The fit result is shown in Fig. 2. In the signal region, the signal yield is 258 ± 17 events and the purity is 74%, where −4.72 < O NN ′ < 7.24 is further required for the signal region.
We determine the CP -violating parameters A and S by performing a second unbinned maximum-likelihood fit. The contribution to the likelihood function from the jth event is
P j = (1 − f ol ) ×
f j sig Z
d(∆t ′ )R(∆t j − ∆t ′ )×
P sig (∆t ′ , q j )
+ (1 − f j sig )P bkg (∆t j )
+ f ol P ol (∆t j ),
(4)
where R(∆t) is a resolution function. The resolution function consists of three components: detector resolu- tions for B CP and B tag , nonprimary track effects for B tag , and a kinematical approximation due to the difference in the lab momentum of B CP and B tag owing to non-zero
E (GeV)
∆
− 0.2 − 0.1 0 0.1 0.2
Events / ( 0.008 GeV )
0 20 40 60
Total Signal Background
2
) (GeV/c M
bc5.2 5.22 5.24 5.26 5.28
)
2Events / ( 0.0018 GeV/c
0 50
100
TotalSignal Background
Transformed NN output
− 5 0 5
Events / ( 0.3 )
0 10 20
30
TotalSignal Background