Search for CP Violation in the Decay D + → K S 0 K +
Belle Collaboration
B. R. Ko
21E. Won
21I. Adachi
9H. Aihara
51K. Arinstein
3D. M. Asner
41T. Aushev
16A. M. Bakich
45K. Belous
14V. Bhardwaj
33B. Bhuyan
12A. Bondar
3G. Bonvicini
56A. Bozek
37M. Braˇ cko
26,17T. E. Browder
8V. Chekelian
27A. Chen
34P. Chen
36B. G. Cheon
7K. Chilikin
16R. Chistov
16K. Cho
20S.-K. Choi
6Y. Choi
44D. Cinabro
56J. Dalseno
27,47Z. Doleˇ zal
4D. Dutta
12S. Eidelman
3S. Esen
5H. Farhat
56J. E. Fast
41V. Gaur
46N. Gabyshev
3S. Ganguly
56R. Gillard
56Y. M. Goh
7B. Golob
24,17K. Hayasaka
32H. Hayashii
33Y. Hoshi
49W.-S. Hou
36H. J. Hyun
22T. Iijima
32,31A. Ishikawa
50Y. Iwasaki
9T. Julius
28J. H. Kang
58E. Kato
50C. Kiesling
27H. O. Kim
22J. B. Kim
21K. T. Kim
21M. J. Kim
22Y. J. Kim
20K. Kinoshita
5J. Klucar
17S. Korpar
26,17R. T. Kouzes
41P. Kriˇ zan
24,17P. Krokovny
3T. Kuhr
19T. Kumita
53A. Kuzmin
3Y.-J. Kwon
58Y. Li
55C. Liu
43D. Liventsev
9R. Louvot
23K. Miyabayashi
33H. Miyata
39R. Mizuk
16,29G. B. Mohanty
46A. Moll
27,47N. Muramatsu
42Y. Nagasaka
10E. Nakano
40M. Nakao
9E. Nedelkovska
27C. Ng
51N. Nellikunnummel
46S. Nishida
9K. Nishimura
8O. Nitoh
54S. Ogawa
48T. Ohshima
31S. Okuno
18C. Oswald
2P. Pakhlov
16,29G. Pakhlova
16H. Park
22H. K. Park
22T. K. Pedlar
25R. Pestotnik
17M. Petriˇ c
17L. E. Piilonen
55K. Prothmann
27,47M. Ritter
27M. R¨ ohrken
19H. Sahoo
8T. Saito
50Y. Sakai
9S. Sandilya
46L. Santelj
17T. Sanuki
50Y. Sato
50O. Schneider
23G. Schnell
1,11C. Schwanda
15A. J. Schwartz
5K. Senyo
57O. Seon
31M. E. Sevior
28M. Shapkin
14C. P. Shen
31T.-A. Shibata
52J.-G. Shiu
36A. Sibidanov
45F. Simon
27,47P. Smerkol
17Y.-S. Sohn
58E. Solovieva
16M. Stariˇ c
17T. Sumiyoshi
53G. Tatishvili
41Y. Teramoto
40K. Trabelsi
9T. Tsuboyama
9M. Uchida
52T. Uglov
16,30Y. Unno
7S. Uno
9C. Van Hulse
1P. Vanhoefer
27G. Varner
8C. H. Wang
35M.-Z. Wang
36P. Wang
13Y. Watanabe
18K. M. Williams
55Y. Yamashita
38C. C. Zhang
13V. Zhilich
3A. Zupanc
191
University of the Basque Country UPV/EHU, 48080 Bilbao, Spain
2
University of Bonn, 53115 Bonn, Germany
3
Budker Institute of Nuclear Physics SB RAS and Novosibirsk State University, Novosibirsk 630090, Russian Federation
4
Faculty of Mathematics and Physics, Charles University, 121 16 Prague, The Czech Republic
5
University of Cincinnati, Cincinnati, OH 45221, USA
6
Gyeongsang National University, Chinju 660-701, South Korea
7
Hanyang University, Seoul 133-791, South Korea
8
University of Hawaii, Honolulu, HI 96822, USA
9
High Energy Accelerator Research Organization (KEK), Tsukuba 305-0801, Japan
10
Hiroshima Institute of Technology, Hiroshima 731-5193, Japan
11
Ikerbasque, 48011 Bilbao, Spain
12
Indian Institute of Technology Guwahati, Assam 781039, India
13
Institute of High Energy Physics, Chinese Academy of Sciences, Beijing 100049, PR China
arXiv:1212.6112v2 [hep-ex] 22 Feb 2013
14
Institute for High Energy Physics, Protvino 142281, Russian Federation
15
Institute of High Energy Physics, Vienna 1050, Austria
16
Institute for Theoretical and Experimental Physics, Moscow 117218, Russian Federation
17
J. Stefan Institute, 1000 Ljubljana, Slovenia
18
Kanagawa University, Yokohama 221-8686, Japan
19
Institut f¨ ur Experimentelle Kernphysik, Karlsruher Institut f¨ ur Technologie, 76131 Karlsruhe, Germany
20
Korea Institute of Science and Technology Information, Daejeon 305-806, South Korea
21
Korea University, Seoul 136-713, South Korea
22
Kyungpook National University, Daegu 702-701, South Korea
23
Ecole Polytechnique F´ ´ ed´ erale de Lausanne (EPFL), Lausanne 1015, Switzerland
24
Faculty of Mathematics and Physics, University of Ljubljana, 1000 Ljubljana, Slovenia
25
Luther College, Decorah, IA 52101, USA
26
University of Maribor, 2000 Maribor, Slovenia
27
Max-Planck-Institut f¨ ur Physik, 80805 M¨ unchen, Germany
28
School of Physics, University of Melbourne, Victoria 3010, Australia
29
Moscow Physical Engineering Institute, Moscow 115409, Russian Federation
30
Moscow Institute of Physics and Technology, Moscow Region 141700, Russian Federation
31
Graduate School of Science, Nagoya University, Nagoya 464-8602, Japan
32
Kobayashi-Maskawa Institute, Nagoya University, Nagoya 464-8602, Japan
33
Nara Women’s University, Nara 630-8506, Japan
34
National Central University, Chung-li 32054, Taiwan
35
National United University, Miao Li 36003, Taiwan
36
Department of Physics, National Taiwan University, Taipei 10617, Taiwan
37
H. Niewodniczanski Institute of Nuclear Physics, Krakow 31-342, Poland
38
Nippon Dental University, Niigata 951-8580, Japan
39
Niigata University, Niigata 950-2181, Japan
40
Osaka City University, Osaka 558-8585, Japan
41
Pacific Northwest National Laboratory, Richland, WA 99352, USA
42
Research Center for Electron Photon Science, Tohoku University, Sendai 980-8578, Japan
43
University of Science and Technology of China, Hefei 230026, PR China
44
Sungkyunkwan University, Suwon 440-746, South Korea
45
School of Physics, University of Sydney, NSW 2006, Australia
46
Tata Institute of Fundamental Research, Mumbai 400005, India
47
Excellence Cluster Universe, Technische Universit¨ at M¨ unchen, 85748 Garching, Germany
48
Toho University, Funabashi 274-8510, Japan
49
Tohoku Gakuin University, Tagajo 985-8537, Japan
50
Tohoku University, Sendai 980-8578, Japan
51
Department of Physics, University of Tokyo, Tokyo 113-0033, Japan
52
Tokyo Institute of Technology, Tokyo 152-8550, Japan
53
Tokyo Metropolitan University, Tokyo 192-0397, Japan
54
Tokyo University of Agriculture and Technology, Tokyo 184-8588, Japan
55
CNP, Virginia Polytechnic Institute and State University, Blacksburg, VA 24061, USA
56
Wayne State University, Detroit, MI 48202, USA
57
Yamagata University, Yamagata 990-8560, Japan
58
Yonsei University, Seoul 120-749, South Korea
Abstract:
We search for CP violation in the decay D
+→ K
S0K
+using a data sample with
an integrated luminosity of 977 fb
−1collected with the Belle detector at the KEKB e
+e
−asymmetric-energy collider. No CP violation has been observed and the CP asymmetry in
D
+→ K
S0K
+decay is measured to be ( − 0.25 ± 0.28 ± 0.14)%, which is the most sensitive
measurement to date. After subtracting CP violation due to K
0− K ¯
0mixing, the CP
asymmetry in D
+→ K ¯
0K
+decay is found to be (+0.08 ± 0.28 ± 0.14)%.
Contents
1 Introduction 1
2 Methodology 3
3 Data and event selections 4
4 Extraction of A
CPin the decay D
+→ K
S0K
+6
5 Systematic uncertainty 7
6 Results 8
7 Conclusion 9
1 Introduction
Studies of CP violation in charmed meson decays provide a promising opportunity to search for new physics beyond the standard model (SM) [1] in the absence of disagreement between experimental measurements and the SM interpretation of CP violation in K and B meson decays [2–4]. Recently, the LHCb collaboration has reported ∆A
CP= ( − 0.82 ± 0.21 ± 0.11)% [5] where ∆A
CPis the CP asymmetry difference between D
0→ K
+K
− 1and D
0→ π
+π
−decays. Thereafter, the CDF collaboration has also announced ∆A
CP= ( − 0.62 ± 0.21 ± 0.10)% [6], which strongly supports the non-zero ∆A
CPmeasured from the LHCb collaboration. Together with results from the BaBar and Belle collaborations, the value of ∆A
CPis significantly different from zero [7]. Taking into account that the indirect CP asymmetries in the two decays are approximately equal [8], ∆A
CPcan be expressed as
∆A
CP= ∆a
dirCP+ a
indCP∆ h t i /τ, (1.1) where a
dirCPand a
indCPdenote direct and indirect CP violation, respectively, and h t i /τ is the mean proper decay time of the selected signal sample in units of the D
0lifetime [9].
The factor ∆ h t i /τ in eq. (1.1) depends on the experimental conditions and the largest value reported to date is 0.26 ± 0.01 from the CDF measurement [6]. Therefore, ∆A
CPreveals a significant direct CP violation difference between the two decays. Within the SM, direct CP violation in the charm sector is expected to be present only in singly Cabibbo- suppressed (SCS) decays, and even there is expected to be small, O (0.1%) [10]. Hence, the current ∆A
CPmeasurements engender questions of whether the origin of the asymmetry lies within [11–14] or beyond [15–18] the SM. The origin of ∆A
CPcalls for the precise
1
Throughout this paper, the charge-conjugate decay modes are implied unless stated otherwise.
measurements of A
CPin D
0→ K
+K
−and D
0→ π
+π
−. A complementary test is a precise measurement of A
CPin another SCS charmed hadron decay, D
+→ K ¯
0K
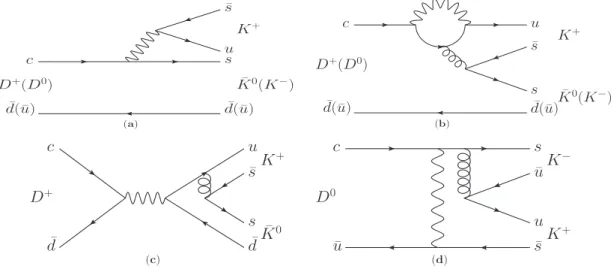
+, as suggested in ref. [13]. As shown in figures 1(a) and 1(b), the decay D
+→ K ¯
0K
+shares the same
D+(D0) c
d(¯¯u) d(¯¯u) su
¯ s
K¯0(K−) K+
(a)
D
+(D
0) c
d(¯ ¯ u) d(¯ ¯ u) s
¯ s u
K ¯
0(K
−) K
+(b)
D
+c
d ¯ d ¯
s
¯ s u
K ¯
0K
+(c)
D
0c
¯
u s ¯
u
¯ u s
K
+K
−(d)
Figure 1. Feynman diagrams of D
+→ K ¯
0K
+and D
0→ K
+K
−decays.
decay diagrams with D
0→ K
+K
−by exchanging the spectator quarks, d ↔ u. Although there are additional contributions to the two decays as shown in figures 1(c) and 1(d), these are expected to be small due to helicity- and color-suppression considerations
2. Therefore, neglecting the latter contributions in D
+→ K ¯
0K
+and D
0→ K
+K
−decays, the direct CP asymmetries in the two decays are expected to be the same.
In this paper, we report results from a search for CP violation in the decay D
+→ K
S0K
+that originates from D
+→ K ¯
0K
+decay, where K
S0decays to π
+π
−. The CP asymmetry in the decay, A
CP, is then defined as
A
DCP+→KS0K+≡ Γ(D
+→ K ¯
0K
+)Γ( ¯ K
0→ π
+π
−) − Γ(D
−→ K
0K
−)Γ(K
0→ π
+π
−) Γ(D
+→ K ¯
0K
+)Γ( ¯ K
0→ π
+π
−) + Γ(D
−→ K
0K
−)Γ(K
0→ π
+π
−)
= A
DCP+→K¯0K++ A
KCP¯01 + A
DCP+→K¯0K+A
KCP¯0' A
DCP+→K¯0K++ A
KCP¯0, (1.2) where Γ is the partial decay width. In eq. (1.2), A
DCP+→K¯0K+is the CP asymmetry in the decay D
+→ K ¯
0K
+and A
KCP¯0is that in ¯ K
0→ π
+π
−decay induced by K
0− K ¯
0mixing in the SM [19–21] in which the decay ¯ K
0→ π
+π
−arises from K
S0→ π
+π
−together with a small contribution from K
L0→ π
+π
−, where the latter is known precisely from K
L0semileptonic decays, A
KCP¯0= ( − 0.332 ± 0.006)% [2]. As shown in eq. (1.2), the product of the two small asymmetries is neglected. The D
+decaying to the final state K
S0K
+proceeds from D
+→ K ¯
0K
+decay, which is SCS. In the SM, direct CP violation in SCS charmed meson decays is predicted to occur with a non-vanishing phase that enters the diagram
2
In helicity suppression, a spinless meson decaying to a back-to-back quark-antiquark pair is suppressed by the conservation of angular momentum. In color suppression, the final state quarks are required to carry the correct color charge in order for the final state to be colorless.
– 2 –
shown in figure 1(b) in the Kobayashi-Maskawa ansatz [22]. The current average of ∆A
CPfavors a negative value of direct CP violation in D
0→ K
+K
−decay. Correspondingly, the CP asymmetry in D
+→ K
S0K
+decays is more likely to have a negative value since the two CP asymmetry terms shown in eq. (1.2) are negative.
2 Methodology We determine A
D+→KS0K+
CP
by measuring the asymmetry in the signal yield
A
D+→K0SK+
rec
= N
D+→KS0K+
rec
− N
D−→KS0K− rec
N
D+→K0 SK+
rec
+ N
D−→KS0K− rec
, (2.1)
where N
recis the number of reconstructed decays. The asymmetry in eq. (2.1) includes the forward-backward asymmetry (A
F B) due to γ
∗-Z
0interference and higher order QED effects in e
+e
−→ c¯ c [23–25], and the detection efficiency asymmetry between K
+and K
−(A
K +) as well as A
CP. In addition, ref. [26] calculates another asymmetry source, denoted A
D, due to the differences in interactions of ¯ K
0and K
0mesons with the material of the detector. Since we reconstruct the K
S0with π
+π
−combinations, the π
+π
−detection asymmetry cancels out for K
S0. The asymmetry of eq. (2.1) can be written as
A
D+→KS0K+
rec
(cos θ
Dc.m.s.+, p
labT K+, cos θ
labK+, p
labK0S
) = A
D+→KS0K+
CP
+ A
DF B+(cos θ
Dc.m.s.+) + A
K +(p
labT K+, cos θ
labK+) + A
D(p
labK0S
) (2.2) by neglecting the terms involving the product of asymmetries. In eq. (2.2), A
D+→KS0K+
CP
is
the sum of A
DCP+→K¯0K+and A
KCP¯0as stated in eq. (1.2), where the former is independent of all kinematic variables while the latter is known to depend on the K
S0decay time according to ref. [27], and A
DF B+is an odd function of the cosine of the polar angle θ
c.m.s.D+of the D
+momentum in the center-of-mass system (c.m.s.). A
K +depends on the transverse momentum p
labT K+and the polar angle θ
labK+of the K
+in the laboratory frame (lab). Here, A
Dis a function of the lab momentum p
labK0S
of the K
S0. To correct for A
K +in eq. (2.2), we use the technique developed in our previous publication [28]. We use D
0→ K
−π
+and D
+s→ φπ
+decays where the φ is reconstructed with K
+K
−combinations and hence the K
+K
−detection asymmetry nearly cancels out [29] (the residual small effect is included in the systematic error). Since these are Cabibbo-favored decays for which the direct CP asymmetry is expected to be negligible, in analogy to eq. (2.2), A
Drec0→K−π+and A
D+ s→φπ+ rec
can be written as
A
Drec0→K−π+(cos θ
Dc.m.s.0, p
labT K−, cos θ
Klab−, p
labT π+, cos θ
labπ+) = A
DF B0(cos θ
c.m.s.D0) + A
K −(p
labT K−, cos θ
labK−) + A
π+(p
labT π+, cos θ
labπ+), (2.3) A
Drec+s→φπ+(cos θ
c.m.s.D+s
, p
labT π+, cos θ
labπ+) = A
DF B+s(cos θ
c.m.s.D+ s)
+ A
π+(p
labT π+, cos θ
labπ+). (2.4)
Thus, with the additional A
K −term in A
Drec0→K−π+, one can measure A
K −by subtracting A
Drec+s→φπ+from A
Drec0→K−π+, assuming the same A
F Bfor D
0and D
+smesons. We also obtain A
Daccording to ref. [26]. After these A
K +and A
Dcorrections
3, we obtain
A
D+→KS0Kcorr+
rec
(cos θ
Dc.m.s.+) = A
D+→KS0K+
CP
+ A
DF B+(cos θ
Dc.m.s.+). (2.5) We subsequently extract A
CPand A
F Bas a function of cos θ
c.m.s.D+by taking sums and differences:
A
D+→KS0K+
CP
( | cos θ
c.m.s.D+| ) = A
D+→KS0K+corr
rec
(+ cos θ
Dc.m.s.+) + A
D+→KS0Kcorr+
rec
( − cos θ
c.m.s.D+)
2 ,
(2.6a) A
DF B+( | cos θ
Dc.m.s.+| ) = A
D+→KS0Kcorr+
rec
(+ cos θ
c.m.s.D+) − A
D+→KS0Kcorr+
rec
( − cos θ
Dc.m.s.+)
2 . (2.6b)
Note that extracting A
CPin eq. (2.5) using eq. (2.6a) is crucial here to cancel out the Belle detector’s asymmetric acceptance in cos θ
c.m.s.D+.
3 Data and event selections
The data used in this analysis were recorded at the Υ(nS) resonances (n = 1, 2, 3, 4, 5) or near the Υ(4S) resonance with the Belle detector at the e
+e
−asymmetric-energy collider KEKB [30]. The data sample corresponds to an integrated luminosity of 977 fb
−1. The Belle detector is a large solid angle magnetic spectrometer that consists of a silicon vertex detector (SVD), a 50-layer central drift chamber (CDC), an array of aerogel threshold Cherenkov counters (ACC), a barrel-like arrangement of time-of-flight scintillation counters (TOF), and an electromagnetic calorimeter comprising CsI(Tl) crystals located inside a superconducting solenoid coil that provides a 1.5 T magnetic field. An iron flux return located outside the coil is instrumented to detect K
L0mesons and to identify muons. A detailed description of the Belle detector can be found in ref. [31].
Except for the tracks from K
S0decays we require charged tracks to originate from the vicinity of the interaction point (IP) by limiting the impact parameters along the beam direction (z-axis) and perpendicular to it to less than 4 cm and 2 cm, respectively. All charged tracks other than those from K
S0decays are identified as pions or kaons by requiring the ratio of particle identification likelihoods, L
K/( L
K+ L
π), constructed using information from the CDC, TOF, and ACC, to be larger or smaller than 0.6, respectively [32]. For both kaons and pions, the efficiencies and misidentification probabilities are about 90% and 5%, respectively.
We form K
S0candidates adopting the standard Belle K
S0criteria [33], requiring the invariant mass of the charged track pair to be within [0.4826, 0.5126] GeV/c
2. The “loose”
K
S0candidates not satisfying these standard selections are also used in this analysis with additional requirements described later.
The K
S0and K
+candidates are combined to form a D
+candidate by fitting their tracks to a common vertex; the D
+candidate is fitted to the independently measured IP
3
We define
Ah+≡[N
h+−Nh−]/[N
h++
Nh−]. Hence
Ah−=
−Ah+.
– 4 –
profile to give the production vertex. To remove combinatorial background as well as D
+mesons that are produced in possibly CP -violating B meson decays, we require the D
+meson momentum calculated in the c.m.s. (p
∗D+) to be greater than 2.5 and 3.0 GeV/c for the data taken at the Υ(4S) and Υ(5S) resonances, respectively. For the data taken below Υ(4S), where no B mesons are produced, we apply the requirement p
∗D+>2.0 GeV/c. In addition to the selections described above, we further optimize the signal sensitivity with four variables: the goodness-of-fit values of the D
+decay- and production-vertex fits χ
2Dand χ
2P, the transverse momentum of the K
+in the lab p
labT K+, and the angle ξ between the D
+momentum vector (as reconstructed from its daughters) and the vector joining the D
+production and decay vertices. We optimize the requirement on these four variables with the standard and loose K
S0selections by maximizing N
S/ √
N
S+ N
B, where N
S+ N
Band N
Bare the yields in the K
S0K
+invariant mass signal ([1.860, 1.884] GeV/c
2) and sideband ([1.843, 1.855] and [1.889, 1.901] GeV/c
2) regions, respectively. The optimal set of (χ
2D, χ
2P, p
labT K+, ξ) requirements are found to be (<100, <10, >0.30 GeV/c, <40
◦), (<100,
<10, >0.25 GeV/c, <115
◦), and (<100, <10, >0.20 GeV/c, <125
◦) for the data taken below the Υ(4S), at the Υ(4S), and at the Υ(5S), respectively. Note that p
∗D+is highly correlated with p
labT K+and ξ; hence, a tighter p
∗D+requirement on the Υ(5S) sample results in looser p
labT K+and ξ requirements and vice versa for the data taken below the Υ(4S). The D
+candidates with the loose K
S0requirement are further optimized with two additional variables: the χ
2of the fit of tracks from the K
S0decay and the kaon from the D
+meson decay to a single vertex (χ
2Khh) and the angle ζ between the K
S0momentum vector (as reconstructed from its daughters) and the vector joining the D
+and K
S0decay vertices. The two variables are again varied simultaneously and the optimum is found to be χ
2Khh>6 and ζ<3
◦for all data. The inclusion of D
+candidates with the loose K
S0requirement improves the statistical sensitivity by approximately 5%. After the final selections described above, we find no significant peaking backgrounds—for example, D
+→ π
+π
−K
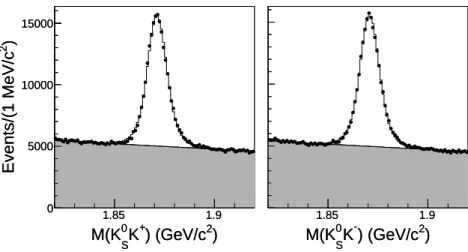
+decays—in the Monte Carlo (MC) simulated events [34]. Figure 2 shows the distributions of M(K
S0K
+) and M(K
S0K
−) together with the results of the fits described below.
Each D
±→ K
S0K
±signal is parameterized as two Gaussian distributions with a common mean. The combinatorial background is parameterized with the unnormalized form e
α+βM(K0SK±), where α and β are fit parameters. The asymmetry and the sum of the D
+and D
−yields are directly obtained from a simultaneous fit to the D
+and D
−candidate distributions. Besides the asymmetry and the sum of the D
+and D
−yields, the common parameters in the simultaneous fit are the widths of the two Gaussians and the ratio of their amplitudes. The asymmetry and the sum of the D
+→ K
S0K
+and D
−→ K
S0K
−yields from the fit are (+0.048 ± 0.275)% and 276812 ± 1156, respectively, where the errors are statistical.
In order to measure the CP asymmetry in D
+→ K
S0K
+decays, we must also re- construct D
0→ K
−π
+and D
s+→ φπ
+decays: see eqs. (2.2), (2.3), and (2.4). For the reconstruction of the D
0→ K
−π
+and D
+s→ φπ
+decays, we require the same track quality, particle identification, vertex fit quality, and p
∗Drequirements as used for the recon- struction of the D
+→ K
S0K
+decays, where the mass window for the φ is ± 16 MeV/c
2[29]
of the nominal φ mass [2].
2
) ) (GeV/c K
+S
M(K
01.85 1.9
)
2Events/(1 MeV/c
0 5000 10000 15000
2
) ) (GeV/c K
+S
M(K
01.85 1.9
)
2Events/(1 MeV/c
0 5000 10000 15000
2
) ) (GeV/c K
-S
M(K
01.85 1.9
0 5000 10000 15000
2
) ) (GeV/c K
-S
M(K
01.85 1.9
0 5000 10000 15000
Figure 2. Distributions of M (K
S0K
+) (left) and M (K
S0K
−) (right). Dots are the data while the histograms show the results of the parameterizations of the data. Open histograms represent the D
±→ K
S0K
±signal and shaded regions are combinatorial background.
4 Extraction of A
CPin the decay D
+→ K
S0K
+To obtain A
K +, we first extract A
D+ s→φπ+
rec
from a simultaneous fit to the mass distributions of D
s+and D
−scandidates with similar parameterizations as for D
±→ K
S0K
±decays except that, for the D
±s→ φπ
±signal description, a single Gaussian is used. The values of A
Drecs+→φπ+are evaluated in 10 × 10 × 10 bins of the three-dimensional (3D) phase space (p
labT π+, cos θ
labπ+, cos θ
c.m.s.Ds+
). Each D
0→ K
−π
+and ¯ D
0→ K
+π
−candidate is then weighted with a factor of 1 − A
D+ s→φπ+
rec
and 1 + A
D+ s→φπ+
rec
, respectively, in the corresponding bin of this space. After this weighting, the asymmetry in the D
0→ K
−π
+decay sample becomes A
K −. The detector asymmetry, A
K −, is measured from simultaneous fits to the weighted M (K
∓π
±) distributions in 10 × 10 bins of the 2D phase space (p
labT K−, cos θ
Klab−) with similar parameterizations as used for D
+→ K
S0K
+decays except that, for the D
0→ K
−π
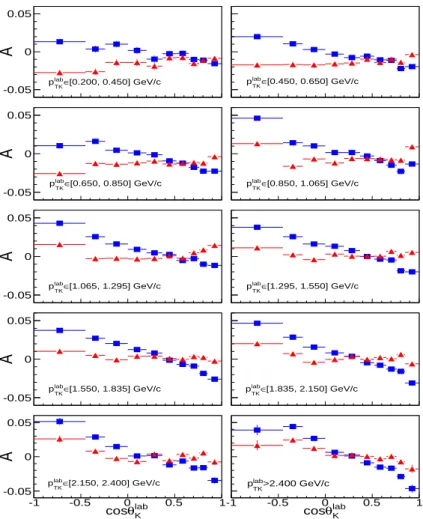
+signal description, a sum of a Gaussian and bifurcated Gaussian is used. Figure 3 shows the measured A
K −in bins of p
labT K−and cos θ
labK−together with A
Drec0→K−π+for comparison;
we observe that A
Drec0→K−π+shows a cos θ
Klab−dependency that is inherited from A
DF B0while A
K −does not. The average of A
K −over the phase space is ( − 0.150 ± 0.029)%, where the error is due to the limited statistics of the D
0→ K
−π
+sample.
Based on a recent study of A
D[26], we obtain the dilution asymmetry in bins of K
S0lab momentum. For the present analysis, A
Dis approximately 0.1% after integrating over the phase space of the two-body decay.
The data samples shown in figure 2 are divided into 10 × 10 × 16 bins of the 3D phase space (p
labT K+, cos θ
Klab+, p
labK0S
). Each D
±→ K
S0K
±candidate is then weighted with a factor of (1 ∓ A
K +)(1 ∓ A
D) in this space. The weighted M (K
S0K
±) distributions in bins of cos θ
Dc.m.s.+are fitted simultaneously to obtain the corrected asymmetry. We fit the linear component in cos θ
Dc.m.s.+to determine A
F B; the A
CPcomponent is uniform in cos θ
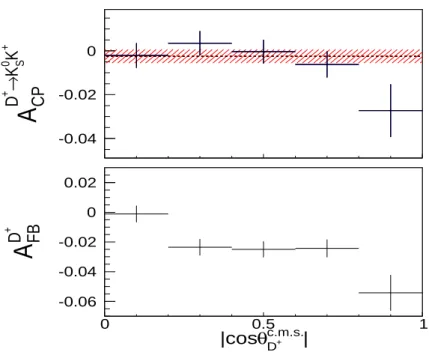
Dc.m.s.+. Figure 4 shows A
DCP+→KS0K+and A
DF B+as a function of | cos θ
c.m.s.D+| . From a weighted average
– 6 –
-1 -0.5 0 0.5 1
A
-0.05 0 0.05
[0.200, 0.450] GeV/c
∈ lab pTK
-1 -0.5 0 0.5 1
-0.05 0 0.05
[0.450, 0.650] GeV/c
∈ lab pTK
-1 -0.5 0 0.5 1
A
-0.05 0 0.05
[0.650, 0.850] GeV/c
∈ lab pTK
-1 -0.5 0 0.5 1
-0.05 0 0.05
[0.850, 1.065] GeV/c
∈ lab pTK
-1 -0.5 0 0.5 1
A
-0.05 0 0.05
[1.065, 1.295] GeV/c
∈ lab pTK
-1 -0.5 0 0.5 1
-0.05 0 0.05
[1.295, 1.550] GeV/c
∈ lab pTK
-1 -0.5 0 0.5 1
A
-0.05 0 0.05
[1.550, 1.835] GeV/c
∈ lab pTK
-1 -0.5 0 0.5 1
-0.05 0 0.05
[1.835, 2.150] GeV/c
∈ lab pTK
K
θlab
-1 -0.5 cos0 0.5 1
A
-0.05 0 0.05
[2.150, 2.400] GeV/c
∈ lab pTK
K
θlab
-1 -0.5 cos0 0.5 1
-0.05 0 0.05
>2.400 GeV/c
lab
pTK
Figure 3. The A
K −map in bins of p
labTand cos θ
labof the K
−obtained with the D
0→ K
−π
+and D
s+→ φπ
+samples (triangles). The A
Drec0→K−π+map is also shown (rectangles).
over the | cos θ
c.m.s.D+| bins, we obtain A
D+→KS0K+
CP
= ( − 0.246 ± 0.275)%, where the error is statistical.
5 Systematic uncertainty
The entire analysis procedure is validated with fully simulated MC events [34] and the result is consistent with null input asymmetry. We also consider other sources of systematic uncertainty. The dominant one in the A
CPmeasurement is the A
K +determination, the uncertainty of which is mainly due to the statistical uncertainties in the D
0→ K
−π
+and D
+s→ φπ
+samples. These are found to be 0.029% and 0.119%, respectively, from a simplified simulation study. A possible A
CPin the D
0→ K
−π
+final state is estimated using A
CP= − y sin δ sin φ √
R [35]. A calculation with 95% upper and lower limits on
D
0− D ¯
0mixing and CP violation parameters y, φ, and strong phase difference δ and
Cabibbo suppression factor R from ref. [3], A
CPin the D
0→ K
−π
+final state is estimated
to be less than 0.005% and this is included as one of systematic uncertainties in the A
K +determination. As reported in our previous publication [29], the magnitude of A
KKrecfor
0 0.5 1
CP
+
K
S0K →
+D A
-0.04 -0.02 0
|
D+
c.m.s.
θ
|cos
0 0.5 1
FB
+D A
-0.06 -0.04 -0.02 0 0.02
Figure 4. Measured A
CP(top) and A
F B(bottom) values as a function of | cos θ
Dc.m.s.+| . In the top plot, the dashed line is the mean value of A
CPwhile the hatched band is the ± 1σ
totalinterval, where σ
totalis the total uncertainty.
the φ reconstruction in D
+s→ φπ
+decays is 0.051%, which is also added to the systematic uncertainty in the A
K +measurement. By adding the contributions in quadrature, the systematic uncertainty in the A
K +determination is estimated to be 0.133%. We estimate 0.008% and 0.021% systematic uncertainties due to the choice of the fitting method and that of the cos θ
Dc.m.s.+binning, respectively. Finally, we add the systematic uncertainty in the A
Dcorrection, which is 0.010% based on ref. [26]. The quadratic sum of the above uncertainties, 0.135%, is taken as the total systematic uncertainty.
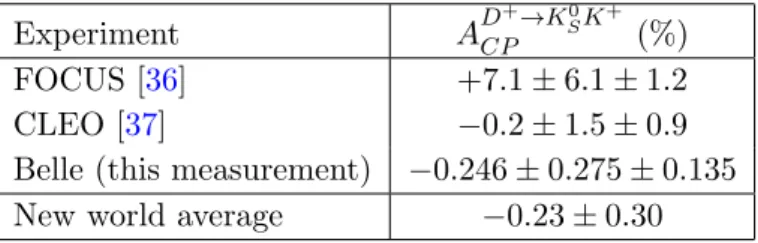
6 Results We find A
D+→KS0K+
CP
= ( − 0.246 ± 0.275 ± 0.135)%. This measurement supersedes our previous determination of A
D+→KS0K+
CP
[28]. In Table 1, we compare all the available mea- surements and give their weighted average.
According to Grossman and Nir [27], we can estimate the experimentally measured CP asymmetry induced by SM K
0− K ¯
0mixing, A
KCP¯0. The efficiency as a function of K
S0decay time in our detector is obtained from MC simulated events. The efficiency is then used in eq. (2.10) of ref. [27] to obtain the correction factor that takes into account, for A
KCP¯0, the dependence on the kaon decay time. The result is 0.987 ± 0.007. By multiplying the correction factor 0.987 ± 0.007 and the asymmetry due to the neutral kaons [2], we find the experimentally measured A
KCP¯0to be ( − 0.328 ± 0.006)%.
– 8 –
Experiment A
D+→KS0K+
CP