Multi-frequency study of relativistic jets in active galactic nuclei
Inaugural-Dissertation zur
Erlangung des Doktorgrades
der Mathematisch-Naturwissenschaftlichen Fakult¨at der Universitat zu K¨oln
vorgelegt von Kirill V. Sokolovsky
aus Moskau, Russland
K¨oln 2010
Berichterstatter: Prof. Dr. Andreas Eckart Prof. Dr. J. Anton Zensus
Tag der m¨undlichen Pr¨ufung: 01.02.2011
Contents
1 Introduction 1
1.1 Multi-band approach as a powerful tool to probe physical processes in
AGN jets . . . . 2
1.2 Parsec-scale study of AGN radio jets with VLBI . . . . 5
1.2.1 Jets aligned with the line of sight . . . . 5
1.2.2 Misaligned jets . . . . 7
1.3 Radiation from a homogeneous uniform synchrotron source and how it applies to jets . . . . 8
1.3.1 Synchrotron radiation along the line of sight . . . . 10
1.3.2 Synchrotron radiation of a spherical source . . . . 11
1.4 Outline of this work . . . . 12
2 Constraining the magnetic field strength and particle energy spectrum in AGN jets with multi-frequency VLBI observations 14 2.1 A CLEAN component-based method of spatially resolved spectrum reconstruction . . . . 15
2.1.1 VLBI imaging with CLEAN algorithm . . . . 15
2.1.2 Description of the spectrum reconstruction method . . . . 16
2.1.3 Discussion of the method . . . . 18
2.2 Magnetic field in the parsec-scale core regions of brightγ-ray blazars 18 2.2.1 Introduction . . . . 19
2.2.2 Observations and data reduction . . . . 21
2.2.3 Results . . . . 23
2.2.4 Discussion . . . . 47
2.3 Magnetic field in the parsec-scale core regions of high core shift radio sources . . . . 48
2.4 Chapter summary . . . . 50
3 Individual blazars across the electromagnetic spectrum 51 3.1 VLBI radio behavior of 3C 454.3 during its 2008 activity period . . . 52
3.2 Multifrequency VLBA view of BL Lacertae during the Fermi campaign 60 3.2.1 General properties . . . . 60
3.2.2 Results of 5–43 GHz VLBA observations . . . . 61
3.3 Multiwavelength observations of PKS 1510−089 . . . . 63
3.3.1 General properties . . . . 64
3.3.2 VLBA observations of PKS 1510−089 . . . . 64
3.3.3 Quasi-simultaneous SED of PKS 1510−089 . . . . 66
3.4 VLBA view of TeV blazars Mrk 421 and Mrk 501 . . . . 69
i
3.5 Chapter summary . . . . 71
4 A VLBA survey of the core shift effect in AGN jets 72 4.1 Introduction . . . . 72
4.2 VLBA observations . . . . 73
4.2.1 Sample selection . . . . 73
4.2.2 VLBA observation setup . . . . 74
4.2.3 Data calibration and imaging . . . . 75
4.3 Discussion . . . . 101
4.3.1 Core position as a function of frequency . . . . 101
4.3.2 Fitting results assuming synchrotron self-absorption opacity . 103 4.3.3 Comparison with previous 2.3/8.6 GHz measurements . . . . 104
4.4 Chapter summary . . . . 105
5 The quest for young radio sources seen edge-on 106 5.1 A sample of GHz-peaked spectrum sources selected with RATAN–600: spectral and variability properties . . . . 107
5.1.1 General remarks . . . . 107
5.1.2 Observational data and sample selection . . . . 108
5.1.3 Spectral properties . . . . 109
5.1.4 Variability . . . . 111
5.1.5 Summary of the sample properties . . . . 113
5.2 Parsec-scale properties of the RATAN-600 GPS sources derived from 2.3 and 8.6 GHz VLBI surveys . . . . 118
5.2.1 Morphological classification . . . . 118
5.2.2 VLBI-scale compactness . . . . 120
5.2.3 Magnetic field in the dominating source components . . . . . 121
5.2.4 Summary . . . . 122
5.3 A VLBI selected sample of Compact Symmetric Object candidates and frequency dependent position of hotspots . . . . 123
5.3.1 Introduction . . . . 123
5.3.2 The VLBI-selected sample of CSO candidates and its basic characteristics . . . . 124
5.3.3 Properties of the dominating parsec-scale components . . . . 126
5.3.4 Frequency dependent component position . . . . 127
5.3.5 Summary . . . . 129
5.4 γ-ray counterparts of candidate young radio sources seen edge-on . . 138
5.5 Chapter summary . . . . 138
6 Conclusions 140
ii
List of Figures
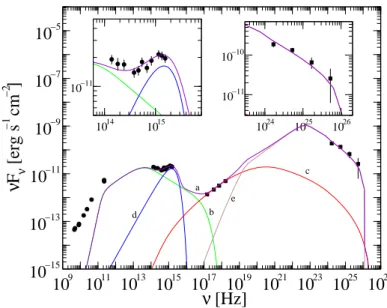
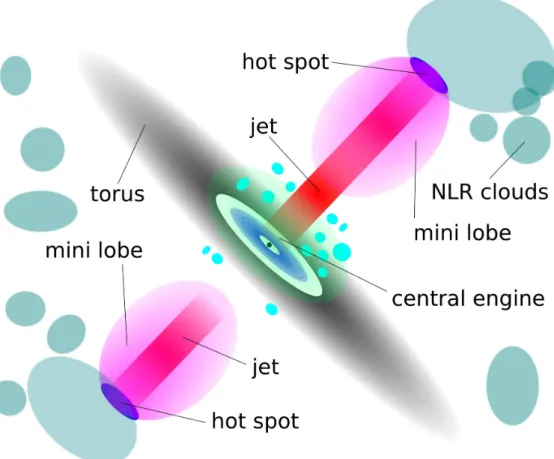
1.1 Scheme of a radio-loud AGN. Note that relative sizes are not to scale and shapes of many structures (like the Broad Line Region – BLR and Narrow Line Region – NLR) are very uncertain. The “blazar zone” is likely a small section of the inner jet, presumably located inside or just outside the BLR. The “blazar zone” is responsible for relativistically- beamed, highly variable emission at NIR and optical bends and at high energies. . . . 2 1.2 The observed Spectral Energy Distribution (SED) of a quasar-type blazar
compared to a model. See Fig. 3.13 and Section 3.3 for a detailed dis- cussion. . . . 4 1.3 Scheme of a blazar jet. Note that mm-band core is located upstream
(closer to central engine) than cm-band core due to the “core shift” ef- fect. At any given frequency, sections of the jet upstream from the core corresponding to this frequency are hidden from sight by opacity. The
“blazar zone”, site of the NIR, optical and high-energy emission, is lo- cated upstream from the mm-band core. Shocks traveling the jet could potentially also be responsible for a fraction of high-energy emission. 6 1.4 Scheme of a Compact Symmetric Object (CSO) – a miniature radio
source contained entirely within the Narrow Line Region (NLR) of its host galaxy. . . . 8 1.5 Theoretical spectrum of a uniform synchrotron source (Section 1.3.1)
plotted in spectral (Fν, 1.5a) and SED (νFν, 1.5b) coordinates. . . . . 9 2.1 Maps of the best-fit synchrotron spectrum (Fig. 2.2) parameters and
the estimated magnetic field strength derived from nine images (1.4–
15.4 GHz range) of the source 1458+718 convolved with the same Gaussian beam. From this example it is clear why convolution with a Gaussian beam makes VLBI images unsuitable for magnetic field es- timation. The convolved images have large areas of artificial low flux surrounding each area where the actual flux is detected (see the distri- bution of the peak intensity at Fig. 2.1b). These artificial low-flux areas (where there should be no flux at all) result in very high estimated val- ues of B⊥ (Fig. 2.1a) around each spot with actual detected flux (and, therefore, a valid estimation of B⊥). The peak frequency (Fig 2.1c) and power index of the electron energy distribution (Fig 2.1d) do not change much across the area and the effect of their changes is negli- gible compared to the effect of convolution. We note that only pixels where spectral turnover was detected (i.e. the spectrum in such pixel significantly deviates from a power law) are shown on the images. . . 19
iii
2.2 Spectrum of a single pixel (red points) in Fig. 2.1 compared to a power law (green line) and synchrotron spectrum (blue curve) fit. The syn- chrotron model clearly provides better fit to the data. Spatial distribu- tions of the best-fit parameters of the synchrotron model: peak inten- sity Speak, peak frequencyνpeakand electron energy distribution index p (p = 1−2α, Sν ∝ να) are presented on Fig 2.1b, 2.1c and 2.1d respectively. . . . 20 2.3 Spectrum of the core and naturally weighted CLEAN images of theγ-
ray bright blazars observed with the VLBA between 4.6 and 43.2 GHz.
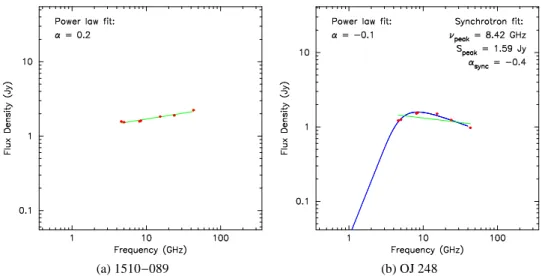
The lowest contour value ‘clev’ is chosen at four times the rms noise, the peak brightness is given by ‘max’. The contour levels increase by factors of two. The dashed contours indicate negative brightness. The half power beam width is shown in the bottom left corner of the images in grey. An epoch of observation is shown in the bottom right corner. 26 2.4 VLBA spectra of core regions of 1510−089 (a) and OJ 248 (b). The
former spectrum is flat while the latter one shows a prominent syn- chrotron self-absorption peak. The green line is a power law fit. The blue curve is a homogeneous synchrotron source model. . . . . 46 3.1 Total intensity VLBA images of 3C 454.3 at 43.2 GHz at four epochs
covered by our multifrequency observations. Image details: 3.1a – peak 24.6 Jy/beam, first contour 0.030 Jy/beam; 3.1b – peak 23.4 Jy/beam, first contour 0.030 Jy/beam; 3.1c – peak 21.7 Jy/beam, first contour 0.015 Jy/beam; 3.1d – peak 15.6 Jy/beam, first contour 0.020 Jy/beam.
Contours are a factor of 4 apart in all cases. The beam is plotted in the lower left corner of each image. Green circles represent Gaussian components used to model the 43.2 GHz brightness distribution of the source. . . . . 53 3.2 Total intensity VLBA image at 4.6 GHz. The first contour is 0.002 Jy/beam,
factor=4. The beam is shown in the lower left corner of the image. . 55 3.3 Spectral index map constructed by fitting a power law to observations
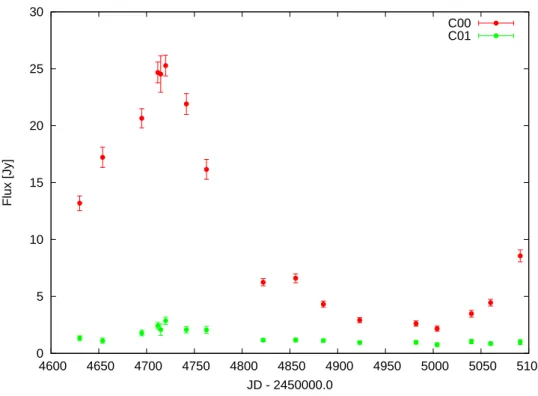
at three frequencies: 8.1, 8.4 and 15.4 GHz. Contours represent total intensity at 8.4 GHz. Contour map peak=6.442 Jy/beam, first contour 0.1% of the peak. Beam FWHM=2.12×1.05 mas at PA=−4.◦64. . . 56 3.4 Lightcurve of the 43 GHz core of 3C 454.3 (marked “C00”) and the
first jet component “C01” about 0.15 mas away from the core. . . . . 57 3.5 Size of the first jet component (C01) and the core (C00) as a function
of time. . . . 57 3.6 Separation of the component “C01” from the core (“C00”) of 3C 454.3
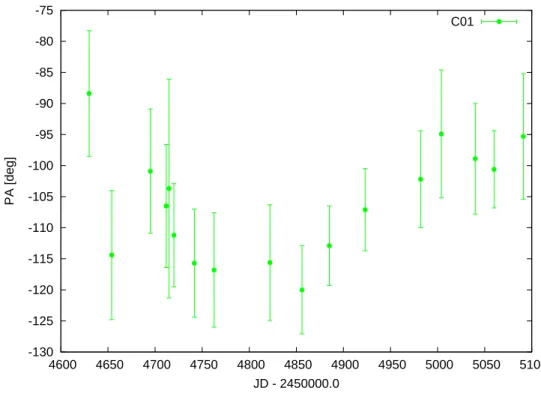
as a function of time. The blue line represents the least square fit to the data. . . . 58 3.7 Position Angle (PA) of the component C01 with respect to the core. . 58 3.8 Core spectrum of 3C 454.3. . . . 59 3.9 Inner jet of BL Lacertae as observed by the VLBA on September 02,
2008. Images at different frequencies are shifted by 8 mas in relative Right Ascension. For the 15.4, 23.8 and 43.2 GHz image map peaks are 1.69, 1.52, 1.32 Jy/beam, first contours are 1.70, 3.00, 5.00 mJy/beam respectively. The contour levels are increased by a factor of 3. Beam size (natural weighting) for each frequency is indicated by the cross to the left of the corresponding image. . . . . 62
iv
3.10 Spectral index map (Fν ∼ ν−α, α is shown in color) of BL Lacertae constructed using VLBA observations at 4.6, 5.0, 8.1 and 8.4 GHz.
The overlaid contours represent total intensity at 8.4 GHz (the peak in- tensity is 1.75 Jy/beam, the first contour is 0.70 mJy/beam, the beam size is 1.57× 1.22 mas at PA = 10.◦4). The spectral index map was smoothed by a median filter with radius equal to the indicated beam size. The map shows an optically thin jet with α ∼ 0.7 and the self- absorbed core region (α < 0.0). A 2D cross-correlation technique us- ing the optically thin part of the jet was employed to align images at different frequencies allowing reliable extraction of the spectral infor- mation. The spectral steepening towards the jet edges visible on the spectral index map occurs on the angular scale comparable to the beam size and is likely an effect of the uneven uv-coverage at different fre- quencies. . . . . 63 3.11 Stokes I CLEAN images of PKS 1510−089 observed by VLBA on
2009 April 9, at 15, 24, and 43 GHz. The lowest contour and peak intensity are 0.7 mJy/beam and 1.47 Jy/beam (15 GHz), 0.7 mJy/beam and 1.56 Jy/beam (24 GHz), 2 mJy/beam and 1.85 Jy/beam (43 GHz).
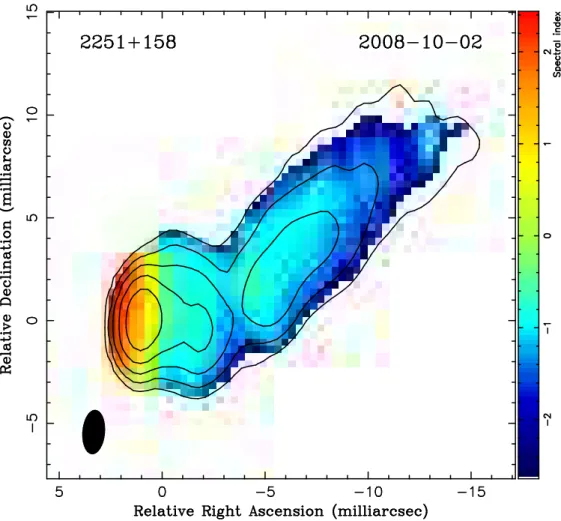
Contours are plotted with a step×4. Natural weighting of visibility data is used, HPBW beam size is shown in the lower left corner. Angular size of 1 mas corresponds to 5 pc. . . . 65 3.12 Spectral indexα(F(ν)∝ να) map between 15.4 and 23.8 GHz (shown
in color) of PKS 1510−089 as observed by the VLBA on 2009 April 9.
The overlaid contours represent total intensity at 15.4 GHz (see Fig- ure 3.11 for details). The spectral index map was smoothed by a me- dian filter with a 0.6 mas radius. . . . 67 3.13 Quasi-simultaneous SED of PKS 1510−089 from Sokolovsky et al.
(2010a) constructed using observations with the VLBA, Swift, Fermi/LAT, NOT, SMA and the 2.1 m telescope Guillermo Haro. The violet curve (a) represents the combined SED model: green curve (b) is the syn- chrotron component, red (c) is the SSC component, blue (d) is the ac- cretion disk and brown (e) represents EC scattering of the disk radiation (see also Table 3.3). . . . . 68 3.14 The VLBA spectrum of Mrk 501: 3.14a — integrated parsec-scale
spectrum, 3.14b — core spectrum. . . . 71 4.1 Naturally weighted CLEAN images of the observed sources between
1.4 and 15 GHz. The lowest contour value ‘clev’ is chosen at four times the rms noise, the peak brightness is given by ‘max’. The contour levels increase by factors of two. The dashed contours indicate negative brightness. The beam’s full width at half maximum (FWHM) is shown in the bottom left corner of the images in grey. An epoch of observation is shown in the bottom right corner. Red and blue spots indicate the positions and sizes (FWHM) of Gaussian model components for the core and the jet features respectively. . . . . 78 4.2 Separation of the core from a reference optically-thin jet component
as a function of frequency. The curve represents the best-fit function rc(ν) = a+bν−1/k, the coefficient k = 1 was fixed during the fitting.
The best-fit parameters are presented in Table 4.4. . . . 98 4.2 continued... . . . 99
v
4.3 Distribution of the observed difference in distance between the core and reference component measured at two sub-bands of X, C, S and L band. . . . 100 4.4 Distribution of the k parameter in the core position as a function of fre-
quency fit: rc(ν) ∝ ν−1/k. The mean value is k = 0.98±0.11 while the median is 0.89. One discrepant measurement on the histogram corresponds to the source 0952+179 were the value of k is not well constrained: k=2.7±1.7. . . . 102 4.5 Core shift ratio versus X band core flux density ratio. The core shift
ratio is defined to be greater than unity, i.e., for each pair of measure- ments, the larger value of the shift is in the numerator of the ratio. The one source (not shown in this plot) which exhibited a large core shift change without a major change in flux density is W Com (1219+285);
it has a core shift ratio of 3.67±0.36 and core flux ratio of 1.19±0.08. 104 5.1 Radio spectra of 3 out of 60 newly identified GPS source candidates.
Variability index as a function of frequency is presented in the panels under the spectra plots. Black points correspond to RATAN–600 data, grey points represent data collected from the literature. . . . 110 5.2 Combined spectra of all selected 226 GPS candidates normalized by
peak flux density and peak frequency values. Filled circles represent the observed spectra binned and shifted along the vertical axis. The solid line is a normalized and shifted theoretical spectrum of a homo- geneous synchrotron emitting cloud with self-absorption and power in- dexγ=2.54 of the electron energy distribution. . . . . 111 5.3 Peak frequency distribution for GPS quasars, galaxies and unidentified
radio sources (empty fields). . . . 112 5.4 Distribution of variability index v for the model non–variable sources
measured with the relative accuracy of 5, 8 and 10% respectively. . . . 113 5.5 Distribution of the observed variability index v11 at 11 GHz for GPS
quasars, galaxies and unidentified radio sources (empty fields) in our sample. . . . 114 5.6 Redshift distribution of GPS galaxies and GPS quasars from the sample. 119 5.7 Relation between the variability index at 11 GHz v11 and the high–
frequency spectral indexα1 for galaxies (G), quasars (Q) and uniden- tified radio sources (R). The line is a least square fit to the data: a1 ≃ 1.08(±0.02) v11−0.90(±0.002). . . . 120 5.8 Distributions of 2.3–8.6 GHz spectral indices of VLBI components of
CSO candidates. . . . 120 5.9 PKS 1555−140 – new GPS galaxy with CSO morphology at z=0.097.
Red points on the pannel (b) denote RATAN–600 observations, green points represent literature data. . . . 121 5.10 Observed peak frequency distribution for GPS sources with different
optical identification and parsec-scale radio structure. . . . 121 5.11 “Compactness index” for sources from the RATAN–600 GPS sample
(a) and from the complete sample of flat spectrum sources (b). . . . . 122 5.12 Distribution of estimated log10B (G) for sources with different mor-
phological types. Filled bars - sources with known redshift. Empty bars - sources with unknown redshift. . . . . 123
vi
5.13 Dual-frequency simultaneous 2 and 8 GHz naturally weighted CLEAN images. The lowest contour value ‘clev’ is chosen at four times the rms level, the peak brightness is given by ‘max’ (Jy/beam). The contour levels increase by factors of two. The dashed contours indicate nega- tive flux. The beam is shown in the bottom left corner of the images.
An epoch of observation is shown in the bottom right corner. Light blue and orange spots indicate Gaussian model components 1 and 2 respectively. . . . 125
vii
List of Tables
1.1 Dimensionless parameters of the spherical synchrotron source model . 12
2.1 A sample ofγ-ray bright blazars observed with the VLBA . . . . 22
2.2 IF central frequencies . . . . 22
2.3 Amplitude corrections for the BK150 VLBA experiment . . . . 23
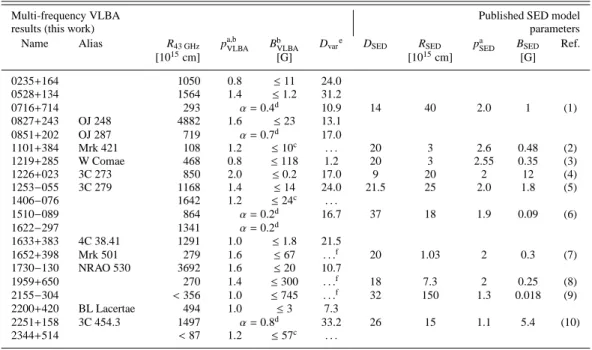
2.4 Comparison of the emission region parameters estimated from the VLBA data and SED modeling . . . . 47
2.5 Estimated physical parameters of parsec-scale cores of the “high core shift sample” sources . . . . 49
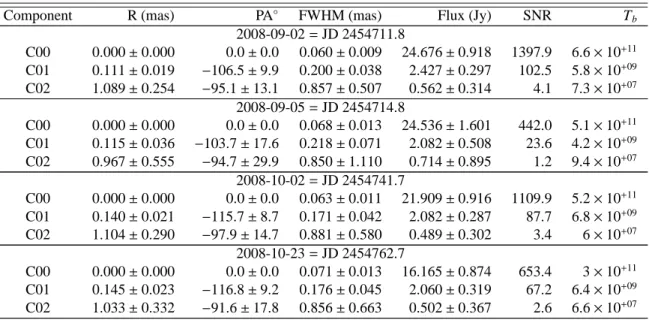
3.1 Parameters of the core and jet components of 3C 454.3 at 43.2 GHz . 54 3.2 VLBA flux measurements of 3C 454.3 . . . . 59
3.3 PKS 1510−089 SED model parameters from Sokolovsky et al. (2010a) 66 3.4 VLBA flux measurements of Mrk 421 and Mrk 501 . . . . 70
4.1 The high core shift source sample observed with the VLBA . . . . 74
4.2 IF central frequencies . . . . 75
4.3 Amplitude corrections for the BK134 VLBA experiment . . . . 99
4.4 Core distance from the reference jet component as a function of fre- quency: fit results (r =a+b/ν) . . . . 103
5.1 RATAN–600 sample of GPS sources . . . . 114
5.2 List of CSO candidates selected from VCS and RDV surveys . . . . . 132
viii
Acknowledgements
I am deeply grateful to Dr. Yuri Kovalev for giving me the opportunity to work on the interesting projects described in the thesis and for his continuous support and ad- vice. I would like to thank Dr. Andrei Lobanov for sharing his deep understanding of AGN physics and VLBI technique. Dr. Alexander Pushkarev, Frank Schinzel, Dr. Tuo- mas Savolainen, Dr. Ru-Sen Lu, Dr. Marios Karouzos, Dr. Emmanouil Angelakis, Dr. Eduardo Ros, Dr. Richard Porcas, Dr. Thomas Krichbaum, Dr. Matthias Kadler, Dr. Lars Fuhrmann, Dr. Nicola Marchili and many other current and past members of the MPIfR’s VLBI group were always available for an interesting and helpful discus- sion both about science and life, thank you very much for that! I would like to thank referees Prof. Dr. Andreas Eckart and Prof. Dr. J. Anton Zensus, who agreed to review the thesis. I am especially grateful to Prof. Dr. J. Anton Zensus for the opportunity to work in the VLBI group of the MPIfR – this was a very interesting and educative experience for me. Special thanks to Gabi Breuer, and Simone Pott for all their help, which made my life in Bonn easier. Finally, I would like to thank the Fermi/LAT AGN group for the good collaboration and for the opportunity to work with the top special- ists inγ-ray and blazar astronomy. My work on the thesis has been supported by the International Max Planck Research School (IMPRS) for Astronomy and Astrophysics at the Universities of Bonn and Cologne.
ix
Abstract
The thesis at hand presents the results of multi-frequency Very Long Baseline Interfer- ometry (VLBI) observations of jets associated with active galactic nuclei. The results are discussed in the context of broad-band jet emission models and used to constrain physical properties of the parsec-scale core – inner part of the jet which is likely related to the observed high-energy emission. The analysis of the frequency-dependent core position shift supports interpretation of the parsec-core as the integral part of the jet;
the observed core position is determined by opacity. Synchrotron self-absorption is found to be the dominating opacity mechanism in the observed sources. A comparison between radio sources possessing jets aligned closely to the line of sight with those aligned at large angles to it supports the idea that the bright extragalacticγ-ray sources are associated with jets affected by relativistic beaming.
Zusammenfassung
Die hier vorliegende Dissertation pr¨asentiert die Ergebnisse von Multifrequenz Very Long Baseline Interferometry (VLBI) Beobachtungen von Jets aktiver galaktischer Kerne (AGN). Die Ergebnisse werden im Zusammenhang mit breitbandigen Jet Emis- sionsmodellen diskutiert und werden daf¨ur benutzt die physikalischen Eigenschaften des Kerns auf Parsec Skalen, d.h. der innere Teil des Jets welcher sehr wahrschein- lich mit beobachteter hochenergetischen Strahlung zusammenh¨angt, einzugrenzen. Die Auswertung der frequenzabh¨angigen Positionsverschiebung des Kerns auf Grund von Opazit¨at unterst¨utzt die Interpretation des Kerns auf Parsec Skalen als einen wesentlichen Bestandteil des Jets. Die Synchrotron-Selbstabsorption wurde als der dominierende Mechanismus der frequenzabh¨angigen Opazit¨at in den beobachteten Quellen identi- fiziert. Ein Vergleich zwischen Radioquellen mit Jets entlang der Sichtlinie mit jenen unter grossen Winkeln zur Sichtlinie untermauert die Annahme das helle extragalak- tische und Gammastrahlung emittierende Quellen mit Jets verkn ¨upft werden die rela- tivistisches Beaming zeigen.
Chapter 1
Introduction
Active Galactic Nuclei (AGN) are small regions in centers of some galaxies which emit powerful electromagnetic radiation, often outshining stars, gas, and dust which make up the host galaxy. If AGN emission dominates the galaxy emission all over the electromagnetic spectrum, such object is known as the “quasar”. The energy source powering AGN is believed to be accretion of gas onto a supermassive black hole. This is a very efficient energy release process potentially able to extract a large fraction (maybe 10% or more) of the rest energy of the infalling matter (mc2). The released energy makes AGN visible from cosmological distances. Accretion of matter onto a compact object (such as a black hole, neutron star, young stellar object and, possibly, a white dwarf) is often associated with production of collimated bipolar outflows known as jets. Jets carry a fraction of infalling matter (and its angular momentum) away from a central object. It is likely that despite the striking visual similarity of jets produced by stars, stellar-mass and supermassive black holes, different physical mechanisms are responsible for jet production and evolution in these systems. In the case of accretion onto a supermassive black hole, the produced jets are extreme, with matter in such jets moving with relativistic speed.
While it is widely accepted that accretion onto a supermassive black hole pow- ers AGN, the mechanisms which convert the energy of infalling gas into the extreme electromagnetic radiation we observe are not well understood. An AGN is a complex system consisting of the central (possibly rotating) supermassive black hole, infalling matter in a form of an inner accretion disk, dusty torus (which is further away from the central object and is thus cooler), and clouds of gas orbiting the black hole, as well as outflowing matter (which moves away from the central black hole) in a form of colli- mated relativistic jets, and possibly slower, not well collimated outflow. A simplified scheme of a radio-loud AGN is presented on Fig. 1.1. Magnetic fields are likely to play a significant role in the dynamics of inner accretion disk and the process of launching the relativistic jet. Components of this system radiate through a number of mecha- nisms according to their physical condition, and radiation of one component influences physical conditions in other components (radiation of the accretion disk ionizes the sur- rounding gas clouds, photons produced by ionized gas clouds are up-scattered to high energies by relativistic electrons in the jet). Details of these processes are yet unclear.
Different accretion rate and its total duration, viewing angle, presence or absence and relative importance of different structural components may be the reasons why AGN phenomenon appear in so many different forms. While it is believed that most galaxies contain a supermassive black hole in their center, only a small fraction of them appear
1
as AGN, and even smaller fraction of them produce bright radio-emitting jets.
This work is concentrated on radio loud AGN in which relativistic jets are most prominent. In some of them (the so-called “blazars”), the relativistic jet dominates not only radio, but also optical emission. Blazars are also powerful high-energy emitters, the property which is likely to be directly related to the presence of a relativistic jet.
In this work we highlight some observational properties of AGN jets and, whenever possible, try to provide physical interpretation of the observed phenomena. A more detailed outline of this work may be found in Section 1.4.
Figure 1.1: Scheme of a radio-loud AGN. Note that relative sizes are not to scale and shapes of many structures (like the Broad Line Region – BLR and Narrow Line Region – NLR) are very uncertain. The “blazar zone” is likely a small section of the inner jet, presumably located inside or just outside the BLR. The “blazar zone” is responsible for relativistically-beamed, highly variable emission at NIR and optical bends and at high energies.
1.1 Multi-band approach as a powerful tool to probe physical processes in AGN jets
It is not clear why only about 10% of AGN are radio loud. The formation of a radio emitting jet may be related to conditions in the near black hole (e.g., Hujeirat et al.
2003; Narayan 2005) environment, the magnetic field strength, or the black hole spin (Blandford & Payne 1982; Blandford & Znajek 1977; Wilson & Colbert 1995). It is likely that radio-quiet AGNs are just scaled-down (in terms of jet power) versions of radio-loud AGNs (e.g., Falcke 2001; Kellermann et al. 1994). Alternatively it has been
2
suggested that the origin of weak radio emission observed from radio-quiet AGNs may be different from the one in radio-loud AGNs (e.g., Ishibashi & Courvoisier 2010).
The observed spectrum, high brightness temperature and significant polarization of radio emission from AGN jets clearly indicates that it has a non-thermal origin. The most likely mechanism behind the observed jet radio emission is the synchrotron radia- tion (e.g., Ginzburg & Syrovatskii 1965; Kardashev et al. 1962; Krolik 1999; Marscher 2009). The major open physical questions regarding AGN jets are related to their launching, energy dissipation and origin of the Spectral Energy Distribution (SED) components.
The relative positions of principal structures making up a radio-loud AGN are pre- sented in Fig. 1.1. Such AGN will be observed as a blazar if viewed along (or close to) the jet axis. If viewed from a large angle to the jet axis, it will be observed as a radio galaxy or a steep-spectrum quasar.
Blazars are a class of AGN which includes Flat-Spectrum Radio Quasars (FSRQ) and BL Lacertae-type objects. One of the most remarkable things about blazars is their ability to radiate across the entire electromagnetic spectrum: from radio to GeV and TeVγ-rays (e.g., Marscher 2006a, 2009). This emission is believed to be produced by a relativistic jet pointing roughly towards the observer. The SED of a blazar, in ν-νFν representation, has two broad components: one peaking between far-IR and X- ray wavelengths and the other peaking atγ-rays (Fig. 1.2). For recent reviews of the blazar emission mechanisms and energetics one may consult Boettcher (2010); Celotti
& Ghisellini (2008); Ghisellini & Tavecchio (2009). The radio to UV (sometimes up to X-ray) emission of blazars is believed to be dominated by synchrotron radiation of rela- tivistic electrons while radiation at higher energies could be due to the inverse Compton scattering of synchrotron photons emitted by the electrons themselves (the synchrotron self-Compton process, SSC, Ghisellini & Maraschi 1989; Jones et al. 1974) and/or photons from external sources (External Compton, EC, Dermer & Schlickeiser 2002;
Sikora et al. 1994). The sources of the external seed photons for the EC process include accretion disc, broad line region (BLR) clouds, warm dust, and the cosmic microwave background (CMB), with their relative contribution varying for different blazars.
Despite the wide acceptance of the picture outlined above, the exact location, geom- etry and physical properties of the regions responsible for blazar emission (the “blazar zone”) at different bands remain a controversial issue. It is critical to identify the lo- cation ofγ-ray emitting regions in order to distinguish between SSC and EC models and determine the origin of seed photons for the EC process. Moreover, the blazar phenomenon can be explained in the framework of the hadronic models, where the relativistic protons in the jet are the primary accelerated particles, emittingγ-ray radia- tion by means of photo-pair and photo-pion production and synchrotron radiation (see M¨ucke & Protheroe 2001; M¨ucke et al. 2003 for reviews on hadronic models).
Blazar emission is variable in flux and polarization on timescales from minutes to decades and longer. Shock-in-jet (Hughes et al. 1985; Marscher 1996; Marscher &
Gear 1985), colliding relativistic plasma shells (Guetta et al. 2004), lighthouse effect (Camenzind & Krockenberger 1992), MHD-instabilities (Sikora et al. 2005) or varia- tions of the jet orientation caused by the orbital motion in a binary black hole system (e.g., Begelman et al. 1980; Valtonen et al. 2008; Villata & Raiteri 1999) are some of the models that attempt to explain blazar variability at different time scales. Although the exact physical processes at play are unclear, the study of the temporal behavior of the SED is important (Angelakis et al. 2009) since different mechanisms predict different variability patterns (e.g., B¨ottcher 2002).
Flux variability in blazars and AGN in general is often discussed in terms of “flares”, 3
1014 1015 10−11
1024 1025 1026 10−11
10−10
a b
c
d
e
10 10 10 10 10
10 10 10 10 10 10 10 10 10 10 10
−2−1
−7
−9
−5
−11
−13
−15
9 11 13 15 17 19 21 23 25 27
ν [Hz]
νF ν [erg s cm]
Figure 1.2: The observed Spectral Energy Distribution (SED) of a quasar-type blazar compared to a model. See Fig. 3.13 and Section 3.3 for a detailed discussion.
however such terminology may be misleading. While it is often possible to visually identify individual flares in an AGN lightcurve (e.g, Hovatta et al. 2008) it is not clear if these flares actually represent a sudden and catastrophic change in the source prop- erties (such as a dwarf nova flare associated with the phase transition in its accretion disc). On the contrary, it is quite possible that “flaring state” is the natural state for an AGN. AGN variability may be caused by a process which continuously produces flares with varying amplitudes and time scales.
There is a substantial amount of evidence (Lobanov 2010a) for relativistic jets contributing to generation of non-thermal continuum in the optical (Arshakian et al.
2010; Jorstad et al. 2010; Le ´on-Tavares et al. 2010), X-ray (Chatterjee et al. 2009;
D’Arcangelo et al. 2007; Marscher et al. 2008; Soldi et al. 2008; Unwin et al. 1997)), γ-ray at MeV–GeV (Jorstad et al. 2010; Marscher et al. 2010b; Otterbein et al. 1998;
Savolainen et al. 2010) and TeV (Acciari et al. 2009a; Charlot et al. 2006; Piner & Ed- wards 2004) energies. Spatial localization of production sites of variable non-thermal continuum emission in AGN jets is crucial for understanding the mechanism for release and transport of energy in active galaxies.
It is natural to try to unlock blazar secrets by studying the relation between their ra- diation in different bands. Comparison of variability properties at two or more frequen- cies may provide information about the size (through the shortest observed variability timescale) and relative position (correlated variability and timelags) of the correspond- ing radiating regions. If a quasi-simultaneous SED of a blazar has been obtained – it may be modeled. Depending on specific SED model, it may potentially provide information about physical conditions in the blazar emission zone, properties of the BLR and/or dusty torus or accretion disk around the black hole as well as the black hole mass. A number of dedicated observing campaigns has been conducted aiming to study correlation between blazar variability at different bands and reconstruction and modeling of blazar SED at high and low luminosity states (Abdo et al. 2010f; Acciari et al. 2009c; Bach et al. 2006; Vercellone et al. 2010; Villata et al. 2009 are just a few recent examples). It is widely accepted, that multi-wavelength studies of variable
4
γ-ray blazars are crucial in addressing the questions about the high-energy emission processes and the mechanisms that convert the flow energy to the internal energy of the particle population (e.g., Abdo et al. 2010a; Marscher et al. 2008). However, until very recently difficulties in organizing observational campaigns have limited detailed studies to only a handful of individual AGN. The wide range of variability and often contradictory time lag behavior seen among wave-bands in this limited, heterogeneous sample underscores the need to obtain data on a wider range of objects.
Radio-loud AGNs and especially blazars are by far the most numerous and most luminous class of extragalacticγ-ray sources (Abdo et al. 2009; Giroletti et al. 2010;
Hartman et al. 1999; Kovalev 2009). This implies that there should be an intimate re- lation between the appearance of bright radio jet and the production ofγ-rays (Bloom 2008; Marscher 2006b; Salamon & Stecker 1994). However, the presence of a direct correlation between the total radio andγ-ray flux of blazars remains doubtful (Max- Moerbeck et al. 2009; Muecke et al. 1997). The main reason is that high-quality simul- taneous observations at both bands are needed on a time scale of years which will cover many episodes of blazar flaring activity. Since the launch of Fermi Gamma-ray Space Telescope in June 2008 such observations inγ-ray band finally became routinely pos- sible. A number of ongoing ground-based blazar radio flux monitoring programs are collecting data which may be useful forγ-ray—radio correlation studies (Aller et al.
2010; Angelakis et al. 2010; Kovalev & Kovalev 2006; Richards et al. 2010; Ter¨asranta et al. 2003).
Blazar variability behavior at radio band and its relation to blazar emission in other bands is further complicated by emission from the extended radio jet which cannot be spatially resolved by single-dish radio instruments. This problem can be attacked with the technique of the Very Long Baseline Interferometry (VLBI) discussed in the next section.
1.2 Parsec-scale study of AGN radio jets with VLBI
1.2.1 Jets aligned with the line of sight
Radio observations with Very Long Baseline Interferometry (VLBI) provide the high- est resolution view of parsec-scale AGN jets (e.g., Lobanov 2010a; Zensus 1997; Zen- sus et al. 2006). Parsec-scale structure of most radio sources (blazars) which are bright and compact enough to be detected with VLBI is dominated by a bright, unresolved or barely-resolved feature called the core. The core has a flat or inverted radio spectrum, characteristic of optically-thick synchrotron emission (Section 1.3). The exact physical nature of the structure which we observe as a parsec-scale core is still being debated (Marscher 2008; Section 4.1), however the available evidence currently favor its inter- pretation as a continuous Blandford & Konigl (1979) type jet with smooth gradients of physical properties along it. The observed position of the core at a given frequency is identified with the surface at which the optical depth τν ≈ 1 (photosphere) in the continuous jet. The observed position, rc(ν), of the core depends on the frequency of observation,ν, so that rc(ν)∝ν−1/k(this is so-called “core shift” effect, Fig. 1.3). If the dominating absorption mechanism in the core is synchrotron self-absorbed and there is an equipartition between particle and magnetic field energy in it, the power index k=1 (Blandford & Konigl 1979). The core shift can be used for determining basic physical properties of the ultra-compact region of the jet and the surrounding absorbing material (Lobanov 1998b). A detailed discussion of this effect may be found in Chapter 4.
5
A steep spectrum jet (often transversely unresolved) is usually found extending from the core. Its spectral shape is characteristic for optically-thin synchrotron emis- sion and results in jet being more pronounced at lower frequencies. An examples of such structure may be found in Fig. 2.3.
Figure 1.3: Scheme of a blazar jet. Note that mm-band core is located upstream (closer to central engine) than cm-band core due to the “core shift” effect. At any given fre- quency, sections of the jet upstream from the core corresponding to this frequency are hidden from sight by opacity. The “blazar zone”, site of the NIR, optical and high- energy emission, is located upstream from the mm-band core. Shocks traveling the jet could potentially also be responsible for a fraction of high-energy emission.
Bright features known as “components” often appear over a continuous jet flow (Fig. 4.1). Due to a limited dynamic range of VLBI observations, many jets appear as a series of discrete components while the underlying flow emission is too weak to be detected. Jet components are usually associated with shock waves propagating through the jet (Blandford & Konigl 1979; Marscher 2009). Components often display apparent superluminal motion (see Fig. 3.6 for an example). Alternatively, components may signify regions in a continuous bent jet which are more aligned with the line of sight (and are thus brighter due to higher relativistic beaming) then nearby jet regions.
The bending of a jet may occur due to flow instabilities or motion of the jet foot- point (e.g., Lobanov 2010b; Lobanov & Zensus 2001). Components resulting from a difference in angle to the line of sight (and therefore beaming) between sections of a continuous flow are not expected to show superluminal motion. It is possible that both components related to shocks and components related to jet bending may be found in real extragalactic jets.
Multi-epoch VLBI observations provide the only direct evidence for relativistic motion in AGN jets. Observations of jet kinematics are important to estimate total jet power, study the jet structure and geometry and how they change with time. Such observations may also constrain the jet acceleration mechanism (K¨onigl 2007). The relation between changes in parsec-scale jet and flux density and polarization changes
6
observed at other wavelength are still an open question and an interesting topic of re- search. If a sufficiently long VLBI time baseline is obtained, it is, in principle, possible to probe poorly known aspects of AGN outflows, including dynamical accelerations and instabilities, precession, collimation, and jet magnetic field stability. A number of multi-epoch VLBI monitoring programs aimed for investigating these and other ques- tions are currently in place (Lister et al. 2009; Marscher et al. 2009; Ojha et al. 2010;
Pushkarev & Kovalev 2008).
Multi-frequency VLBI observations provide constrains on SED models of blazars and therefore may be especially useful in the framework of a multi-wavelength cam- paign which samples the SED and its variability with time (Savolainen et al. 2008;
Sokolovsky et al. 2010a). Participation of a VLBI array in a long-term multi-frequency campaign also provides a unique opportunity to study the relation between changes in the parsec scale jet structure, polarization and the overall SED of the source. The relation between theγ-ray flares and the activity in the parsec-scale radio jet has been suggested by a number of authors (Jorstad et al. 2001; L¨ahteenm¨aki & Valtaoja 2003;
Marscher et al. 2010b).
1.2.2 Misaligned jets
The core – jet type structure associated with blazars is not the only option of how an AGN jet may look like on VLBI images. Approximately 7% of radio galaxies in complete, flux-limited samples display parsec-scale jets and lobe emission on both sides of a central engine (Taylor et al. 2000, 1996 and references therein). Two-sided jets are detected with VLBI in bright radio galaxies such as Cyg A (Bach et al. 2005, 2008) and NGC 1052 (Kadler et al. 2004). The so-called Compact Symmetric Objects (CSO; Readhead et al. 1996a; Wilkinson et al. 1994) also show emission on both sides of an active galactic nucleus (see Section 5.3). These objects are like radio galaxies in miniature, with hotspots and mini-lobes (not jets) usually dominating their parsec-scale radio emission (Fig. 1.4). Due to this obvious similarity of structure between CSO and large-scale radio galaxies it was suggested (Phillips & Mutel 1982) that they are young radio sources which would evolve into large radio sources.
Alternatively, Carvalho (1994, 1998) have suggested that CSOs are not small by virtue of youth, but rather are frustrated jets impeded by a dense interstellar medium.
With this model, the derived ages of the sources range from 106to 107yr. The random orientations of CSOs test the unified schemes of AGNs that require an obscuring torus of gas and dust surrounding the central engine. The angle that the line of sight of the observer makes with this torus determines which features are seen (Antonucci 1993;
Urry & Padovani 1995). CSOs often exhibit very broad HI absorption lines (Gupta et al. 2006; Peck et al. 2000; Pihlstr¨om et al. 2003; Taylor et al. 1999) and free-free ab- sorption (Peck et al. 1999), providing evidence for the existence of this circumnuclear torus. H2O megamasers also provide clues to circumnuclear tori in nearby AGNs (Lo 2005 and references therein). CSOs typically exhibit very low polarization (Gugliucci et al. 2007), if any, because of the large Faraday rotation measures induced by ionized gas associated with the torus (Gugliucci et al. 2005).
Kinematic ages can be obtained by measuring the separation speed between hot spots over time or the proper motion of a hot spot or jet component with respect to the core (Gugliucci et al. 2007). The measurement of a kinematic age for the CSO 0710+439 by Owsianik & Conway (1998) of just 1100±100 yr lent strong support to the theory that CSOs are small by virtue of their youth and not because of confinement.
The overall CSO age distribution seems to be disproportionately stacked toward the 7
Figure 1.4: Scheme of a Compact Symmetric Object (CSO) – a miniature radio source contained entirely within the Narrow Line Region (NLR) of its host galaxy.
younger ages (Gugliucci et al. 2007). Possible explanations are that there is a selection effect against older CSOs, that the jet activity tends to die offafter a certain period of time, or that CSOs have periods of deactivation and reactivation (Tingay et al. 2003). It is important to construct representative samples of CSOs which go down to low fluxes and are sensitive to symmetric objects of medium sizes in order to investigate these possibilities in detail.
Many CSOs exhibit a distinctive shape of the single-dish radio spectrum with peak at frequencies from a few hundred megahertz up to a few gigahertz (e.g., Polatidis
& Conway 2003). Radio sources with such spectral shape are known as Compact Steep-Spectrum (CSS) and Gigahertz Peaked-Spectrum (GPS) sources (O’Dea 1998;
see Section 5.1). Sensitive multi-frequency VLBI observations are required to demon- strate symmetric structure on the parsec scale (Taylor et al. 2000). In particular, not all GPS radio galaxies belong to the CSO class (Section 5.2).
1.3 Radiation from a homogeneous uniform synchrotron source and how it applies to jets
While a real relativistic jet is a complex structure, a small section of it (such as an indi- vidual jet component) may be approximately treated as a uniform cloud of magnetized plasma. The plasma is presumed to be leptonic with a power law particle energy dis-
8
tribution. The theory of synchrotron radiation from such cloud is well developed (see Sections 1.3.1, 1.3.2 and references therein).
The most notable spectral feature of a uniform synchrotron cloud is a peak, result- ing from synchrotron self-absorption at lower frequencies. Fig. 1.5 shows the theoret- ical spectrum of a uniform synchrotron emitting cloud. The spectrum is plotted in the usual spectral (Fν, Fig. 1.5a) and SED (νFν, Fig. 1.5b) representation. The optically thick part of this spectrum is characterized by a power law shape with the spectral index α= 5/2 (Fν ∝να). The optically thin part of the spectrum also has a power law shape and is characterized by a spectral indexα=(1−p)/2. Here p is the index in the par- ticle energy distribution N(E)∝ E−p. The abundance of celestial radio sources which spectra are characterized by a power law with α < 0 strongly supports the adopted assumption about the power law particle energy distribution.
0.001 0.01 0.1 1 10
0.1 1 10 100 1000
Fν (Jy = 10-23 ergs/s/cm2/Hz)
ν (GHz)
(a)
1e+07 1e+08 1e+09 1e+10
0.1 1 10 100 1000
ν Fν (ergs/s/cm2)
ν (GHz)
(b)
Figure 1.5: Theoretical spectrum of a uniform synchrotron source (Section 1.3.1) plot- ted in spectral (Fν, 1.5a) and SED (νFν, 1.5b) coordinates.
Flat spectra of compact cores require an explanation. The flat radio spectrum is usually explained as a result of emission from an inhomogeneous source. There are two most favored paradigms which suggest how such an inhomogeneous radio source near the base of an AGN jet may look like. The first one suggest that what we observe as a parsec-scale core is a surface at which the optical depthτν ≈1 (photosphere) in a continuous jet flow with gradually changing physical properties (Blandford & Konigl 1979). The other explanation, known as the “cosmic conspiracy”, suggests that the observed flat spectrum results from a series of distinct bright components which have spectral peaks at different frequencies (e.g., Marscher 1980).
In practice, spectrum of a parsec-scale core is not always flat. The spectral turnover caused by synchrotron self-absorption can often be identified if observations in a suf- ficiently wide frequency range are available (Chapter 2). It is unclear however, how such spectral turnover should be understood in the light of different interpretations of the core spectrum origin described above. The spectral turnover and physical parame- ters derived from its properties may correspond to a distinct component in the jet which has the lowest turnover frequency but is still too close to other components upstream to be spatially resolved from them. The next component downstream will be larger and will have even lower turnover frequency, however it will be spatially resolved and
9
will not contribute to the spectrum of the collection of components which we see as the core. Alternatively, the turnover may correspond to a section in a continuous jet (Blandford & Konigl 1979; Konigl 1981) where its properties suddenly change due to some disruption, and the lack of emission at lower frequencies from this jet region (due to opacity in it) is no longer fully compensated by optically thin emission from other regions downstream.
The self absorption turnover in the core spectrum carries information about the region near the downstream end of the structure which we observe as the core. How- ever, even if the spectral turnover is detected, the spectrum of the core region usually deviates significantly from the theoretical spectrum of a homogeneous source due to contribution of emission from nearby regions. Sometimes, the spectral turnover may be detected in a jet component spatially separated from the core (Savolainen et al. 2008;
Sokolovsky et al. 2010b). Spectrum of such component is usually much closer to the spectrum of a uniform source. This provides an opportunity to accurately determine physical conditions in such component.
Sections 1.3.1 and 1.3.2 will describe the relation between the observed parameters of synchrotron self-absorption peak in the spectrum and the physical parameters of the emitting plasma cloud.
1.3.1 Synchrotron radiation along the line of sight
Following Pacholczyk (1970), we consider a uniform cloud of relativistic electrons in the external uniform magnetic field with component B⊥ perpendicular to the line of sight. We assume that the electron energy distribution is described by a power law within a certain energy range:
N(E)= N0E−p, Emin <E <Emax,
where N0and p are constants. For this case, we can write the radiation transfer equation dIν
ds =−κνIν+ jν,
where Iν is the specific intensity of synchrotron radiation at the frequencyν, ds is the differential element of path length, jν is the emission coefficient (emissivity),κνis the absorption (extinction) coefficient. If jνandκν are constant along the line of sight, the solution of the radiation transfer equation is
Iν =
L
Z
0
jνe−
s
R
0
κνds
ds= jν
κν
(1−e−κνL),
where L is the size of the electron cloud along the line of sight, andκνL = τν is the optical depth.
According to Pacholczyk (1970), this solution can be written in the form:
Iν =S (ν1)J( ν ν1
,p), (1.1)
where
ν1=2c1(N0Lc6(p))2/(p+4)B(p+2)/(p+4)
⊥ , (1.2)
S (ν1)= c5(p)
c6(p)B−⊥1/2 ν1
2c1 5/2
, (1.3)
10