f
Dubois et al.: Enzymie and HPLC assays for uric acid compared 151 : J. Clin. Chem. Clin. Biochem.I Vol. 27, 1989, pp. 151-156
© 1989 Walter de Gruyter & Co.
' Berlin · New York l
! l An Enzymie Assay for Uric Acid in Serum and Urine
| Compared with HPLC
| By H. Dubois
Boehringer Mannheim GmbH, Mannheim, FRG B. Delvoux
Department of Clinical Chemistry and Pathobiochemistry, Medical Faculty, University of Technology, RWTH Aachen, Aachen, FRG
K Ehrhardt
Boehringer Mannheim GmbH, Mannheim, FRG and H. Greiling
Department of Clinical Chemistry and Pathobiochemistry, Medical Faculty, University of Technology, RWTH
\ Aachen, Aachen, FRG
\
ij (Received June 15/October 25, 1988)
Summary: We evaluated a colorimetric method for the assay of uric acid in serum or urine, which utilises a
Trinder chromogenic System modified by the inclusion of 2,4,6-tribromo-3-hydroxybenzoic acid for oxidative coupling to /^aminophenazone. Colour development (A
max: 512 nm) is complete within five minutes. Meas- urement of a sample blank is not needed. The procedure involves pre-incubation with ascorbic acid oxidase and detergent to eliminate interference by ascorbic acid and to abolish turbidity due to lipaemia; this pretreatment was effective up to l .14 mmol/1 ascorbate and up to at least 25 mmol/1 triacylglycerol. Interference by icteric sera was insignificant up to about 170 μιηοΐ/ΐ bilirubin. The method is linear up to at least 1428 μπιοΙ/1. In human serum and urine the procedure correlates well with HPLC and the uricase/?-aminophenazone method on the SMAC analyser. Within-run and between-run imprecisions of the enzymic test were higher than for HPLC, but did not exceed 1.2% (CV) and 2.5% (CV), respectively.
Attempts to improve the detection of H
2O
2led to the The concentration of uric acid in serum is the m st use of substituted phenols like 3,5-dichloro-2-hy- important parameter for the diagnosis of gout. Of the droxybenzenesulphonic acid (5) and 2,4-dichloro- methods developed (1^-4) for the determination of phenol (6). By oxidative coupling with /?-aminophen- this analytej those utilizing the highly specific uricase
1) azone, these compounds give a quinoneimine dye, reaction, with subsequent estimation of the H
2O
2from whose molar absorbance is 3 times greater than that the oxidation of uric acid, have gained widespread of the original Trinder reaction (7).
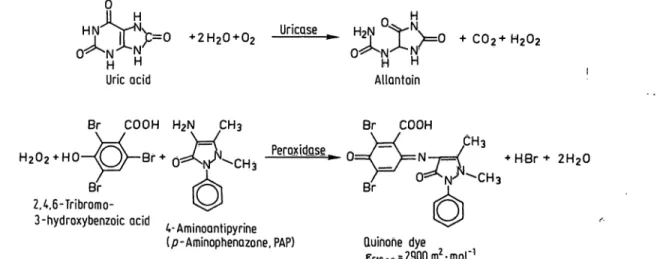
The phenolic component in our uric acid /?-amino- phenazone reagent is 2,4,6-tribromo-3-hydroxyben- zoic acid (fig, 1). The molar absorbance of its coupling
1
) Enzymes: product with D-aminophenazone exceeds that of the
Ascorbic acid oxidase (EC 1.10.3.3) j j u r , · + ι / ο Α n* ^^A
Peroxidase (EC 11117) compounds used by Fossati et al. (5) and Klose and Uricase (EC 1.7.3.3) co-workers (6).
J. Clin. Chem. Clin. Biochem. / Vol. 27,1989 / No. 3
The present communication reporls the imprecision, analytical ränge limits, interference by endogeneous serum constituents and accuracy of the uric acid p- aminophenazone test, and compares them with those of an HPLC method of established accuracy.
Materials and Methode Analytical procedures
The Boehringer Mannheim uric acid /?-aminophenazone test kit for mechanized analyses in serum, plasma and urine (Cat. No.
908 240, Boehringer Mannheim GmbH, FRG) was the subject of this evaluation study. Reagent l contains 0.1 mol/1 potassium phosphate (pH 7.8); 6 g/l poly(ethyleneglycol-alkylether); 9.6 mmol/1 sodium cholate; 24 mmol/1 2,4,6-tribromo-3-hydroxy- benzoic acid; > 5 kU/1 ascorbate oxidase1).
The reaction is started by addition of reagent 2 [0.1 mol/1 potassium phosphate, pH 7.8; 60 mmol/1 potassium hexacy- anoferrate (II); 0.12 mmol/1 4-aminoantipyrine; > l kU/1 peroxidase1); > 0.5 kU/1 uricase1)]. The reaction sequence is depicted in figure 1.
The test was run on a Boehringer Mannheim/Hitachi 705 anal- ysis System with Instrument settings according to the manufac- turer's recommendations:
Sample:
Temperature:
Sample volume:
Volume of Rl:
Volume of R2:
Measuring wavelength:
Reference wavelength:
Preincubation time:
Incubation time:
serum, urine (urine: diluted l: 5 with redistilled water)
25 °C 35010 600 nm70 505 nm 5 min 5 min
For comparison purposes, the Boehringer Mannheim uricase /7-aminophenazone test (Cat. No. 157104, Boehringer Mann- heim GmbH, FRG) was used on a SMAC analyser äs described by Klose et ai. (6).
HPLC was a reverse phase procedure developed by Greiling et al. (8).
GC/MS measurements of uric acid concentrations were per- formed äs published by Siekmann (9) in four human serum- based lyophilized sera.
All mechanized analyses with the uric acid /7-aminophenazone reagent were calibrated with the "calibrator for automated Systems" (Cat. No. 759 350, Lot No. 151264, Boehringer Mann- heim GmbH, FRG) which is based on lyophilized human serum. The calibration factor was determined by HPLC (10).
For purposes of quality control, we used four control sera (Precinorm® U, Cat. No. 171735, Lot No. 152620 and Lot No. 1-502; Precipath® U, Cat. No. 171 760, Lot Nos. 151 608 and 1-528, Boehringer Mannheim Gmbü, FRG), an aqueous Standard solution (Preciset® Uric Acid, Cat. No. 125 628, Boeh- ringer Mannheim GmbH, FRG) and human serum-based ly- ophilized Standards.
In order to prevent degradation of uric acid via urate anion free radical formation (11), the samples were stored in the dark until analysis.
Imprecision
Pool sera and control sera were analyzed with the uric acid p- aminophenazone test and the reference method at four different coöcentration levels. Within-series imprecision was derived from 20 measurements at each concentratiön level with fresh sera. Between-day imprecision was determined from measure- ments over 20 days with deep-frozen human sera and cöntrol sera.
Linearity and analytical ränge limits
A dilution series, prepared by mixing varying amounts of a uric acid-supplemented human serum and the same serum with- out added uric acid, was used to check the linearity. The lower limit of detection was calculated according to Kaiser (12), i.e.
from the mean plus three S. D. of 20 measurements of the blank.
Accuracy
The accuracy of the new method was investigated äs follows.
(A) Seventy fresh human sera and 40 urine samples covering a wide concentration ränge were assayed with the new uric acid /^aminophenazone test on the Hitachi 705, with the uricase p-aminophenazone methpd on the SMAC änalyser, and with the HPLC method, and the results were coni- pared.
(B) Four human serum-based lyophilized Standards were ana- lysed with the new method, with the reference method (GC/
MS) and with the HPLC method, and the results were compared.
UricQse
™ VV 0
O^N^N:
H HAllantoin
C02+H202
Br COOH H2N CH3 Br COOH
+ ·*· 2H20 Br
2,4,6-Tribromo-
3-hydroxybenzoic ocid , . . . . .4-Ammoantipynne
(p-Aminophenazone, PAP) Quinohe dye
E5ionm?2900m -mol
Fig. 1. Reaction principle of the enzymic uric acid /7-aminophenazone (PAP) method.
J. Clin. Chem. Clin. Bipchem. / Vol. 27,1989 / No. 3
Dubois et al.: Enzymic and HPLC assays for uric acid compared 153 (C) Using the new method, uric acid was measured in duplicate
in a 384 μιηοΐ/l aqueous primary Standard solution (SRM No. 913, National Bureau of Standards) which was used for standardization of the HPLC reference method.
(D) Using the new method, uric acid was measured in duplicate in a human serum-based reference material (SRM No. 909, National Bureau of Standards) with a certified value for uric acid which was also confirmed· by the HPLC method used in the present study.
(E) The recovery of test-specific target values was measured in duplicate in control sera over a period of 20 days, using the new method. The test-specific target values were estab- lished with a reference standardization in three independent laboratories using HPLC (8). The data obtained by each laboratory for each of the respective sera in five independ- ent runs and duplicate measurements were used for the assignment of target values.
Interference
Interference by haemoglobin was evaluated by adding increas- ing amounts of erythrocyte lysates to aliquots of pooled serum.
The haemoglobin concentrations were quantified with a cyan- methaemoglobin method (Cat. No. 124729, Boehringer Mann- heim GmbH, FRG).
We used two methods to examine the effect of bilirubin on the uric acid /?-aminophenazone reagent: the new method was ap- plied to a series of specimens with added crystalline bilirubin, and to icteric sera containing up to 461 μηιοΐ/ΐ native bilirubin;
the same samples were also analysed with the HPLC method.
Bilirubin concentrations were measured with the DPD method (Cat. No. 398128, Boehringer Mannheim GmbH, FRG).
Possible interference by lipaemia was simulated by supple- menting serum with Intralipid® (Pfrimmer & Co., FRG). A series of concentrations was prepared by mixing an aliquot of serum containing 10 g/l Intralipid® with an aliquot of the same Intralipid®-free serum. To compensate for the variable dilution resulting from the addition of lipids, we added proportional amounts of 0.154 mol/1 NaCl solution.
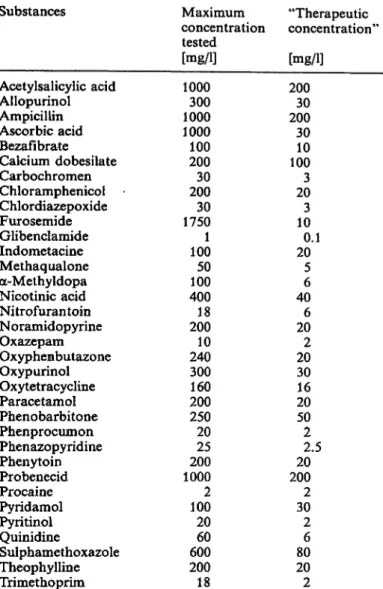
A total of 34 pharmaceuticals (see tab. 1) was tested in vitro according to I.e. (13).
Potential interference by ascorbic acid was investigated with a series of concentrations prepared by mixing aliquots of an ascorbic acid-supplemented serum pool (5.68 mmol/1) with var- iable amounts of the same serum without ascorbic acid. For these studies we used deep-frozen human sera.
Statistics
Regression was analysed s described by Passing & Bablok (14).
Results
Imprecision
The CV values obtained with the uric acid /?-amino- phenazone test did not exceed 1.2% and 2.5% for within-run and between-run imprecisipn, respectively (tab. 2). The imprecision study conducted with HPLC s the reference method revealed a within-run varia- bility of about 0.5% CV and between-run imprecision CVs in the r nge of 0.5% to 0.8% (tab. 3).
Tab. 1. Pharmaceuticals tested for possible interferences in vi- tro
Substances Maximum "Therapeutic
concentration concentration'1
tested
[mg/1] [mg/1]
Acetylsalicylic acid Allopurinol Ampicillin Ascorbic acid Bezafibrate Calcium dobesilate Carbochromen Chloramphenicol Chlordiazepoxide Furosemide Glibenclamide Indometacine Methaqualone oc-Methyldopa Nicotinic acid Nitrofurantoin Noramidopyrine Oxazepam Oxyphenbutazone Oxypurinol Oxytetracycline Paracetamol Phenobarbitone Phenprocumon Phenazopyridine Phenytoin Probenecid Procaine Pyridamol Pyritinol Quinidine
Sulphamethoxazole Theophylline Trimethoprim
1000300 10001000 100200 20030 175030 1001 10050 40018 20010 240300 200160 25020 20025 10002 10020 60060 20018
20030 20030 10010 203 103 200.1
56 406 202 2030 2016 502 202.5 2002
302 806 202
Tab. 2. Imprecision of the enzymic uric acid /7-aminophenazone method
Imprecision
Within run (n = 20)
Between run (n = 20)
Qimol/1]Mean 263317 499554 ' 263222 339549
CV [%]
0.81.2 0.41.0 2.02.5 2.52.0
Tab. 3. Imprecision of uric acid determinations with HPLC Imprecision
Within run (n = 20)
Between run (n = 20)
Mean[μηιοΐ/ΐ]
266322 513552 245357 511592
CV [%1 0.50.5 0.50.4 0.70.8 0.80.5
J. Clin. Chem. Clin. Bioehem. / Vol. 27,1989 / No. 3
Analytical r nge limits, linearity
The lower detection limit of the enzymic uric acid test, determined according to Kaiser (12), was found to be practically zero. This value was confirmed by measuring the dose-response relationship in a series of aqueous Solutions at uric acid concentrations of zero to 60 μηιοΐ/ΐ (data not shown).
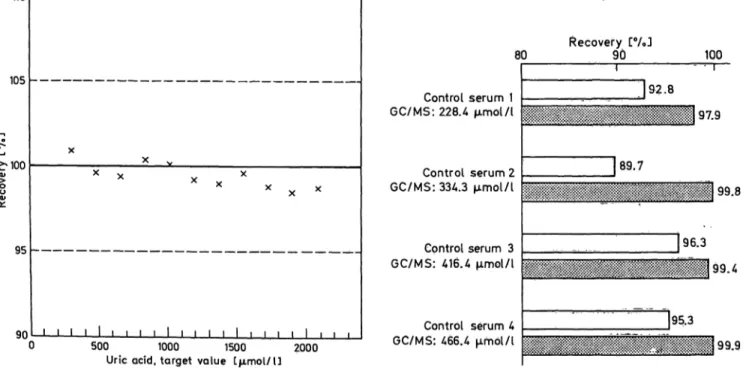
The dynamic r nge of linearity of the enzymic test was assessed by using human serum containing vary- ing amounts of added uric acid. Within the tested concentration r nge, which extended up to 1428 μπιοΐ/ΐ, the method was found to be linear (fig. 2).
Interferences
The usual anticoagulant concentrations (100 g/l NaF, 10 g/l EDTA, 100 · 10
3U/l heparin, 50 g/l citrate) do not influence the test results with the enzymic reagent.
Turbidity caused by lipaemia did not interfere in the enzymic uric acid test, s demonstrated by the failure of 10 g/l added Intralipid® to produce aberrant values.
Up to 186 μπιοΐ/ΐ haemoglobin, haemolysis causes no noticeable interference in the new enzymic test.
Studies on interference by bilirubin were equivocal.
Addition of commercial bilirubin to human serum led to a proportional decrease in the apparent uric acid concentration. When 427 μιηοΐ/ΐ crystalline bilirubin was added to serum containing uric acid in the normal r nge, the resulting decrease in the apparent uric acid concentration was approximately 60%.
When we compared the uric acid recovery of the enzymic method with that of HPLC in native icteric sera, we also invariably observed decreased apparent uric acid concentrations. In this case, however de- crease was markedly smaller and, furthermore, it de- pended on the particular serum sample. For example, with an icteric specimen containing 461 μιηοΐ/l bili- rubin we found a 22% deviation from the Value ob- tained with HPLC; on the other hand, other serum specimens with 137 — 171 μιηοΐ/ΐ bilirubin, showed no significant interference.
Of the 34 drugs tested, only calcium d besilate, o>
methyldopa and noramidopyrine interfered with the present uric acid /^aminophenazone test at therapeu^
tic concentrations. Calcium d besilate at 100 mg/1, a- methyldopa at 100 mg/1 and noramidopyrine at 20 mg/1 caused apparent decreases in the uric acid con- centration of about 50, 10 and 11%, respectively.
Ascorbic acid does not cause errone usly low results, until its concentration exceeds 1.14 mmol/1.
Accur cy
As shown in figure 3, recovery from c ntrol sera with the /7-aminophenazone reagent is 4—10% lower than with GC/MS and HPLC.
The recovery of test-specific target values with the new test in four different c ntrol sera was found to vary from 99.5 to 102.6% (tab. 4).
110
105
^100
95
90 500 1000 1500 2000
Uric acid, target value ίμπηοΐ/ΐ]
80
C ntrol serum 1 GC/MS: 228.4 μπιοΐ/ΐ
C ntrol serum 2 GC/MS: 334.3 μπηοΐ/ΐ
Cpntrol serum 3 GC/MS: 416.4 μπηοΐ/ΐ
C ntrol serum 4 GC/MS: 466.4 μΓηοΙ/Ι
Recovery [%J
90 100
J92.8 97.9
89.7
99.8
96.3
J95.3 99.4
99.9
Fig. 2. Linearity of the enzymic uric acid /7-aminophenazone Fig. 3. Recovery of GC/MS values in c ntrol sera.
(PAP) method. aWhite columns: Uric acid PAP; gray columns: HPLC
J. Clin. Chem. Clin. Biochem.' / Vol. 27,1989 / No. 3
Dubois et al.: Enzymic and HPLC assays for uric acid compared 155 Tab. 4. Recovery of test-specific target values in control sera
with the uric acid p-aminophenazone test Target value
[μπιοΐ/ΐ]
246.3 264.7 536.6 558.0
Recovery ± [%]
102.6 ± 3.1 102.2 ± 2.8 101.4 ± 1.6 99.5 ± 3.7
S.D.
Additionally, we examined the recovery with this col- our test in the aqueous primary Standard used for HPLC calibration and a human serum-based refer- ence material. These measurements resulted in 100.3% and 99.9% recoveries of the respective target values (aqueous primary Standard: 384 μηιοΐ/ΐ; human serum-based control material: 483 μιηοΐ/ΐ).
For method comparison, we analysed human serum and urine samples with the proposed method and HPLC. Furthermore, the uric acid /j-amin phenazone test was compared with the uricase/7-aminophenazone method on the SMAC analyser in human sera. We found the present test (y) to agree well with HPLC (x) in both human serum (y = 0.30 + 0.97x;
r = 0.995) and urine (y = 2.00 + 1.03x; r = 0.989) (fig. 4, 5). A similar good agreement exists between the proposed method (y) and the uricase /j-amino- phenazone test (x) on the SMAC analyser (y =5 - 0.05 + l.OOx; r = 0.981, flg. 6).
1000
800
E 600
DL
ε 400
200
200 400 600 800
Urie acid (HPLC method) ΓμιϋοΙ/ΊJ 1000 Fig. 4. Comparison of the uric acid p-aminophenazone (PAP) test (y) with HPLC (x), using human sera (n = 70, y = 0.30 + 0.97x, r « 0,995).
8000
2000 4000 6000
Uric acid (HPLC method) Γμπηοΐ/ϋ 8000 Fig. 5. Comparison of the uric acid /7-aminophenazone (PAP)
test (y) with HPLC (x), using urine samples (n = 40, y = - 2.00 + 1.03x, r = 0.989).
800
•o 600 E .
400
Z) 200
y = x
200 400 600
Uric acid (uricase PAP method) Εμπηοΐ/l) 800 Fig. 6. Comparison of the uric acid p-aminophenazone (PAP) test (y) with the uricase p-aminophenazone (PAP) method on the SMAC analyser (x), using human sera (n = 70, y = - 4.54 H- l.Olx, r = 0.990).
Discussion
We evaluated an enzymic reagent for the determina- tion of uric acid in serum and urine which utilizes a modified Trinder chromogenic system. The phenolic compound used couples oxidatively with /?-amino- phenazone, forming a quinone imine dye with im- proved molar absorbance. Hence, the sample/reagent ratio in our assay could be kept low, thus reducing possible interference by sample constituents to a min- imuin, while retaining satisfactory sensitivity and pre- cision.
J. Clin. Chem. Clin. Biochem. / Vol. 27, 1989 / No. 3
Optimization of component concentrations and assay pH ensured completion of colour development within 5 min at 25 °C or 37 °C, and a dynamic measuring r nge extending from zero concentration up to a level probably exceeding the highest level tested in this study which was 1428 μιηοΐ/ΐ. Because of the short incubation times required for preincubation and max- imum colour development, this assay can be conve- niently adapted to mechanised Systems which are ca- pable of pipetting a Start reagent.
In order to overcome the well known interference of ascorbic acid in Trinder chromogenic Systems, a prein- cubation step has been included in this new assay during which any ascorbic acid is destroyed by as- corbate oxidase. The ascorbate degrading capacity in our assay is sufficient to eliminate ascorbate concen- trations greater than l mmol/1 within 5 min,
Interference by the turbidity of lipaemic sera was avoided in our test by addition of detergent to the preincubation solution, which proved to be effective at least up to ^concentration of 10 g/l added lipid, being equivalent to about 28.6 mmol/1 triacylglycerols (15).
Interference by bilirubin due to chemical and simple spectral effects has been reported for several peroxi- dase-coupled enzymic colour tests (16). When we measured uric acid concentrations with the new en- zymic /7-aminophenazone reagent in native icteric sera, however, we consistently observed significantly decreased recoveries of HPLC-defined analyte con-
centrations only when the bilirubin concentration was above 170 μτηοΐ/ΐ. An explanation of this finding may be that the different bilirubin species contained in the individual pathological sera (17) have a different ca- pacity for interference with the assay. Support of this view comes from data obtained recently with an en- zymic creatinine /?-aminophenazone method (18). In these studies, Guder et al. found variable relationship between assay interference and the bilirubin content of icteric sera, and significant disturbance was not detected up to 120 μιηοΐ/ΐ bilirubin.
In the analysis of human serum and urine samples, s well s aqueous primary Standard solution and human serum-based reference material with the en- zymic /7-aminophenazone method, we obtained results agreeing closely with those attained with HPLC, which has been proposed s reference method for uric acid determination (19). In control sera, on the other hand, the enzymic test yielded somewhat lower values compared with HPLC. Therefore, it will be essential to define specific target val es in c ntf l material for the /7-aminophenazone method.
In conclusion, the enzymic pirocedure evaluated in this study is considered to be a reliable method for routine uric acid determinations. Only samples with uncommonly high bilirubin levels, and specimens from patients receiving calcium dobesilate, a-meth- yldopa and noramidopyrine may give poof assay re^
sults by the proposed method. In such cases analyses should be run with a method known to be insensitive to these interferences.
References
1. Praetorius, E. & Poulsen, H. (1953) Scand. J. Clin. Lab.
Invest. 5, 273-280.
2. Haeckel, R. (1976) J. Clin. Chem. Clin. Biochem. 14,101 - 3. James, D. R. & Price, C. P. (1984) Ann. Clin. Biochem. 21,107.
4. Kageyama, N. (1971) Clin. Chim. Acta 31, 421-426.405.
5. Fossati, R, Prencipe, L. & Berti, G. (1980) Clin. Chem. 26, 227-231.
6. Klose, S., Stoitz, M., M nz, E. & Portenhauser, R. (1978) Ciin. Chem. 24, 250-255.
7. Trinder, P. (1969) Ann. Clin. Biochem. 6, 24-27.
8. Kock, R., Delvoux, R, Tillmanns, U. & Greiling, H. (1989) J. Clin. Chem. Clin. Biochem. 27, 157-162.
9. Siekmann, L. (1985) J. Clin. Chem. Clin. Biochem. 23, 129-135.
10. Passing, H., Bablok, W. & Glocke, M. (1981) Clin. Chem.
Clin. Biochem. 79, 1167-1179.
11. Maples, K. R. & Mason, R. P. (1988) J. Biol. Chem. 263, 1709-1712.
12. Kaiser, H. (1965) Fresenius Z. Analyt. Chem. 209, 1-18.
13. Staber, G., Busch, E. W. & Koller, P. U. (1982) Med. Lab.
35,10-13.
14. Passing, H. & Bablok, W. (1984) Clin. Chem. Clin.
Biochem. 22, 431 -445.
15. Glick, M. R., Ryder, K. W. & Jackson, S. A. (1986) Ciin.
Chem. 32, 470-475.
16. Spain, M. A. & Wu, A. H. B. (1986) Clin. Chem. 32, 518- 17. Lauff, J. J., Kasper, M. E. & Ambrose, R. T. (1983) Clin.521.
Chem. 29, 800-805.
18. Guder, W. G., Hoffmann, G. E., Hubbuch, A., Poppe, W.
A., Siedel, J. & Price, C. P. (1986) J. Clin. Chem. Clin.
Biochem. 24, 889-902.
19. Ingebretsen, O. Ch., Borgen, J. & Farstad, M. (1982) In:
XI International Congress of Clihical Chemistry (Kaiser, E., Gabi, F., M ller, M. M. & Bayer, R M., eds.) Walter de Gruyter & Co., Berlin-New York, pp. 983-987.
Dr. H. Dubois
Boehringer Mannheim GmbH Dept. DM-EFH
Sandhofer Str. 116 D-680 Mannheim 31
J. Clin. Chem. Clin. Biochem! / Vol. 27,1989 / No. 3