Marwaha and Johnson: Radio!mmunoassay for digoxin in urine 403 J. Clin. Chem. Clin. Biochem.
Vol. 22, 1984, pp. 403-406
A Radioimmunoassay for Digoxin in Human Urine
By R. K. Marwaha and B. F. Johnson
Department of Clinical Pharmacology University of Massachusetts Medical School Worcester, Massachusetts 01605
(Received June 6, 1983/February 16, 1984)
Summary: We report a digoxin radioimmunoassay in human urine employing commercially available rea- gents. The calibration curve has a mean correlation coefficient of -0.994 and is linear up to 16.0 g/l. The average coefficients of Variation between and within the runs are 3.6% and 3.5% respectively. The assay has a recovery of 101.4% and 98.9% at low and high levels of digoxin excretion respectively. Dihydrodigoxin at concentrations of 4, 8 and 16 g/l has relative cross reactivities of 12.0%, 7.7% and 4.8% respectively. The assay was applied to compare within-patient and between-patient variability during treatments with Lanoxin®
and Lanoxicaps® at steady-state.
Precision, sensitivity, broad ränge linearity, convenience of commercially available reagents, insignificant cross reactivity of dihydrodigoxin with the digoxin antibody complex and urinary digoxin excretory data at different dilutions validate our assay for routine monitoring of urinary digoxin.
Radioimmunassay für Digoxin im Harn des Menschen
Zusammenfassung: Wir teilen einen Radioimmunassay für Digoxin im Harn des Menschen unter Verwen- dung käuflich erhältlicher Reagenzien mit. Die Standardkurve zeigt einen mittleren Korrelationskoeffizienten von —0,994 und ist bis zu 16 g/l linear. Die mittleren Variationskoeffizienten in der Serie und von Tag zu Tag betragen 3,6% bzw. 3,5%. Das Verfahren hat eine Wiederfindung von 101,4% bei niedrigen und 98,9%
bei hohen Werten der Digoxinausscheidung. Dihydrodigoxin weist bei Konzentrationen von 4, 8 und 16 g/l relative Kreuzreaktivitäten von 12,0, 7,7 bzw. 4,8% auf.
Die Bestimmung wurde für den Vergleich der Variabilität am gleichen Patienten und zwischen den Patienten während der Behandlung mit Lanoxin® und Lanoxicaps® im Gleichgewichtszustand angewandt.
Präzision, Empfindlichkeit, weiter Linearitätsbereich, die Annehmlichkeit käuflich erhältlicher Reagenzien, unbedeutende Kreüzreaktivität von Dihydrodigoxin mit dem Digoxin-Antikörper-Komplex sowie die Daten für die Ausscheidung von Digoxin ^im Harn bei unterschiedlichen Verdünnungen zeigen den Wert der Me- thode für die routinemäßige Überprüfung von Digoxin im Harn.
n ro ue modify a commercially available radioimmunoassay Research work involving cardioglycosides has been kit to develop a simple and convenient method that limited to some extent by scarcity of Information was usable for urine samples. In addition we checked about radioimmunoassays for digoxin in human the relative cross reactivity of dihydrodigoxin with urine (1—5). The present work was undertaken to the digoxin antibody complex used in the assay.
J. Clin. Chem. Clin. Biochem. / Vol. 22,1984 / No. 6
404 Marwaha and Johnson: Radioimmunoassay for digoxin in urine
Methods and Materials R e a g e n t s
Assay buffer
Monosodium phosphate monohydrate (i.84g), disodium phos- phatc (3.78 g) and sodium azide (1.0 g) were dissolved in 600 ml of deionized water. 5.0g of bovine serum albumin (RIA-grade, Fraction V, Sigma Chemical Company, P.O. Box 14508» St.
Louis, MO 63178) was added with constant stirring. The solution was adjusted to pH 7.4 at room temperature with 10 mol/1 NaOH and then diluted with deionized water to 1.01 in a Volumetrie flask.
serum, and they were processed in the same way s Standards ex- cept antiserum addition was repiaced by the same volume of blank antiserum. The urine controls and recovery samples were diluted before analysis so that their concentration feil in the middle por- tion of the calibration curve. The concentrati n in the samples was calculated using log-log transformation and then multiplying with the dilution factor of the sample. {,
Dihydrodigoxin spiked samples were run in the same way s Stan- dards and controls. The apparent digoxin concentration for dihy- drodigoxin was calculated using the same log-log transformation and digoxin calibration curve.
Digoxin stock solution
Crystalline digoxin (10mg, No. C037, Burroughs Wellcome Company, Research Triangle Park, NC 27709) was weighed out to the hundreth of a milligram and dissolved in 250 ml of ethanol/
water (80 + 20 by volume). The first ten fold dilution in ethanol/
water (20 + 80 by volume) was followed with another ten fold dilution in assay buffer to produce a digoxin stock solution of 0.4 mg/1.
Urine stock, Standards and controls
Digoxin stock solution (10 ml) was made up to 50 ml with digox- in-free normal human urine to produce a urine stock of 80 μg/l concentration. The urine Standards 0.64, 0.96, 2.0, 4.0, 8.0 and 16.0 μg/l were prepared by appropriate dilution of urine stock with assay buffer. A zero concentration of Standard stock urine was made by five fold dilution of digoxin-free normal human urine with assay buffer.
The controls in low (16 μg/l), mid (40 μg/l) and high (80 μg/l) ranges were made by spiking digoxin-free normal human urine with digoxin stock solution. For recovery studies, two urine ppols with 24 μg/l and 48 μg/l concentration were prepared from digox- in stock solution in the same way s the urine controls.
Dihydrodigoxin (Kontroll-Nr. 202385, Boehringer Mannheim Biochemicals, Indianapolis, IN 46250) stock solution of 0.4 mg/1 was also prepared in the same way s the digoxin stock solution.
For cross reactivity studies, the digoxin-free normal human urine was spiked with dihydrodigoxin stock solution to produce concen- trations of 4, 8 and 16 μg/l.
125l-labe ed digoxin and antiserum complex
Both I25I-labelled digoxin and antiserum complex (part of the regul r RIA-NEN Digoxin (1-125) radioimmunoassay kit, Cat.
No. ΝΕΑ 082, New England Nuclear, North Billerica, MA 01862) were used s such. The digoxin antibody variations were minimized by using a single lot of antiserum complex (Lot No.
PC-033) and blank antiserum (Lot No. PC-231).
Assay procedure
The RIA was done by pipetting duplicate 0.1 ml aliquots of each Standard into 12 x 75 mm borosilicate glass tubes containing 0.1 ml digoxin-free normal human serum. This was followed with the addition of 0.5 ml of 125I-labelled digoxin into each tube, and the mixture was vortexed. As soon s tracer (125I-labelled digox- in) was added, each tube was mixed with 0.5 ml of antiserum com- plex and incubated for 30 min at room temperature. Subsequent- ly, the tubes were centrifuged at 1674 £ for 10 min, decanted and counted for radioactivity in a gamma scintillation counter (Model Searle 1185, Tracor Analytical Inc., 1842 Brummel Drive, Elk Grove Village, IL 60007).
The duplicate set of nonspecific binding tubes was prepared by pipetting 0.1 ml of urine zero Standard into 12 x 75 mm borosili- cate glass tubes containing 0.1 ml of digoxin-free normal human
Results and Discussion
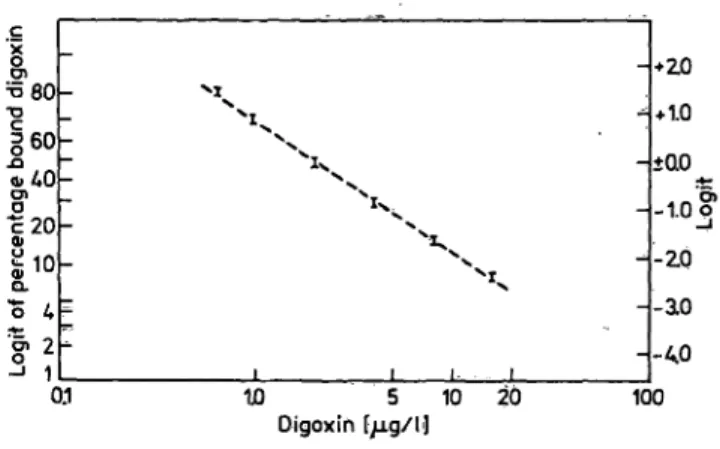
Table l summarizes the assay data for severiteen uri- nary digoxin assays. The calibration curve has a mean correlation coefficient of -0.994 + 0.0025 us- ing log-log transformation. The curve is linear up to 16.0 μg/l when plotted on a logit-log graph (fig. 1).
Data in table l and figure l suggest good reproduci- bility, resolution and linearity over a broad r nge.
The intra-assay Variation determined using ten repli- cates at low (16 μg/l), mid (40 μ|/1) and high (80 μg/l) concentrations is shown in table 2. Day to day
Tab. 1. Relative binding data for seventeen digoxin calibration curves.
Sample No.
12 43 56
Concentration (Mg/l)
0.64
0.96 v· '-· '*
2.04.0 16.08.0
B/BO
(Mean ± SD)0.808 ± 0.0099 0.701+0.0154 0.490 ± 0.0239 0.294 ± 0.0158 0.160 ±0.0072 0.088 ± 0.0061 Mean correlation coefficient = -0.994 ± 0.0025 (log-log trans- formation).
.£x
=680TOc J60 Φ ΛΟσ
|20 g.10
o 4 l2
-* 1 -
^I
— Χχι ~
h- VNXV
h X
Xv
t \ :
XE - _
l L L L
* +1.0
±QO -1.0 -ZQ
-ao
-A.O 0.1 tO 5 10 20
Digoxin [/ig/1] 100
Fig. l. Composite calibration curve of seventeen urinary digoxin assays. Log of digoxin concentration (abscissa) is plotted against logit of percentage bound (B/B ). Bars indicate one Standard deviation about »tfre mean value calculated for each duplicate assay.
J. Clin. Chem, Clin. Biochem. / Vol. 22, 1984 / No. 6
Marwaha and Johnson: Radioimmunoassay for digoxin in urine 405
Tab. 2. Assessment of reproducibiüty.
Di-goxin concen- tration (« ) 4016 80
Intraassay Variation n*
Mean ± S. D.
17.17 ±0.35 39.11 ± 1.92 82.80 ± 3.02
CV
(%)
2.06 13 4.92 15 3.64 15
Interassay Variation Mean ± S.D.
17. 18 ±1.08 39.00 ± 1.79 82.81 ± 3.06
CV
(%)
2.64 4.553.69
* n = Number of assays run in duplicatc
Tab. 3. Analytical recovery of digoxin.
H Digoxin added (\ag/\)
Digoxin recovered ( g/l) Recovery (%)
n*
24.33 ± 0.5624 101.4
13
4847.47 ± 98.914
1.6
n = Number of assays run in duplicate
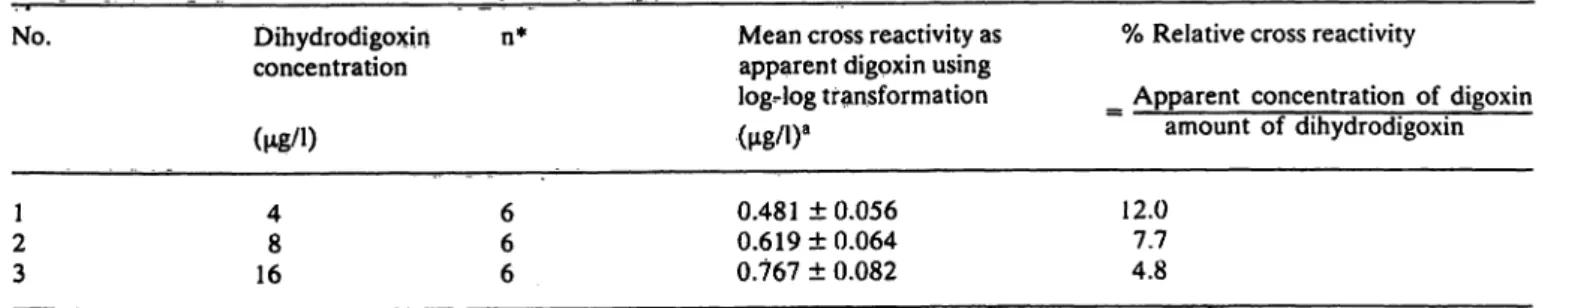
variability at low, mid and high control levels is insig- nificant (tab. 2). The assay accuracy determined by analytical recovery studies is 101.4% at a low level of digoxin excretion and 98.9% at a high level of digoxin excretion (tab. 3). The relative cross reactiv- ities of dihydrödigoxin at concentrations of 4, 8 and 16 g/l are 12.0%, 7.7%, and 4.8% respectively (tab. 4).
The present assay is linear up to 16.0 g/l in contrast to linearity up to 6.3 g/l öf a recently reported ra- dioirnmunoassay for urinary digoxin measurement (4). As urinary digoxin levels are always much higher and more variable than plasma digoxin levels, it is usually necessary to analyze multiple dilutions of each sample. The broad ränge linearity of our cali- bration curve obviates this need.
Dihydrödigoxin is the major cardio-inactive metab- olite of digoxin found in measurable quantity in hu- man plasma (6), and urine (7). Its cross reactivity with commercially available digoxin RIA kits can vary äs much äs 30% (8-9). This may be due to the difference in antibody titer, method of attaching ra- diolabel to digoxin or digoxin derivative, or Separa- tion techniques employed in the kit for bound and free antigen (8-10). A high degree of dihydrödigox- in) cross reactivity with digoxin antibody will not on- ly give false plasma digoxin levels, but will also affect bioavailability data based on urinary measurements (11). The relative cross reactivity for dihydrodigoxin of up to 12.0% in the present assay will produce in- significant change in urinary digoxin measurements.
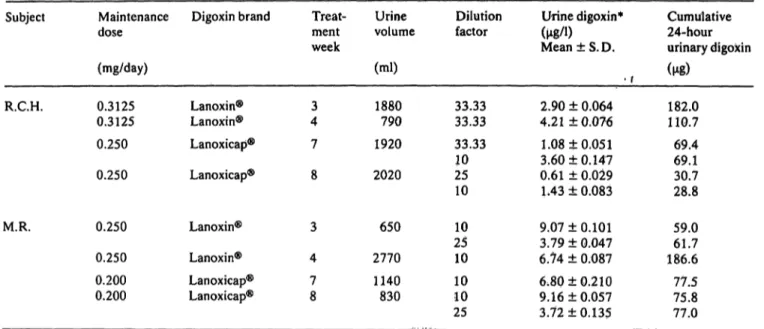
The present assay was used to compare within-pa- tient and between-patient variability for cumulative digoxin excretion during treatments with Lanoxin®
(digoxin in tablet) and Lanoxicaps® (digoxin solu- tion in capsule) in patients in whom steady state se- rum concentrations were in the therapeutic ränge (0.8—2.0 g/l). These treatments were compared in a multiple dose, cross-over design study in 29 adult patients who required digoxin.
Every patient was studied for two treatment periods each lasting four weeks. The patients consumed their daily dose of Lanoxin® tablets or Lanoxicaps® äs a single dose at 9:30 a. m. (after breakfast). Four urine samples, one each during the 3rd, 4th, 7th and 8th week of the study period in each patient, were col- lected and analyzed for 24 hour cumulative digoxin excretion. Each urine collection started when the last maintenance dose was administered and terminated 24 hours later. Table 5 documents 24 hour cumula- tive digoxin excretion during the 3rd, 4th, 7th and 8th week of the study period in two representative patients.
Thus, the precision, broad-range linearity, availabili- ty of commercially available reagents, insignificant
Tab. 4. Relative cross reactivity of dihydrodigoxin with digoxin antibody complex.
No. Dihydrodigoxin n*
concentration
fue/n
Mean cross reactivity äs apparent digoxin using log-log transformation
% Relative cross reactivity
_ Apparent concentration of digoxin amount of dihydrodigoxin 21
3
48 16
66 6
0.481 ±0.056 0.619 ± 0.064 0.767 ± 0.082
12.07.7 4.8
* n = Number of assays performed in duplicate
a Due to small differences in molecular weight (2 mass units) the concentrations of both digoxin and dthydrodigoxin are expressed in
J. Clin. Chem. CHn. Biochem. / Vol. 22, 1984 / No. 6
406 Marwaha and Johnson: Radioimmunoassay for digoxin in urine
Tab. 5. Cumulative 24-hour digoxin excretion in urine samples of two patients.
Subject
R.C.H.
M.R.
Maintenance dose (mg/day) 0.3125 0.3125 0.250 0.250
0.250 0.250 0.200 0.200
Digoxin brand
Lanoxin®
Lanoxin®
Lanoxicap®
Lanoxicap®
Lanoxin®
Lanoxin®
Lanoxicap®
Lanoxicap®
Treat- ment week
43 7 8
3 4 78
Urine volume (ml) 1880790 1920 2020
650 2770 1140830
Dilution factor
33.33 33.33 33.33 1025 10 2510 10 1010 25
Urine digoxin*
(M/0Mean±S.D.
• r 2.90 ± 0.064 4.21 ±0.076 1.08 ±0.051 3.60 ±0.147 0.61 ± 0.029 L43 ± 0.083 9.07 ±0.101 3.79 ± 0.047 6.74 ± 0.087 6.80 ±0.210 9.16 ±0.057 3.72 + 0.135
Cumulative 24-hour urinary digoxin ( )
182.0 110.7 69.4 69.130.7 28.8 59.061.7 186.6 77.5 75.8 77.0
* Each assay was run in quadruplicate.
dihydrodigoxin cross-reactivity with digoxin anti- body complex, and urinary digoxin excretory data at different dilutions under normal clinical conditions
pfovide an excellent basis for the use of our assay for routine urinary digoxin measurements.
References
1. Brock, A. (1974) Acta Pharmacol. Toxicol. 34, 198-204.
2. Greenwood, H., Snedden, W., Hayward, R. P. & Landon, J.
(1975) Clin. Chim. Acta 62, 213-224.
3. Nore, A. K., Storstein, L., Larsen, A. & Amlie, J. P. (1980) Clin. Chem. 26, 321-323.
4. Christenson, R. H., Hammond, J. E., Hüll, J. H. & Bustrack, J. A. (1982) Clin. Chim. Acta 720, 13-19.
5. Wagner, J. G., Hallmark, M. R., Sakmar, E. & Ayres, J. W.
(1977) Steroids 29, 787-807.
6. Clark, D. R. & Kaiman, S. M. (1974) Drug Metab. Dispos. 2, 148-150.
7. Lindenbaum, J., Tse-Eng, D., Butler, V. P. Jr. & Rund, D. G.
(1981) Am. J. Med. 71, 67-74.
8. Oge, E. K. & Polonus, P. A. (1978) Clin. Chem. 24, 1086.
9. Kramer, W. G., Bathala, M. S.v& Reuhing, R. H. (1976) Res.
Commun. Chem. Pathol. Pharmacol. 14, 83-88.
10. Kramer, W. G., Kinnear, N. L. & Morgan, H. K. (1978) Clin.
Chem. 24, 155-157.
11. Malini, P. L., Marata, A. M., Strocchi, E. & Ambrösioni, E.
(1982) Clin. Chem. 28, 2445-2446.
Raj K. Marwaha
Division of Clinical Pharmacology Univ. of Massachusetts Medicäl Center 55 Lake Avenue North
Worcester, Mass 01605 USA
J. Clin. Chem. Clin. Biöchem. / Vol. 22,1984 / No. 6