2010/300
Association between serum uric acid and non-alcoholic fatty liver disease in Korean adults
Yong-Jae Lee1, Hye-Ree Lee1, Jung-Hyun Lee2, Youn-Ho Shin3and Jae-Yong Shim1,*
1Department of Family Medicine, Yonsei University College of Medicine, Seoul, Korea
2Department of Health Promotion Center, Gangnam Severance Hospital, Yonsei University College of Medicine, Seoul, Korea
3Department of Pediatrics, CHA University College of Medicine, Seoul, Korea
Abstract
Background: Increased uric acid is associated with the metabolic syndrome, conditions linked to oxidative stress and insulin resistance. Non-alcoholic fatty liver disease (NAFLD) is now considered a hepatic manifestation of insu- lin resistance. However, little has been written regarding the association between uric acid and NAFLD.
Methods: We examined the association between uric acid and the presence of NAFLD in 3768 Koreans (2133 men, 1635 women; aged 20–75 years) in a health examination program. Uric acid quartiles were categorized separately as follows: Q1: F291.5, Q2: 291.6–333.1, Q3: 333.2–380.7, and Q4: G380.8 mmol/L for men; Q1: F202.2, Q2:
202.3–232.0, Q3: 231.1–267.7, and Q4:G267.8mmol/L for women. Hepatic steatosis was diagnosed based on abdominal ultrasonographic findings by hyperechogenicity of liver tis- sue, difference of echogenicity between the liver and dia- phragm, and visibility of vascular structures. The odds ratios (ORs) and 95% confidence intervals (CIs) for NAFLD were calculated across each quartile of serum uric acid.
Results: The prevalence of NAFLD was 25.8% (32.2% in men and 17.4% in women). After adjustment for age, body mass index (BMI), smoking, regular exercise, blood pressure, fasting plasma glucose (FPG), triglycerides, and high-density lipoprotein (HDL) cholesterol, the ORs (95% CIs) for NAFLD according to each quartile of uric acid were 1.00, 1.55 (1.13–2.14), 1.77 (1.30–2.41), and 2.01 (1.45–2.78) for men and 1.00, 0.69 (0.40–1.20), 1.12 (0.67–1.88), and 1.94 (1.21–3.13) for women.
*Corresponding author: Jae-Yong Shim, MD, MPH, PhD, Associate Professor, Department of Family Medicine, Yonsei University College of Medicine, 146-92 Dogok-dong, Gangnam-gu, Seoul, 135-720, Korea
Phone:q82-2-2019-3482, Fax:q82-2-3463-3287, E-mail: hope@yuhs.ac
Received June 7, 2009; accepted September 29, 2009;
previously published online December 7, 2009
Conclusions: Serum uric acid is independently associated with the presence of NAFLD, and uric acid may be a useful additional measure in assessing the risk of NAFLD in the clinical setting.
Clin Chem Lab Med 2010;48:175–80.
Keywords: inflammation; insulin resistance; non-alcoholic fatty liver disease; uric acid.
Introduction
Uric acid is the major end product of purine metabolism and is formed from xanthine by the action of xanthine oxidore- ductase (1). Serum uric acid concentrations have long been considered a marker of gout or urolithiasis. However, emerg- ing evidence suggests that increased uric acid, despite being a major antioxidant in the human plasma (2), is associated with the prevalence and incidence of cardiovascular disease (CVD) (3), diabetes (4) and metabolic syndrome (5, 6), con- ditions linked to increased oxidative stress, chronic low- grade inflammation, and insulin resistance (7, 8).
Non-alcoholic fatty liver disease (NAFLD) is defined as a diffuse accumulation of fat in the liver, after excluding excessive alcohol intake and other causes of liver disease.
NAFLD has clinical implications because of its increasing prevalence worldwide and its potential to progress to advanced cirrhosis and hepatic failure (9, 10). Along with the ‘‘obesity epidemic’’, the worldwide prevalence of NAFLD, based on imaging studies, is increasing rapidly and now includes 14%–31% of the general population (11). It is generally attributed to obesity-induced insulin resistance.
The development of NAFLD is closely associated with the metabolic syndrome and the association between serum uric acid concentration and metabolic syndrome has been dem- onstrated in previous studies (10, 11), which leads us to spec- ulate that there might be a relationship between uric acid concentrations and NAFLD. Although several laboratory parameters, such as alanine aminotransferase (ALT), the homeostasis model assessment of insulin resistance (HOMA- IR) index, and C-reactive protein (CRP) have been reported as useful markers for the diagnosis of NAFLD (12, 13), little has been written regarding the association between uric acid and NAFLD. Therefore, we performed a cross-sectional study to examine whether serum uric acid concentrations are related to NAFLD as determined by abdominal ultrasono- graphy in 3768 Korean adults (2133 men, 1635 women; ages 20–75 years) from the health risk assessment study (HERAS) cohort.
Materials and Methods Study population
The HERAS cohort consisted of 5342 subjects (2347 men and 2995 women) who voluntarily visited the Health Promotion Center, Gang- nam Severance Hospital, Seoul, Korea, for a routine health check up between March 2006 and May 2007. Because Koreans are a group of East Asians with ethnic homogeneity and lower body mass index (BMI) compared to Westerners, different ethnicity and life- style factors of Koreans may affect CVD risk factors in different ways. This cohort was used to characterize the ethnic specific CVD risk factors and explore surrogate markers for CVD in Korean adults (14, 15). This study was approved by the Institutional Review Board of Yonsei University College of Medicine, Seoul, Korea. The cur- rent analysis was limited to the 4365 subjects who received abdom- inal ultrasonography. Subjects meeting any of the following criteria were excluded: subjects with any missing covariate information;
subjects with an alcohol intake of 140 g/week or more for men and 70 g/week or more for women; a positive test for hepatitis B anti- gens or hepatitis C antibodies; serum creatinineG123.7mmol/L; a history of cancer, respiratory, renal, hepatobiliary, gout, and other rheumatologic disease. After exclusions, 3768 subjects (2133 men, 1635 women; ages 20–75 years) were included in the final analysis.
Data collection
Self reported cigarette smoking, alcohol consumption, and physical activity were determined using questionnaires. Smoking status was categorized as non-smokers, ex-smokers, and current smokers.
Questions regarding alcohol intake included the type of alcoholic beverage, frequency, and amount of alcohol consumed on a weekly basis. Participants were asked about the type and frequency of phys- ical activity performed weekly. Medical examinations were per- formed by trained medical staff using a standardized procedure.
Body weight and height were measured in subjects wearing light indoor clothing and without shoes to the nearest 0.1 kg and 0.1 cm, respectively. BMI was calculated as the ratio of weight (kg) to height (m2). Following a 12-h overnight fast, blood samples were obtained from the antecubital vein of each subject. High-sensitivity C-reactive protein (hsCRP) concentrations were measured using the Roche/Hitachi 912 System (Roche Diagnostics, Indianapolis, IN, USA) and a latex-enhanced immunoturbidimetric method with a lower limit of detection of 0.02 (mg/L). Fasting plasma glucose (FPG), total cholesterol, triglycerides, high-density lipoprotein (HDL) cholesterol, aspartate aminotransferase (AST), ALT,g-glu- tamyltransferase (GGT), and uric acid were measured by enzymatic methods using the Hitachi 7600-110 automated chemistry analyzer (Hitachi, Tokyo, Japan). The upper laboratory reference limit for uric acid concentrations were 475.8 mmol/L for men and 321.2mmol/L for women. Diabetes was defined as a self-reported history of the disorder or a FPGG7.0 mmol/L. Hypertension was defined as a self-reported history of the disorder, systolic blood pressure (SBP) G140 mm Hg, or diastolic blood pressure (DBP) G90 mm Hg.
Because liver biopsy in apparently healthy subjects is not ethical and the sample size was very large, a diagnosis of fatty liver was based on abdominal ultrasonography with a 3.5-MHz transducer (HDI 5000, Philips, Bothell, USA). Ultrasonography was performed by two experienced radiologists who were unaware of the goals of the study and blinded to laboratory findings. The presence and severity of hepatic steatosis was classified into three groups, grade 1 (mild), grade 2 (moderate), and grade 3 (severe) according to the
hyperechogenicity of liver tissue, difference of echogenicity between the liver and diaphragm, and visibility of vascular struc- tures (16). Liver with any degree of hepatic steatosis was considered fatty in the present study. The modified National Cholesterol Edu- cation Program Adult Treatment Panel III (NCEP-ATP III) was used for the definition of metabolic syndrome. Because waist circumfer- ence was not measured, we defined the diagnosis of obesity as a BMIG25 kg/m2as suggested by the position statement of Amer- ican College of Endocrinology (17). Therefore, metabolic syndrome was defined by the presence of three or more of the following risk factors: 1) obesity with BMIG25.0 kg/m2, 2) high triglycerides G1.70 mmol/L, 3) low HDL cholesterol-1.04 mmol/L for men and-1.30 mmol/L for women, 4) increased SBPG130 mm Hg or increased DBPG85 mm Hg, and 5) and high FPGG6.1 mmol/
L. Subjects who reported taking anti-hypertensive or antidiabetic medication were considered to have increased blood pressure or high FPG, respectively.
Statistical analysis
Because uric acid concentrations differ significantly by gender, uric acid quartiles were categorized separately as follows: Q1:F291.5, Q2: 291.6–333.1, Q3: 333.2–380.7, and Q4:G380.8mmol/L for men; Q1:F202.2, Q2: 202.3–232.0, Q3: 231.1–267.7, and Q4:
G267.8mmol/L for women. The basic characteristics of the study population according to uric acid quartiles were compared using a one way analysis of variance (ANOVA) or Kruskal-Wallis test for continuous variables, andx2-test for categorical variables. The odds ratios (ORs) and 95% confidence intervals (95% CIs) for NAFLD were calculated after adjusting for confounding variables across each quartile of serum uric acid concentration using multivariate logistic regression analysis. All analyses were conducted using SAS statistical software, version 9.1 (SAS Institute Inc., Cary, NC, USA).
All statistical tests were two-sided and a p-0.05 was used for sta- tistical significance.
Results
Table 1 shows the characteristics of the 2133 men and 1635 women. The mean age for men was 46.5"10.2 years and
45.5"11.0 years for women. The mean BMI (kg/m2) was
24.6 for men and 22.8 for women. Mean uric acid concen- trations (mmol/L) were 339.0 for men and 237.9 for women.
39.1% of men and 5.4% of women were current smokers, and the proportion of those with metabolic syndrome was 23.8% for men and 15.4% for women.
The demographic and biochemical characteristics of the study population in relation to serum uric acid concentrations are also shown in Table 2. The mean BMI, SPB and DBP, FPG, total cholesterol, triglycerides, AST, ALT, and GGT were highest in the 4th quartile for uric acid in both men and women, whereas HDL cholesterol concentration was lowest in the 4th quartile. The geometric mean values of hsCRP concentrations were highest in the 4th quartile of uric acid in both men and women. The proportion of hyperten- sion, diabetes, and metabolic syndrome was the highest in the 4th quartile for both genders.
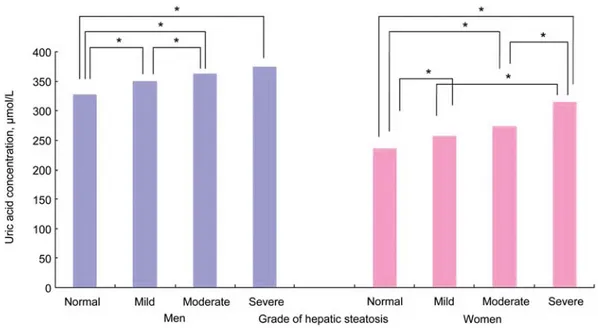
Figure 1 shows the mean values of uric acid according to the grade of hepatic steatosis. Uric acid increased according to the grade of hepatic steatosis: 327.4, 349.5, 362.5, and
Table1Demographicandbiochemicalcharacteristicsofthestudypopulation.a MenWomenp-ValuebUricacidquartilesinmen,mmol/LUricacidquartilesinwomen,mmol/L Q1Q2Q3Q4p-ValuecQ1Q2Q3Q4p-Valuec F291.5291.6–333.1333.2–380.7G380.8F202.2202.3–232.0232.1–267.7G267.8 n21331635561444633495430400385420 Age,years46.5(10.2)45.5(11.0)0.00247.7(10.4)46.5(10.1)45.9(10.1)46.0(10.0)0.00945.2(10.3)44.2(10.0)44.6(11.1)47.8(12.2)-0.001 BMI,kg/m224.6(2.8)22.8(3.0)-0.00124.1(2.7)24.2(2.7)24.8(2.7)25.4(2.8)-0.00122.5(2.7)22.5(2.9)22.4(2.7)23.9(3.4)-0.001 Currentsmokers,%39.15.4-0.00136.539.638.042.80.1894.14.75.47.10.252 Regularexercise,%67.451.4-0.00164.469.369.266.70.26751.252.949.551.70.827 SBP,mmHg127.9(14.7)118.5(16.3)-0.001126.2(14.4)126.0(14.9)128.1(14.3)131.0(14.8)-0.001117.5(16.5)117.5(15.4)116.9(15.4)121.9(16..3)-0.001 DBP,mmHg80.2(9.6)73.2(9.9)-0.00179.1(9.0)78.8(9.9)80.4(9.3)82.3(9.8)-0.00172.3(10.0)72.9(9.9)72.4(9.9)75.1(9.7)-0.001 FPG,mmol/L5.34(1.14)4.95(0.88)-0.0015.52(1.62)5.26(1.04)5.26(0.92)5.33(0.85)-0.0014.95(1.14)4.90(0.75)4.89(0.73)5.06(0.84)0.022 Totalcholesterol,mmol/L4.79(1.14)4.70(0.83)0.0024.70(0.81)4.74(0.80)4.78(0.77)4.93(0.80)-0.0014.52(0.79)4.63(0.76)4.78(0.77)4.93(0.80)-0.001 Triglyceride,mmol/L1.74(1.17)1.16(0.69)-0.0011.46(0.88)1.60(1.18)1.79(1.21)2.06(1.27)-0.0010.99(0.23)1.09(0.57)1.14(0.88)1.41(0.88)-0.001 HDL-cholesterol,mmol/L1.28(0.28)1.51(0.32)-0.0011.34(0.31)1.28(0.27)1.26(0.28)1.24(0.26)-0.0011.55(0.31)1.53(0.31)1.53(0.32)1.44(0.34)-0.001 AST,U/L21(18–26)18(16–21)-0.00120(17–23)20(18–24)21(18–26)23(19–29)-0.00118(13–18)18(15–20)18(15–21)19(17–23)-0.001 ALT,U/L22(16–31)14(11–19)-0.00119(15–25)21(16–28)24(18–34)26(19–38)-0.00113(9–18)14(11–18)15(11–18)16(13–23)-0.001 GGT,U/L31(21–50)14(12–20)-0.00124(18–38)28(20–45)32(23–49)40(27–63)-0.00113(11–18)13(11–18)14(11–18)18(14–26)-0.001 Uricacid,mmol/L339.0(71.4)237.9(53.5)-0.001–––––––––– HsCRP,mg/L0.76(2.49)0.49(2.61)-0.0010.62(2.58)0.72(2.53)0.78(2.42)0.98(2.32)-0.0010.42(2.40)0.40(2.62)0.47(2.38)0.73(2.71)-0.001 Hypertension,%d29.917.6-0.00122.325.133.538.4-0.00116.112.214.727.1-0.001 Diabetes,%e16.611.1-0.00115.614.117.618.50.1419.76.49.119.1-0.001 Metabolicsyndrome,%f23.815.4-0.00115.617.827.337.2-0.0018.810.311.430.2-0.001 Fattyliver,%32.217.4-0.00122.529.736.540.0-0.00112.311.014.331.4-0.001 BMI,bodymassindex;SBP,systolicbloodpressure;DBP,diastolicbloodpressure;FPG,fastingplasmaglucose;HDL,high-densitylipoprotein;AST,aspartateaminotransferase;ALT,alanineamino- transferase;GGT,g-glutamyltransferase;CRP,C-reactiveprotein.aDataareexpressedasthearithmeticorgeometricmean(SD),median(IQR)orpercentage.b,cp-Valuewascalculatedbycomparingmen andwomenusingone-wayANOVAtest,Kruskal-Wallistest,orx2-test.dHypertensionwasdefinedasaSBPG140mmHg,DBPG90mmHgorhistoryofthedisorder.eDiabeteswasdefinedasfasting plasmaglucoselevelG7.0mmol/Lorahistoryofthedisorder.fMetabolicsyndromewasdefinedashavingthreeormoreofthefollowingconditions:BMIG25kg/m2;SBPG130mmHg,DBPG85mm Hg,orahistoryofthedisorder;fastingplasmaglucoseG6.1mmol/Lorahistoryofthedisorder;triglycerideG1.70mmol/L;HDLcholesterol-1.04mmol/Lformen,-1.30mmol/Lforwomen.
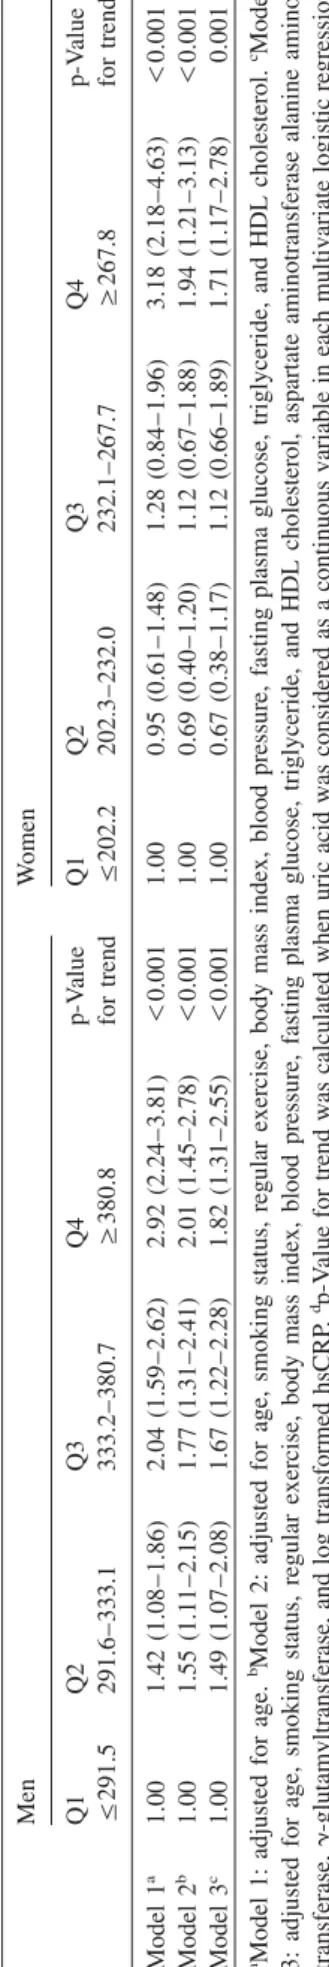
Table2Oddsratiosand95%confidenceintervalsforthepresenceofNAFLDaccordingtouricacidquartilesinmenandwomen.a MenWomen Q1Q2Q3Q4p-ValueQ1Q2Q3Q4p-Value F291.5291.6–333.1333.2–380.7G380.8fortrendF202.2202.3–232.0232.1–267.7G267.8fortrendd Model1a1.001.42(1.08–1.86)2.04(1.59–2.62)2.92(2.24–3.81)-0.0011.000.95(0.61–1.48)1.28(0.84–1.96)3.18(2.18–4.63)-0.001 Model2b1.001.55(1.11–2.15)1.77(1.31–2.41)2.01(1.45–2.78)-0.0011.000.69(0.40–1.20)1.12(0.67–1.88)1.94(1.21–3.13)-0.001 Model3c1.001.49(1.07–2.08)1.67(1.22–2.28)1.82(1.31–2.55)-0.0011.000.67(0.38–1.17)1.12(0.66–1.89)1.71(1.17–2.78)0.001 aModel1:adjustedforage.bModel2:adjustedforage,smokingstatus,regularexercise,bodymassindex,bloodpressure,fastingplasmaglucose,triglyceride,andHDLcholesterol.cModel 3:adjustedforage,smokingstatus,regularexercise,bodymassindex,bloodpressure,fastingplasmaglucose,triglyceride,andHDLcholesterol,aspartateaminotransferasealanineamino- transferase,g-glutamyltransferase,andlogtransformedhsCRP.dp-Valuefortrendwascalculatedwhenuricacidwasconsideredasacontinuousvariableineachmultivariatelogisticregression analysismodel.
375.9 mmol/L in men, and 235.3, 257.8, 274.0, and 314.9mmol/L in women with normal, mild, moderate, severe fatty liver, respectively.
Table 2 shows the risk of NAFLD in terms of uric acid quartiles. After adjustment for age, BMI, cigarette smoking, regular exercise, total cholesterol, triglycerides, and HDL cholesterol, the adjusted OR (95% CI) for the highest vs. the lowest quartile of uric acid was 2.01 (1.45–2.78) in men.
Among women, the prevalence risk of NAFLD was 1.94 (1.21–3.13), after adjustment for the same variables. We also assessed the association between serum uric acid concentra- tion and risk of NAFLD after additional adjustments for liver enzymes and hsCRP concentrations. These associations were similar after using model 3 (Table 2).
Discussion
NAFLD is now recognized worldwide as an important cause of chronic liver disease. The prevalence of NAFLD in this study was 25.8% (32.2% in men and 17.4% in women), which was similar to the data from the general population in Italy (23%) (18), Israel (30%) (19) and Japan (29%) (20).
In multivariate logistic regression analysis, we observed independent associations between serum uric acid concentra- tions and the presence of NAFLD. These associations remained even after adjustment for other surrogate markers of NAFLD, such as AST, ALT, GGT and hsCRP through model 3 (Table 2). These findings indicate that the serum uric acid concentration may be closely related with NAFLD, independent of markers of liver injury and inflammation.
Our results are in agreement with previous studies. Serum uric acid was independently associated with biopsy-proven hepatic steatosis in a study of 1915 Chinese patients aged 12–80 years with chronic hepatitis B infection (21). Li et al.
(22) also reported similar results in a study of 8925 (6802 men) apparently healthy Chinese. However, in that study, gender difference was not fully considered since separate data for both gender using multivariate analysis was not per- formed. As shown in the present study, there is a significant gender difference in the distribution of uric acid. Our study showed that these associations between serum uric acid con- centration and NAFLD can be applied to both men and wom- en through gender-specific multivariate logistic regression analysis.
Some mechanisms could explain the significant relation- ships between serum uric acid and NAFLD. Current under- standing of the progression of NAFLD involves the ‘‘2-hits hypothesis’’ (12). The ‘‘first hit’’ is excessive fat accumu- lation in hepatocytes, which is closely linked to insulin resis- tance. As mentioned previously, NAFLD is now considered a hepatic manifestation of insulin resistance. Numerous stud- ies have introduced significant associations between serum uric acid concentrations and the metabolic syndrome and its components (5, 6), where insulin resistance is the primary problem.
Serum uric acid concentrations were associated signifi- cantly with the degree of hepatic steatosis in our study (Fig- ure 1). These findings are consistent with current knowledge
Figure 1 Mean values of uric acid according to the grade of hepatic steatosis (normal, mild, moderate, and severe fatty liver) in both men and women.
regarding the association between serum uric acid concen- trations and insulin resistance and the metabolic syndrome (23). Thus, the significant association between serum uric acid and NAFLD suggest that insulin resistance is a possible mechanism linking uric acid with NAFLD. Despite the sig- nificant relationship between uric acid and NAFLD in the present study, it cannot be concluded whether serum uric acid concentration is a risk factor actively involved in the devel- opment of NAFLD. It could be a consequence of NAFLD (24, 25). Because this study is of cross-sectional design, causal relationships cannot be determined, warranting pro- spective studies.
The ‘‘second hit’’ is the process from oxidative stress to hepatocyte injury, inflammation and fibrosis. Excessive free fatty acids (FFA) in hepatocytes of patients with NAFLD generate an excess of reactive oxygen species (ROS) leading to lipid peroxidation of hepatocyte, cytokine production, and hepatic inflammation (12).
An experimental study has shown that uric acid stimulates the synthesis of monocyte chemoattractant protein-1, inter- leukin-1 (IL-1), interleukin-6 (IL-6), and tumor necrosis fac- tor-a (TNF-a) (26), all of which are proinflammatory molecules and stimulate production of CRP in the liver (27).
Ruggiero et al. (28) have also shown that uric acid is sig- nificantly and independently associated with inflammatory markers, such as CRP, IL-6, IL-18, and TNF-a in Italian men. The significant associations between uric acid and hsCRP in the present study also support the concept that uric acid may be involved in oxidative stress and systemic inflammation. In this regard, major factors connecting increased serum uric acid concentration with NAFLD may be oxidative stress and chronic low-grade inflammation. Sev- eral prospective studies also have linked uric acid with a potential risk factor for CVD, stroke, and diabetes (3–5), where the underlying mechanisms were closely linked to an
excess of oxidative stress and chronic low-grade inflamma- tion (7–9).
Our study has several limitations. First, because study sub- jects were volunteers visiting for health promotion screening in single hospital and appeared to be slightly healthier indi- viduals compared to community-based cohorts, the study population may not be representative of the general popu- lation in Korea. Therefore, this study may have been affected by selection bias. Second, we did not take into consideration the effect of other potential confounding variables on uric acid concentration, e.g., diet pattern, a history of medications with hyperuricemic activity (diuretics or beta-blockers). The Framingham heart study showed that use of diuretics was a major confounder in the relationship between uric acid con- centrations and mortality risk (29), but we could not consider these effects on abnormal uric acid concentrations. Third, central obesity indicated by waist circumference rather than BMI is more likely to be associated with metabolic syndrome and NAFLD (18). We used BMI instead of waist circumfer- ence as a component of metabolic syndrome and as a con- founding variable in multivariate logistic regression model, not only because waist circumference was not measured at the beginning of this study, but also because BMI has already been shown to be associated with NAFLD in previous stud- ies (19, 20). Finally, although liver biopsy is the gold stan- dard for the diagnosis of fatty liver, biopsy-proven NAFLD was not performed in the present study. However, liver biop- sy is an invasive and impractical procedure in the standard clinical setting. Ultrasonography is a non-invasive and wide- ly available method for qualitative assessment of fatty infil- tration. Thus, ultrasonography is the preferred modality for mass screening for hepatic steatosis and has reasonable sen- sitivity (up to 94%) and specificity (up to 84%) (30).
In summary, increased uric acid concentrations are inde- pendently associated with the presence of NAFLD. Our find-
ings indicate that increased uric acid concentrations may be a useful additional measure in assessing the risk of NAFLD in the clinical setting. Further research is warranted to better understand its pathophysiologic role in the development of NAFLD.
Conflict of interest statement
Authors’ conflict of interest disclosure:The authors stated that there are no conflicts of interest regarding the publication of this article.
Research funding:None declared.
Employment or leadership: None declared.
Honorarium:None declared.
References
1. Harrison R. Structure and function of xanthine oxidoreductase:
where are we now? Free Radic Biol Med 2002;33:774–97.
2. Sautin YY, Johnson RJ. Uric acid: the oxidant-antioxidant par- adox. Nucleosides Nucleotides Nucleic Acids 2008;27:608–19.
3. Bos MJ, Koudstaal PJ, Hofman A, Witteman JC, Breteler MM.
Uric acid is a risk factor for myocardial infarction and stroke:
the Rotterdam study. Stroke 2006;37:1503–7.
4. Dehghan A, van Hoek M, Sijbrands EJ, Hofman A, Witteman JC. High serum uric acid as a novel risk factor for type 2 diabetes. Diabetes Care 2008;31:361–2.
5. Lohsoonthorn V, Dhanamun B, Williams MA. Prevalence of hyperuricemia and its relationship with metabolic syndrome in Thai adults receiving annual health exams. Arch Med Res 2006;37:883–9.
6. Sui X, Church TS, Meriwether RA, Lobelo F, Blair SN. Uric acid and the development of metabolic syndrome in women and men. Metabolism 2008;57:845–52.
7. Ross R. Atherosclerosis-an inflammatory disease. N Engl J Med 1999;340:115–26.
8. Hotamisligil GS. Inflammation and metabolic disorders. Nature 2006;444:860–7.
9. Matteoni CA, Younossi ZM, Gramlich T, Boparai N, Liu YC, McCullough AJ. Non-alcoholic fatty liver disease: a spectrum of clinical and pathological severity. Gastroenterology 1999;
116:1413–9.
10. Adams LA, Lymp JF, St Sauver J, Sanderson SO, Lindor KD, Feldstein A, et al. The natural history of non-alcoholic fatty liver disease: a population-based cohort study. Gastroenterolo- gy 2005;129:113–21.
11. Angulo P. GI epidemiology: non-alcoholic fatty liver disease.
Aliment Pharmacol Ther 2007;25:883–9.
12. Park SH, Kim BI, Yun JW, Kim JW, Park DI, Cho YK, et al.
Insulin resistance and C-reactive protein as independent risk factors for non-alcoholic fatty liver disease in non-obese Asian men. J Gastroenterol Hepatol 2004;19:694–8.
13. Chang Y, Ryu S, Sung E, Jang Y. Higher concentrations of alanine aminotransferase within the reference interval predict non-alcoholic fatty liver disease. Clin Chem 2007;53:686–92.
14. Lee YJ, Kim JK, Lee JH, Lee HR, Kang DR, Shim JY. Asso- ciation of serumg-glutmyltransferase with C-reactive protein
concentrations and white blood cell count in Korean adults.
Clin Chem Lab Med 2008;46:1410–5.
15. Lee YJ, Lee JH, Shin YH, Kim JK, Lee HR, LEE DC. Gender difference and determinants of C-reactive protein level in Kore- an adults. Clin Chem Lab Med 2009;47:863–9.
16. Fallo F, Dalla Pozza A, Sonino N, Federspil G, Ermani M, Baroselli S, et al. Non-alcoholic fatty liver disease, adiponectin and insulin resistance in dipper and non-dipper essential hyper- tensive patients. J Hypertens 2008;26:2191–7.
17. Einhorn D, Reaven GM, Cobin RH, Ford E, Ganda OP, Han- delsman Y, et al. American college of endocrinology position statement on the insulin resistance syndrome. Endocr Pract 2003;9:237–52.
18. Bedogni G, Miglioli L, Masutti F, Tiribelli C, Marchesini G, Bellentani S. Prevalence of and risk factors for non-alcoholic fatty liver disease: the Dionysos nutrition and liver study. Hepa- tology 2005;42:44–52.
19. Zelber-Sagi S, Nitzan-Kaluski D, Halpern Z, Oren R. Preva- lence of primary non-alcoholic fatty liver disease in a popula- tion-based study and its association with biochemical and anthropometric measures. Liver Int 2006;26:856–63.
20. Jimba S, Nakagami T, Takahashi M, Wakamatsu T, Hirota Y, Iwamoto Y, et al. Prevalence of non-alcoholic fatty liver disease and its association with impaired glucose metabolism in Japa- nese adults. Diabet Med 2005;22:1141–5.
21. Shi JP, Fan JG, Wu R, Gao XQ, Zhang L, Wang H, et al.
Prevalence and risk factors of hepatic steatosis and its impact on liver injury in Chinese patients with chronic hepatitis B infection. J Gastroenterol Hepatol 2008;23:1419–25.
22. Li Y, Xu C, Yu C, Yu C, Xu L, Miao M. Association of serum uric acid level with non-alcoholic fatty liver disease: a cross- sectional study. J Hepatol 2009;50:1029–34.
23. Yoo TW, Sung KC, Shin HS, Kim BJ, Kim BS, Kang JH, et al. Relationship between serum uric acid concentration and insuline resistance and metabolic syndrome. Circ J 2005;69:
928–33.
24. Tsouli SG, Liberopoulos EN, Mikhailidis DP, Athyros VG, Eli- saf MS. Elevated serum uric acid level in metabolic syndrome:
an active component or an innocent bystander? Metabolism 2006;55:1293–301.
25. Choi HK, Ford ES. Prevalence of the metabolic syndrome in individuals with hyperuricemia. Am J Med 2007;120:442–7.
26. Kanellis J, Watanabe S, Li JH, Kang DH, Li P, Nakagawa T, et al. Uric acid stimulates monocyte chemoattractant protein-1 production in vascular smooth muscle cells via mitogen-acti- vated protein kinase and cyclooxygenase-2. Hypertension 2003;41:1287–93.
27. Hotamisligil GS, Arner P, Caro JF, Atkinson RL, Spiegelman BM. Increased adipose tissue expression of tumor necrosis fac- tor-alpha in human obesity and insulin resistance. J Clin Invest 1995;95:2409–15.
28. Ruggiero C, Cherubini A, Ble A, Bos AJ, Maggio M, Dixit VD, et al. Uric acid and inflammatory markers. Eur Heart J 2006;27:1174–81.
29. Culleton BF, Larson MG, Kannel WB, Levy D. Serum uric acid and risk for cardiovascular disease and death: the Framingham heart study. Ann Intern Med 1999;131:7–13.
30. Saverymuttu SH, Joseph AE, Maxwell JD. Ultrasound scanning in the detection of hepatic fibrosis and steatosis. Br Med J 1986;292:13–5.