A case-control study on the relationship between HDL2b and non-alcoholic fatty liver disease in Chinese
type 2 diabetic patients
Ya-Hong Ma
1,2,a, Lei Zhao
1,a, Xun-De Xian
3, Dorothy Yang
4, Wei Huang
3, Yu-Hui Wang
3, Odilo Mueller
4, Elaine Chang
4, Yves
Konigshofer
4, Mark Van-Cleve
4, George Liu
3and Jin-Kui Yang
1,*
1
Department of Endocrinology, Beijing Tongren Hospital, Capital Medical University, Beijing, China
2
Beijing Puren Hospital, Beijing, China
3
Institute of Cardiovascular Sciences, Peking University and Key Laboratory of Cardiovascular Sciences, China Administration of Education, Beijing, China
4
Agilent Technologies Inc, Santa Clara, CA, USA
Abstract
Background:
It has been shown that low concentra- tions of high-density lipoprotein cholesterol (HDL-C) are associated with non-alcoholic fatty liver disease (NAFLD) in patients with type 2 diabetes mellitus (T2DM). HDL2b, a major subfraction of high-density lipoprotein (HDL), is more significantly correlated with coronary heart disease (CHD) compared with total HDL. In this study, we analysed HDL2b in a cohort of Chinese T2DM subjects with or without NAFLD.
Methods:
A highly sensitive and reliable microfluidic chip method was adopted to measure HDL2b. In total, 48 T2DM patients with NAFLD diagnosed by a B-ultra- sound were enrolled from our Beijing Community Pre-Diabetes (BCPD) study cohort. A total of 48 age and gender matched diabetic controls without NAFLD were selected from the same population.
Results: Clinical characteristics and serum biochemi-
cal analyses demonstrated a significantly increased body mass index (BMI), waist circumference, home- ostasis model assessment-insulin resistant index (HOMA-IR), total cholesterol (TC), and triglyceride (TG) concentrations in the NAFLD group. However, the concentrations of HDL2b and its ratio to total HDL in NAFLD patients was decreased, compared with controls (p
-0.01). Significantly increased concentra- tions of high sensitive C-reactive protein (hs-CRP) (p
-0.01) were also found. Multifactor logistic regres- sion analysis showed that BMI and TG were the pre- dominant risk factors for fatty liver, while HDL2b was a protective factor.
Ya-Hong Ma and Lei Zhao contributed equally to the article.
a
*Corresponding author: Prof. Jin-Kui Yang, MD, PhD, Department of Endocrinology, Beijing Tongren Hospital, Capital Medical University, Beijing 100730, China Phone:q86-10-58268445, Fax:q86-10-65288736, E-mail: jinkui.yang@gmail.com
Received March 9, 2009; accepted June 21, 2009
Conclusions: T2DM patients with NAFLD have char-
acteristics including obesity, marked insulin resis- tance, high TG, high hs-CRP, low HDL2b and a low HDL2b ratio to total HDL. These factors may increase the incidence of atherosclerosis as well as the risk of CHD.
Clin Chem Lab Med 2009;47:1067–72.
Keywords:
fatty liver; high-density lipoprotein sub- fractions; microfluidic chip; type 2 diabetes.
Introduction
Patients with type 2 diabetes mellitus (T2DM) who have non-alcoholic fatty liver disease (NAFLD) often have an atherogenic lipoprotein profile of high tri- glycerides (TG), and lower high-density lipoprotein cholesterol (HDL-C) (1). T2DM is associated with a marked increase in morbidity and mortality from cor- onary heart disease (CHD) (2). HDL-C is an important factor associated with an increased risk of future ischaemic heart disease (3). There is a significant inverse correlation between the large and low-density subfractions of HDL (HDL2a, HDL2b and HDL3a) and CHD, and a significant positive correlation between the small but high-density subfraction of HDL (HDL3b and HDL3c) and CHD (4, 5). Moreover, it has been shown that HDL2b is a more significant factor correlated with CHD compared with total HDL (6, 7).
Among these alterations in dyslipidaemia, changes in HDL subfractions have not been thoroughly investi- gated due to limitations in the quantitative methods used to measure HDL subfractions. These methods include sequential or gradient ultracentrifugation, gradient gel electrophoresis (8, 9), ion mobility meas- urements, capillary isotachophoresis (10) and high performance liquid chromatography (HPLC) (11).
Some of these methods are labour intensive, expen-
sive and time consuming. Others require expert tech-
nical personnel for proper performance. Although
lipoprotein subfractions can be detected by nuclear
magnetic resonance (NMR), this technology has only
been developed in recent years and has not been
widely applied due to complex calculations and
instrument requirements (12). We analysed HDL2b
and other cardiovascular risk factors in Chinese T2DM
patients with and without NAFLD using a novel micro-
fluidic chip-based technique. This technique is fast,
highly reproducible, easy to operate and has been
successfully used to measure HDL2b in subjects from
the Prospective Cardiovascular Munster (PROCAM)
study (7). Our study revealed the characteristics and
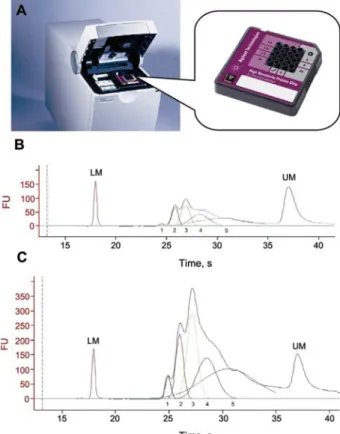
Figure 1 Electrophoretic trace of microfluidic separation.
(A) Agilent 2100 bioanalyzer Agilent and the high sensitivity protein assay chip. (B) Lipid profile of a patient with fatty liver. (C) Lipid profile of a control patient. The electrophoretic trace consists of the lower marker (LM), high-density lipo- protein (HDL) region and upper marker (UM). Both markers are part of the sample dilution buffer and are used for sam- ple alignment. A deconvolution algorithm identifies five indi- vidual peaks in the HDL region. Peak 1 represents the HDL3 component; peak 2 represents HDL3 and HDL2a; peak 3 is HDL2b; peak 4 has somehow fallen to the density range of HDL3; peak 5 is a systematic peak – a baseline of the system across all subfractions.
significance of dyslipidaemia in T2DM patients with NAFLD.
Materials and methods
Study populationThe study subjects were selected from an ongoing large- scale population-based cohort research study, the Beijing Community Pre-Diabetes (BCPD) study. The BCPD study was designed to facilitate the conduct of genetic epidemiology investigations and clinical trials. It was conducted in the community of Nanfaxin, a rural suburb of Beijing. With the approval of the medical Ethical Committee of Beijing Ton- gren Hospital, Capital Medical University, the BCPD study was begun in May 2007. We mailed screening requests to all inhabitants aged from 35 to 74 years (ns9033). We received responses from 3457 and obtained written informed con- sent. Of the 3457 responders, 3294 individuals finished dia- betes screening, 1063 were male (32.3%) and 2231 female (67.7%). A total of 499 T2DM subjects were identified, of whom 285 subjects had previously been diagnosed. The oth- er 214 T2DM subjects were identified using the oral glucose tolerance test.
Study subjects
Of the 499 subjects with T2DM, 131 subjects were identified as having fatty liver. Based on the criteria of inclusion and exclusion, 48 T2DM subjects with NAFLD were randomly selected, and 48 gender and age matched T2DM subjects without NAFLD were chosen for the control group. Criteria for participation included confirmed diagnosis of type 2 dia- betes in accordance with the 1999 World Health Organization (WHO) diagnostic criteria (13), duration-5 years, and a con- firmed diagnosis of fatty liver in accordance with guidelines for the assessment and management of NAFLD in the Asia- Pacific region (14). Fatty liver can be diagnosed by the pres- ence of at least 2 of 3 abnormal findings on abdominal ultrasonography: w1x diffusely increased echogenicity (‘‘bright liver’’), with liver echogenicity greater than the kid- neyw2xblurring of hepatic vesselsw3xdeep attenuation of the ultrasound signal.
Patients were excluded if they had a known history of CHD or hepatic disease, serum TG )4.52 mmol/L (400 mg/dL), treatment with insulin, statins or fibrates, treatment with sulphonylureas, repaglinide, or metformin at submaximal doses (alone or in combination) within the past 6 months, substance abuse, or those whose weekly consumption of more than 40 g of alcohol.
Physical examinations (measurements of waist circumfer- ence, height, weight and blood pressure) were performed by a trained nurse. Body mass index (BMI) was calculated as weight in kilograms divided by the square of the height in meters. Fasting sera and EDTA anticoagulant blood samples were obtained and stored at –808C prior to biochemical anal- ysis. Fasting blood glucose (FBG), total cholesterol (TC), TG, low-density lipoprotein cholesterol (LDL-C), alanine amino- transferase (ALT), creatinine, high sensitive C-reactive pro- tein (hs-CRP), total bilirubin (TBIL), and direct bilirubin (DBIL) were measured at the Beijing Tongren Hospital Laboratory using the Beckman Coulter Unicel DX800 (Beckman Coulter Inc, Fullerton, CA, USA). Plasma insulin was measured with an ELISA kit from Linco (Linco Research, St. Charles, MO, USA). Haemoglobin A1c (HbA1c) was measured using HPLC with the Bio Rad Variant (Bio Rad Laboratories Inc, Califor- nia, USA).
LipoChip analysis
The concentrations of total HDL and HDL2b were measured using two quality control (QC) materials at 0.62 mmol/L and 1.50 mmol/L of HDL-C obtained from Solomon Park Research Institute (Kirkland, WA, USA). All tests were performed using the Agilent 2100 Bioanalyser (Agilent, Waldbronn, Germany) with a newly developed HDL subfraction assay (Figure 1A).
In brief, a linear polymer solution of poly N,N-dimethyl acryl- amide (PDMA; Polysciences, Warrington, PA, USA) is used as the separation matrix. Serum samples, calibrator and QC materials (Solomon Park Research Institute, Kirkland, WA, USA) were diluted 1:50 in the sample buffer (250 mM TAPS, pH 7.5) in the presence of a lipophilic fluorescent dye (DY- 676, Dyomics, Jena, Germany). These were then incubated for 15 min prior to analysis. Buffer wells of the microfluidic chips (Caliper Life Sciences, Hopkinton, MA, USA) were filled with 10 mL of the polymer. The diluted calibrators and QC materials were placed into the appropriate wells on the microfluidic chips, and the patient samples were added to the remaining nine wells. Separation was performed by starting the chip which executed a software script that applied current and voltage in a predefined manner. Fluo- rescent stained lipoproteins were detected with laser- induced fluorescence at 680 nm. Upon completion of the
run, the chip was discarded and the electrodes cleaned with a designated cleaning chip. The entire procedure was per- formed in-1 h.
Statistical analysis
Normal distributed data were expressed as means"stan- dard deviations (SDs). Non-normal distributed values were expressed as medians and quartile rangeswM(QR)x. Non-nor- mal distributed values were logarithmically transformed for parametric statistical analysis. Significant differences in parameters between patients with fatty liver and controls were assessed with Student’s t-test. The risk of developing fatty liver was analysed by single factor logistic regression.
Multivariate analysis was then performed by binary logistic regression using forward stepwise and Wald statistical cri- teria. The statistical analysis was calculated in SPSS 11.5 (SPSS Inc, Chicago, IL, USA). Statistical significance was defined as p-0.05, and all hypotheses were tested using two-sided analysis.
Results
Figure 1A shows the Agilent 2100 Bioanalyser and the high sensitivity HDL subfraction assay chip. Figure 1B, C shows two groups representating the electropho- togram of serum total HDL separated by the size-to- charge ratio with microfluidics gel electrophoresis.
The electrophoretic trace shows the lower marker (LM), HDL region and upper marker (UM), as shown in Figure 1B. Both markers are part of the sample dilu- tion buffer and are used for sample alignment. A deconvolution algorithm identified five individual peaks in the HDL region. Peak 1 represents the HDL3 component; peak 2 represents HDL3 and HDL2a; peak 3 is HDL2b; peak 4 has unexpectedly fallen into the density range of HDL3; peak 5 is a systematic peak representing a baseline of the system across all sub- fractions. It shows that all components of HDL are decreased in patients with T2DM and NAFLD (Figure 1B, C).
Table 1 and Figure 2 show the comparisons of patient demographics and blood testing results between patients with fatty liver and controls.
Comparison of patient demographics demonstrated no statistical differences in age, sex, body height and blood pressure, but significantly increased BMI, waist circumference, hip circumference and waist-to-hip ratio (WHR) (p
-0.05) in patients with T2DM and NAFLD compared with the control group.
Comparison of blood test data showed no statistical differences in FBG, HbA1c, TBIL, DBIL, LDL-C, TC and creatinine, but showed significantly increased con- centrations of fasting insulin, homeostasis model assessment-insulin resistant index (HOMA-IR), ALT, TG and hs-CRP (p
-0.01). There were also decreased concentrations of HDL-C, HDL2b (p
-0.01) and decreased HDL2b to total HDL (p
-0.01) in T2DM patients with NAFLD when compared with the control group.
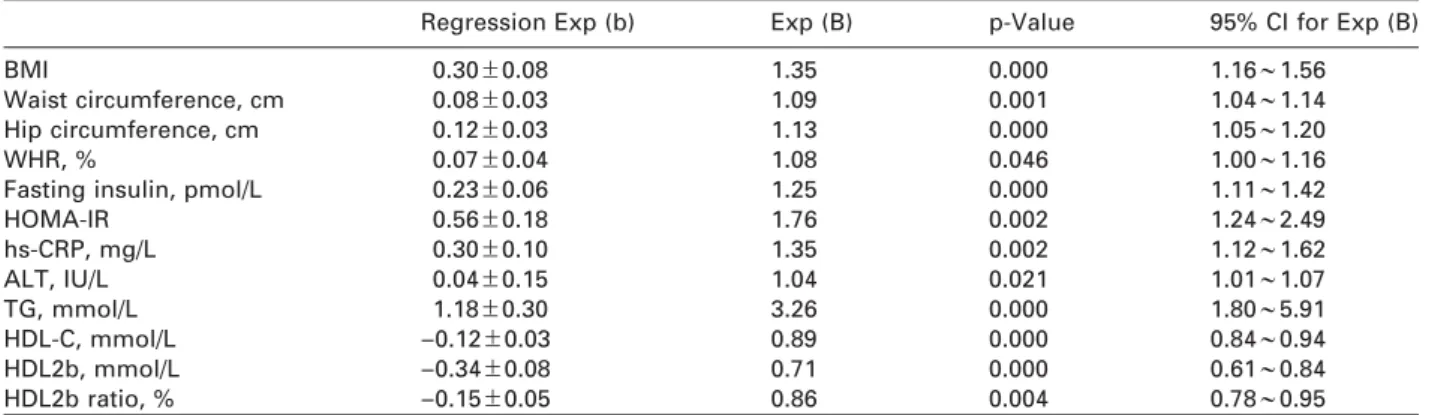
Table 2 shows the logistic regression analysis of the fatty liver group and the control group. Logistic regression analyses demonstrated that BMI, waist cir-
cumference, hip circumference, WHR, fasting insulin, HOMA-IR, ALT, TG and hs-CRP were independent risk factors which may affect T2DM patients with NAFLD.
However, HDL-C, HDL2b and the HDL2b ratio to total HDL were protective factors.
Table 3 shows the multifactor logistic regression analysis of fatty liver patients and the control group.
It shows that BMI and TG were the predominant risk factors, while HDL2b is a protective factor against fat- ty liver.
Discussion
NAFLD is a condition that is becoming increasingly common, and in some cases can progress to end- stage liver disease (15). The prevalence of NAFLD in the general population ranges from 13% to 15% (16), while the prevalence of NAFLD in subjects with T2DM has been reported to range from 21% to 55% (17). The results of this study show that T2DM patients with NAFLD are more likely to have obesity, insulin resis- tance and disorders of lipid metabolism.
HDL-C plays a key role in reverse cholesterol trans- portation. Its functions include antiatherogenic, anti- oxidant, anti-inflammatory, anti-apoptosis and anti-thrombotic effects (18). HDL is comprised of a heterogeneous group of lipoproteins that may be classified by decreasing size as HDL2b, HDL2a, HDL3a, HDL3b, HDL3c (19). These HDL subclasses have different antiatherogenic characteristics, such as their different capacity to promote cholesterol efflux from peripheral tissues (20). HDL2b plays a significant role of protection against atherosclerosis and coro- nary artery disease (21). In humans, HDL subclasses may be influenced by several factors including eth- nicity (22), TG concentrations (23), antidiabetic or lipid regulating drugs (24, 25), blood glucose (26, 27) and CHD (5, 7). In this matched case-control study using a representative sample population with strict inclu- sion criteria to exclude the impact of factors such as FBG and HbA1c, we found significantly decreased HDL2b (p
-0.01) and a decreased HDL2b to total HDL ratio (p
-0.01) in T2DM patients with NAFLD as com- pared with the control group. This difference may result in an increased risk of atherosclerosis and CHD in patients with T2DM and NAFLD. The logistic regres- sion analyses demonstrated that BMI, waist circum- ference, hip circumference, WHR, fasting insulin, HOMA-IR, ALT, TG and hs-CRP were independent risk factors for NAFLD, while HDL-C, HDL2b and the ratio of HDL2b to total HDL were protective factors. Multi- factorial logistic regression analysis showed that BMI and TG are the predominant risk factors, and HDL2b is a protective factor against fatty liver.
C-reactive protein (CRP) is one of the major acute
phase proteins and is a marker of systemic inflam-
mation. In contrast to standard CRP assays, the hs-
CRP assay allows for measurement of low CRP
concentrations seen with even low-grade inflamma-
tion. Recently, increased serum hs-CRP was reported
to be a strong predictor for future cardiovascular
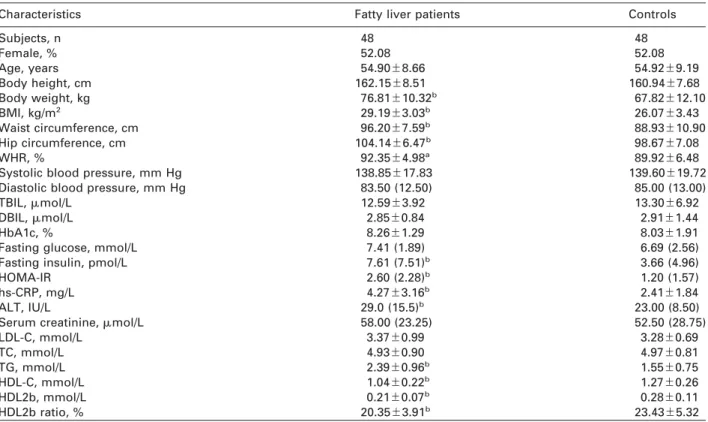
Table 1 Comparisons of patient demographics and results of blood test analysis in patients with fatty liver and controls.
Characteristics Fatty liver patients Controls
Subjects, n 48 48
Female, % 52.08 52.08
Age, years 54.90"8.66 54.92"9.19
Body height, cm 162.15"8.51 160.94"7.68
Body weight, kg 76.81"10.32b 67.82"12.10
BMI, kg/m2 29.19"3.03b 26.07"3.43
Waist circumference, cm 96.20"7.59b 88.93"10.90
Hip circumference, cm 104.14"6.47b 98.67"7.08
WHR, % 92.35"4.98a 89.92"6.48
Systolic blood pressure, mm Hg 138.85"17.83 139.60"19.72
Diastolic blood pressure, mm Hg 83.50 (12.50) 85.00 (13.00)
TBIL,mmol/L 12.59"3.92 13.30"6.92
DBIL,mmol/L 2.85"0.84 2.91"1.44
HbA1c, % 8.26"1.29 8.03"1.91
Fasting glucose, mmol/L 7.41 (1.89) 6.69 (2.56)
Fasting insulin, pmol/L 7.61 (7.51)b 3.66 (4.96)
HOMA-IR 2.60 (2.28)b 1.20 (1.57)
hs-CRP, mg/L 4.27"3.16b 2.41"1.84
ALT, IU/L 29.0 (15.5)b 23.00 (8.50)
Serum creatinine,mmol/L 58.00 (23.25) 52.50 (28.75)
LDL-C, mmol/L 3.37"0.99 3.28"0.69
TC, mmol/L 4.93"0.90 4.97"0.81
TG, mmol/L 2.39"0.96b 1.55"0.75
HDL-C, mmol/L 1.04"0.22b 1.27"0.26
HDL2b, mmol/L 0.21"0.07b 0.28"0.11
HDL2b ratio, % 20.35"3.91b 23.43"5.32
Means"SD, n (%), M(QR),ap-0.05,bp-0.01 compare with controls.
Figure 2 Comparison of HDL2b, HDL2b ratio (%), high sensitive C-reactive protein (hs-CRP) and homesostasis model assess- ment-insulin resistant index (HOMA-IR) between patients with fatty liver and controls.
events. The increased hs-CRP degree is related to the severity of CHD in CHD patients undergoing coronary angiography (28). Multiple prospective studies have demonstrated that hs-CRP is an independent and
good predictor of future cardiovascular events (29,
30). Inflammatory processes play a pivotal role in the
pathogenesis of atherosclerosis and mediate many of
the stages of atheroma development from initial leu-
Table 2 Logistic regression analyses of fatty liver patients and controls.
Regression Exp (b) Exp (B) p-Value 95% CI for Exp (B)
BMI 0.30"0.08 1.35 0.000 1.16;1.56
Waist circumference, cm 0.08"0.03 1.09 0.001 1.04;1.14
Hip circumference, cm 0.12"0.03 1.13 0.000 1.05;1.20
WHR, % 0.07"0.04 1.08 0.046 1.00;1.16
Fasting insulin, pmol/L 0.23"0.06 1.25 0.000 1.11;1.42
HOMA-IR 0.56"0.18 1.76 0.002 1.24;2.49
hs-CRP, mg/L 0.30"0.10 1.35 0.002 1.12;1.62
ALT, IU/L 0.04"0.15 1.04 0.021 1.01;1.07
TG, mmol/L 1.18"0.30 3.26 0.000 1.80;5.91
HDL-C, mmol/L –0.12"0.03 0.89 0.000 0.84;0.94
HDL2b, mmol/L –0.34"0.08 0.71 0.000 0.61;0.84
HDL2b ratio, % –0.15"0.05 0.86 0.004 0.78;0.95
Table 3 The multifactor logistic regression analyses of fatty liver patients and controls.
Regression Exp (b) Exp (B) p-Value 95% CI for Exp (B)
BMI 0.31"0.09 1.37 0.001 1.15;1.63
TG, mmol/L 1.03"0.38 2.79 0.007 1.33;5.85
HDL2b, mmol/L –0.24"0.10 0.79 0.016 0.65;0.96
The multivariate logistic regression with the independent variable (HOMA-IR, ALT, TG, hs-CRP, HDL2b, BMI, waist circumfer- ence and hip circumference) and the dependent variable (fatty liver) were carried out. The probability to enter the model was set at 0.05 and the probability to remove from the model was set at 0.10.
kocyte recruitment to eventual rupture of an unstable atherosclerotic plaque. Pathogen infection may be an important cause of CHD. A variety of inflammatory markers such as interleukin-6 (IL-6), and tumour necrosis factors (TNF) are closely related to the devel- opment of CHD (31). hs-CRP has been regarded as the most powerful marker of inflammation for predicting future cardiovascular disease (32). In this study, hs- CRP concentrations (p
-0.01) in patients with T2DM and NAFLD were significantly increased compared with the control group.
In conclusion, we found that patients with T2DM and NAFLD had characteristics including obesity, hyperinsulinaemia, marked insulin resistance, high TG, high hs-CRP, low HDL2b and a low HDL2b to total HDL ration. These factors may increase the incidence of atherosclerosis as well as the risk of CHD.
Statement
The authors have not accepted any funding or support from an organisation that may in any way gain or lose financially from the results of the study. The authors are not employees of any organisation that may in any way gain or lose finan- cially from the results of the study. We have no other conflict of interest.
Acknowledgements
This work was supported by the National 863 Program of China (Grant 2006AA02A409) and the Capital Medical Devel- opment Foundation of China (No. 2005–2008). Additional thanks to H.M. Metcalfe (BSc) for his assistance in editing this paper for publication.
References
1. Kelley DE, McKolanis TM, Hegazi RA, Kuller LH, Kalhan SC. Fatty liver in type 2 diabetes mellitus: relation to regional adiposity, fatty acids, and insulin resistance. Am J Physiol Endoc M 2003;285:E906–16.
2. Haffner SM, Lehto S, Ronnemaa T, Pyorala K, Laakso M.
Mortality from coronary heart disease in subjects with type 2 diabetes and in nondiabetic subjects with and with- out prior myocardial infarction. N Engl J Med 1998;339:
229–34.
3. Miller GJ, Miller NE. Plasma-high-density-lipoprotein con- centration and development of ischaemic heart-disease.
Lancet 1975;1:16–9.
4. Johansson J, Nilsson-Ehle P, Carlson LA, Hamsten A. The association of lipoprotein and hepatic lipase activities with high density lipoprotein subclass levels in men with myocardial infarction at a young age. Atherosclerosis 1991;86:111–22.
5. Asztalos BF, Cupples LA, Demissie S, Horvath KV, Cox CE, Batista MC, et al. High-density lipoprotein subpop- ulation profile and coronary heart disease prevalence in male participants of the Framingham offspring study.
Arterioscl Throm Vas 2004;24:2181–7.
6. Cromwell WC, Otvos JD. Low-density lipoprotein particle number and risk for cardiovascular disease. Curr Atheros- cler Rep 2004;6:381–7.
7. Mueller O, Chang E, Deng D, Franz T, Jing D, Kincaid R, et al. PROCAM Study: risk prediction for myocardial infarction using microfluidic high-density lipoprotein (HDL) subfractionation is independent of HDL cholesterol.
Clin Chem Lab Med 2008;46:490–8.
8. Camus MC, Chapman MJ, Forgez P, Laplaud PM. Distri- bution and characterization of the serum lipoproteins and apoproteins in the mouse, Mus musculus. J Lipid Res 1983;24:1210–28.
9. Syvanne M, Ahola M, Lahdenpera S, Kahri J, Kuusi T, Vir- tanen KS, et al. High density lipoprotein subfractions in non-insulin-dependent diabetes mellitus and coronary artery disease. J Lipid Res 1995;36:573–82.
10. Schlenck A, Herbeth B, Siest G, Visvikis S. Characteri- zation and quantification of serum lipoprotein subfrac- tions by capillary isotachophoresis: relationships with lipid, apolipoprotein, and lipoprotein levels. J Lipid Res 1999;40:2125–33.
11. Hughes TA, Moore MA, Neame P, Medley MF, Chung BH. Rapid quantitative apolipoprotein analysis by gra- dient ultracentrifugation and reversed-phase high per- formance liquid chromatography. J Lipid Res 1988;29:
363–76.
12. Otvos JD, Jeyarajah EJ, Bennett DW, Krauss RM. Devel- opment of a proton nuclear magnetic resonance spec- troscopic method for determining plasma lipoprotein concentrations and subspecies distributions from a sin- gle, rapid measurement. Clin Chem 1992;38:1632–8.
13. WHO. Definition, diagnosis and classification of diabetes mellitus and its complications. Part 1: diagnosis and classification of diabetes metlitus. Geneva: WHO 1999.
Available at: http://www.staff.ncl.ac.uk/philip.home/who_
dmg.pdf. Accessible in Jan 2007.
14. Farrell GC, Chitturi S, Lau GK, Sollano JD. Guidelines for the assessment and management of non-alcoholic fatty liver disease in the Asia-Pacific region: executive sum- mary. J Gastroenterol Hepatol 2007;22:775–7.
15. Brunt EM. Nonalcoholic steatohepatitis: definition and pathology. Semin Liver Dis 2001;21:3–16.
16. Teli MR, James OF, Burt AD, Bennett MK, Day CP. The natural history of nonalcoholic fatty liver: a follow-up study. Hepatology 1995;22:1714–9.
17. McCullough AJ. Update on nonalcoholic fatty liver dis- ease. J Clin Gastroenterol 2002;34:255–62.
18. Assmann G, Nofer JR. Atheroprotective effects of high- density lipoproteins. Annu Rev Med 2003;54:321–41.
19. Williams PT, Krauss RM, Nichols AV, Vranizan KM, Wood PD. Identifying the predominant peak diameter of high-density and low-density lipoproteins by electropho- resis. J Lipid Res 1990;31:1131–9.
20. Castro GR, Fielding CJ. Early incorporation of cell- derived cholesterol into pre-beta-migrating high-density lipoprotein. Biochemistry 1988;27:25–9.
21. Fagot-Campagna A, Knowler WC, Narayan KM, Hanson RL, Saaddine J, Howard BV. HDL cholesterol subfrac- tions and risk of developing type 2 diabetes among Pima Indians. Diabetes Care 1999;22:271–4.
22. Bhalodkar NC, Blum S, Rana T, Kitchappa R, Bhalodkar AN, Enas EA. Comparison of high-density and low-den-
sity lipoprotein cholesterol subclasses and sizes in Asian Indian women with Caucasian women from the Fra- mingham offspring study. Clin Cardiol 2005;28:247–51.
23. Yang Y, Yan B, Fu M, Xu Y, Tian Y. Relationship between plasma lipid concentrations and HDL subclasses. Clin Chim Acta 2005;354:49–58.
24. Carreon-Torres E, Juarez-Meavepena M, Cardoso-Sal- dana G, Gomez CH, Franco M, Fievet C, et al. Pioglita- zone increases the fractional catabolic and production rates of high-density lipoproteins apo AI in the New Zea- land white rabbit. Atherosclerosis 2005;181:233–40.
25. Guerin M, Le GW, Frisdal E, Schneider S, Milosavljevic D, Bruckert E, et al. Action of ciprofibrate in type IIb hyperlipoproteinemia: modulation of the atherogenic lipoprotein phenotype and stimulation of high-density lipoprotein-mediated cellular cholesterol efflux. J Clin Endocr M 2003;88:3738–46.
26. Garvey WT, Kwon S, Zheng D, Shaughnessy S, Wallace P, Hutto A, et al. Effects of insulin resistance and type 2 diabetes on lipoprotein subclass particle size and con- centration determined by nuclear magnetic resonance.
Diabetes 2003;52:453–62.
27. MacLean PS, Bower JF, Vadlamudi S, Green T, Barakat HA. Lipoprotein subpopulation distributions in lean, obese, and type 2 diabetic women: a comparison of Afri- can and white Americans. Obes Res 2000;8:62–70.
28. Katritsis D, Korovesis S, Giazitzoglou E, Parissis J, Kali- vas P, Webb-Peploe MM, et al. C-Reactive protein con- centrations and angiographic characteristics of coronary lesions. Clin Chem 2001;47:882–6.
29. Torres JL, Ridker PM. Clinical use of high sensitivity C- reactive protein for the prediction of adverse cardiovas- cular events. Curr Opin Cardiol 2003;18:471–8.
30. Zacho J, Tybjaerg-Hansen A, Jensen JS, Grande P, Sil- lesen H, Nordestgaard BG. Genetically elevated C-reac- tive protein and ischemic vascular disease. N Engl J Med 2008;359:1897–908.
31. Li JJ, Fang CH. C-reactive protein is not only an inflam- matory marker but also a direct cause of cardiovascular diseases. Med Hypotheses 2004;62:499–506.
32. Ishikawa T, Imamura T, Hatakeyama K, Date H, Nagoshi T, Kawamoto R, et al. Possible contribution of C-reactive protein within coronary plaque to increasing its own plasma levels across coronary circulation. Am J Cardiol 2004;93:611–4.