Simulated effects of southern hemispheric wind
1
changes on the Pacific oxygen minimum zone
2
Julia Getzlaff1, Heiner Dietze1 and Andreas Oschlies1,2
J. Getzlaff, GEOMAR Helmholtz Centre for Ocean Research Kiel, Germany. (jget- zlaff@geomar.de)
H. Dietze, GEOMAR Helmholtz Centre for Ocean Research Kiel, Germany.
A. Oschlies, GEOMAR Helmholtz Centre for Ocean Research Kiel and Kiel University, Ger- many
1GEOMAR Helmholtz Centre for Ocean Research Kiel, Kiel, Germany.
2Kiel University, Germany.
A coupled ocean biogeochemistry-circulation model is used to investigate
3
the impact of observed past and anticipated future wind changes in the south-
4
ern hemisphere on the oxygen minimum zone in the tropical Pacific. We con-
5
sider the industrial period until the end of the 21st century and distinguish
6
effects due to a strengthening of the westerlies from effects of a southward
7
shift of the westerlies that is accompanied by a poleward expansion of the
8
tropical trade winds. Our model results show that a strengthening of the west-
9
erlies counteracts part of the warming-induced decline in the global marine
10
oxygen inventory. A poleward shift of the trade-westerlies boundary, how-
11
ever, triggers a significant decrease of oxygen in the tropical oxygen mini-
12
mum zone. In a business-as-usual CO2 emission scenario, the poleward shift
13
of the trade-westerlies boundary and warming-induced increase in stratifi-
14
cation contribute equally to the expansion of suboxic waters in the tropical
15
Pacific.
16
1. Introduction
Oxygen is a sensitive indicator for physical and biological changes in the ocean. Its
17
supply can be affected by changes in surface temperature and circulation. The solubil-
18
ity of oxygen decreases as temperature rises, so that warming alone would result in a
19
decline of the global oxygen inventory with time. A decrease in oxygen levels has been
20
observed during the past decades [e.g. Stramma et al., 2012a], in particular in the trop-
21
ical oceans including the oxygen minimum zone (OMZ) of the eastern equatorial Pacific
22
(EEP). Changes in solubility can, however, explain only about a quarter of the observed
23
oxygen decline [Bopp et al., 2002]. The reminder has to be explained by changes in
24
physical transport or biological source-sink processes.
25
Global warming tends to enhance stratification and also affects wind patterns, which
26
both can alter the ventilation of the thermocline, biological production and, eventually,
27
respiration and oxygen consumption. Until now the contributions of the individual pro-
28
cesses to the observed oxygen decline are not well understood. In addition, the presence
29
of decadal atmospheric variability, such as the Pacific Decadal Oscillation [Deutsch et al.,
30
2014], makes it further difficult to detect the attribution of long-term trends. Improving
31
our mechanistic understanding of past and present oxygen variations is a major challenge
32
for making reliable projections of how tropical oxygen levels may evolve in the future.
33
Model simulations allow a straightforward investigation of the individual processes that
34
may lead to changes in marine oxygen fields. Previous simulations that employed clima-
35
tological winds and only applied a CO2 dependent increase in temperature and buoyancy
36
forcing, consistently showed a decrease of the global oxygen inventory with time [Oschlies
37
et al., 2008]. They failed, however, to reproduce the observed patterns of oxygen changes
38
and in particular the observed decrease in the tropical thermocline [Dietze and Loeptien,
39
2013; Oschlies et al., 2008; Stramma et al., 2012a]. Stramma et al. [2012a] showed that
40
simulated oxygen changes in the tropical thermocline are very sensitive to the choice of the
41
applied wind stress forcing. The potential impact of changes in the tropical trade winds
42
has been investigated recently by Ridder et al. [2014], who found a direct correlation
43
between changes in the strength of the trade winds and the spatial extent of the OMZ.
44
This agrees with Duteil et al. [2014] who suggest that the strength of the wind-driven
45
subtropical-tropical cells is closely correlated with thermocline oxygen levels in the EEP.
46
While these studies focussed on impacts of local wind changes on oxygen levels in
47
the tropical thermocline, we here investigate the potential role of remote wind forcing:
48
Observation-based atmospheric reanalysis products indicate a strengthening and a pole-
49
ward shift of the southern westerly winds since the 1970s [Thompson and Solomon, 2002].
50
This is in line with an observed shift of the southern annular mode (SAM) towards a
51
higher index state [Thompson and Solomon, 2002; Marshall, 2003]. Regarding impacts on
52
the ocean, Saenko et al. [2005] show that an increase and poleward shift of the westerlies
53
result in a more intense meridional overturning circulation (MOC) in the southern hemi-
54
sphere. This is accompanied by a poleward expansion of the subtropical gyre circulation
55
and a strengthening of the Antarctic Circumpolar Current (ACC). Roemmich et al. [2007]
56
describe an observed intensification of the South Pacific subtropical gyre and suggest a
57
link to changes in the mid-latitude winds in response to a decadal or longer-term increase
58
in the SAM. The intensification of the Southern Ocean wind stress curl between the 1970s
59
and early 2000s has also been related to the observed strengthening of the southward East
60
Australian Current and of the northward interior transport [Cai, 2006]. Changes in the
61
subtropical gyre circulation may not only affect the western Pacific boundary currents
62
[e.g. Ridgway and Hill, 2009], but also the eastern Pacific boundary currents along with
63
the water mass transport into the OMZ of the EEP.
64
In this study we go beyond wind-induced impacts on ocean physics and evaluate the im-
65
pact of southern hemispheric wind changes on marine oxygen distributions. In particular,
66
we distinguish the effect of wind changes within the zonal band of the westerlies from wind
67
changes in the entire southern hemisphere that also include a poleward expansion of the
68
tropical trade winds. We hypothesize that changes in the strength of the westerlies mainly
69
affect the MOC and consequently the water mass formation rates of southern hemispheric
70
intermediate waters and mode waters. Changes in the meridional extension of the trade
71
winds, on the other hand, are expected to affect the subtropical gyre circulation and, in
72
turn, the ventilation of the subtropical thermocline and the associated oxygen supply to
73
the OMZ.
74
The paper is organized as follows: Section 2 describes the numerical model and the
75
experiments performed. In section 3, we discuss the model results and section 4 provides
76
a summary and conclusions.
77
2. Model
We use the University of Victoria (UVic) Earth System Climate model [Weaver et
78
al., 2001] version 2.9. The model includes a global three-dimensional primitive-equation
79
ocean model [Pacanowski, 1995], a single-level atmospheric energy-moisture balance model
[based on Fanning and Weaver, 1996], a dynamic-thermodynamic sea ice model, a marine
81
ecosystem model [Keller et al., 2012] and a terrestrial vegetation and carbon cycle model.
82
All model components use a horizontal resolution of 1.8◦latitude×3.6◦longitude. The
83
vertical grid of the oceanic component has 19 z-levels with a surface thickness of 50 m
84
increasing to 500 m at depth.
85
The ocean model includes isopycnal mixing and the Gent and McWilliams [1990] pa-
86
rameterization of eddy-induced tracer transport. It is coupled to the atmospheric energy-
87
moisture balance model and to the dynamic-thermodynamic sea ice model. The spin-up
88
time is 11,000 years until equilibrium is reached under preindustrial atmospheric CO2. A
89
detailed description of the model configuration is given in Keller et al. [2012].
90
In all experiments we employ a background isopycnal diffusion coefficient of 1200 m2s−1
91
and additionally use the parameterization of the unresolved equatorial current system as
92
described in Getzlaff and Dietze [2013] where the zonal (anisotropic) isopycnal diffusion
93
coefficient is increased by 50 000 m2s−1 in the equatorial region between 5◦S and 5◦N.
94
This parameterisation improves the global representation of temperature, salinity and
95
oxygen by reducing spurious tracer gradients in the equatorial Pacific. This yields a more
96
realistic representation of tropical oxygen distributions, including the patterns of low oxy-
97
gen environments. The standard model configuration is forced by monthly climatological
98
NCAR/NCEP wind stress fields.
99
In all experiments, we apply anthropogenic CO2 emissions according to the RCP 8.5
100
business-as-usual scenario. For diagnostic purposes, an ideal age tracer and three wa-
101
ter mass tracers were implemented that trace the pathways of Subantarctic mode water
102
(SAMW), Antarctic intermediate water (AAIW) and Antarctic bottom water (AABW)
103
in our model. The three artificial tracers are continuously set to values of 1 in the surface
104
layer between 41.4◦S and 52.2◦S, 52.2◦S and 66.6◦S, and south of 66.6◦S, respectively.
105
Outside their respective release sites the tracers are reset to zero in the surface layer. The
106
meridional bounds are based on pragmatic reasoning and are chosen to ensure that the
107
respective water mass formation regions are comprised throughout the transient simula-
108
tions.
109
In the reference simulation, REF, monthly climatological NCAR/NCEP wind forcing
110
is applied. In the first sensitivity study, WIND, we add a 300-year record of monthly
111
meridional and zonal wind stress anomalies in the southern hemisphere to the monthly
112
climatology. The wind stress anomalies (see Figure 1 a) are the same as used by Spence
113
et al. [2010] and described in greater detail in Fyfe et al. [2007]. These monthly means
114
are derived from 10 different global climate models from the World Climate Research
115
(WCRP) Coupled Model Intercomparison Project (phase 3; CMIP3) and corrected by a
116
small equatorward bias [Fyfe and Saenko, 2006]. Changes in the wind fields include an
117
intensification of the maximum zonal wind stress by about 25% and a southward shift by
118
about 3.5◦ until 2100 [see Spence et al., 2010], as well as a southward shift of the boundary
119
between southern westerlies and trades in the tropics.
120
In order to differentiate between effects resulting from wind stress changes within the
121
meridional extent of the Southern Ocean westerlies and effects that modulate the trop-
122
ical trade winds, we include a second sensitivity experiment, posWIND, where only the
123
positive zonal (directed eastward) wind stress anomalies are added to the climatological
124
forcing. The resulting changes of the wind stress curl in experiment posWIND occur only
125
in the polar and subpolar region south of 40◦S (Figure 1 b, red line).
126
3. Results
In response to anthropogenically induced global warming, the globally integrated marine
127
oxygen inventory of 256.6 Pmol simulated by experiment REF decreases by 4.8% until year
128
2100 (Figure 2a). This overall deoxygenation is damped by 15% in WIND and by 30% in
129
posWIND, such that average oceanic oxygen concentrations at the end of the simulation
130
remain higher in WIND and posWIND than in experiment REF. This can be explained by
131
the wind-driven increase of the MOC in experiments WIND and posWIND and associated
132
increase in the formation rate of oxygen-rich mode and intermediate water masses [Liu
133
and Wu, 2012; Downes et al., 2011] and deep water masses, which all represent important
134
pathways for the ventilation of the global ocean with oxygen.
135
The strengthening of the MOC is brought about by positive wind stress curl anomalies
136
applied in both WIND and posWIND simulations between 40◦ and 60◦S (see Figure
137
1b). This is illustrated in Figure 2b-d by a deepening of the 20 Sv isoline of the zonally
138
integrated overturning stream function from ∼1500m in REF to ∼2500m in WIND and
139
posWIND. Note that the upwelling branch of the MOC is essentially identical in WIND
140
and posWIND because, in our model, the Southern Ocean upwelling is determined by the
141
strength and position of the westerlies.
142
Relative to the reference simulation, the formation rates of SAMW, AAIW and AABW
143
increase by about 40%, 50% and 30%, respectively, in the WIND experiment. For the
144
posWIND experiment, the formation rates increase by 20%, 50% and 70%, respectively.
145
The formation rates of the AAIW are directly linked to changes in the strength of the
146
westerlies, which are the same in WIND and posWIND. The shift of the boundary between
147
westerlies and trades (difference between WIND and posWIND) results in a stronger wind
148
stress curl anomaly between 40◦S and 53◦S in experiment WIND, which in turn yields a
149
larger increase in SAMW formation than in posWIND.
150
The response of AABW formation to the shift of the trades–westerlies boundary in
151
WIND is substantial (40% less than compared to posWIND). In both wind scenarios
152
the upwelling, which feeds both the AABW formation in the south and the mode and
153
intermediate water formation further north, is very similar. The northward transport of
154
surface waters from the polar front to the SAMW formation sites is, however, increased
155
by the wind shift of the trade-westerlies boundary in WIND compared to posWIND. The
156
combination of similar upwelling and increased surface water mass transport to the north
157
results in less southward supply to the AABW formation sites and thus in reduced increase
158
of AABW formation in WIND than in posWIND. The changes in the water mass tracers
159
(Figure 2b-c) illustrate that an increase in deep water formation is more important for
160
the global oxygen inventory than an increase in mode water formation.
161
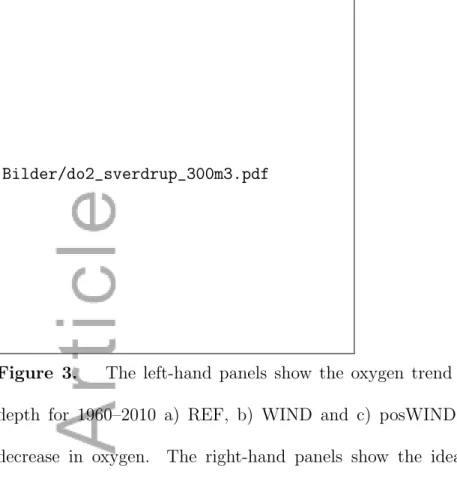
Figure 3a shows the linear oxygen trend for the time period 1960–2010 at 300 m depth
162
for simulation REF. Contrary to the observed decrease in oxygen, but consistent with
163
earlier UVic model simulations [Stramma et al., 2012a], simulation REF yields slightly
164
increasing oxygen concentrations over large areas of the tropical thermocline including
165
the OMZ. Because simulation REF applies climatological wind fields, the changes in the
166
oxygen fields are solely driven by buoyancy changes that derive from anthropogenic-CO2
167
induced temperature and salinity changes.
168
When, in addition to CO2 emissions, changes in southern hemispheric wind fields are
169
applied in experiment WIND, the simulated increase in tropical oxygen concentrations
170
over the 1960–2010 time period becomes significantly smaller (Figure 3b). Applying only
171
the intensification of the southern westerlies in experiment posWIND (Figure 3c), the
172
oxygen trend is close to that of experiment REF. We conclude that the changes in trop-
173
ical ocean oxygen trends in experiment WIND are, at least for the time period 1960 to
174
2010, predominantly caused by the southward shift of the boundary between trades and
175
westerlies rather than by the intensification of the Southern Ocean westerlies.
176
The reduction in tropical thermocline oxygen levels in simulation WIND relative to
177
REF seems, at first sight, contradictory to the previously shown wind-induced increase
178
of the global oxygen inventory. However, the models’ ideal age tracers reveal that it is
179
the strengthening and southward shift of the subtropical gyre circulation that leads to a
180
decrease of the northward transport of newly-ventilated oxygen-rich waters of subantarctic
181
origin along the eastern coast of the South Pacific into the OMZ: Figure 3d shows the ideal
182
age (colored contour) and the circulation (vectors) at 300m depth for REF, with the black
183
contour line denoting the equatorward boundary of the subtropical gyre circulation. A
184
southward shift of this boundary in response to the southern hemispheric wind anomalies
185
applied in WIND leads to a strengthening and a southward shift of the subtropical gyre
186
circulation and an increase in simulated ideal age north of this boundary (Figure 3e).
187
The increase in simulated ideal age north of 20◦N amounts to up to 29 years in 2100
188
(Figure 3d-f). When the applied wind anomalies are restricted to the southern westerlies
189
in experiment posWIND, changes in the subtropical gyre circulation and in ideal age are
190
much reduced compared to those of the WIND simulation (Figure 3f).
191
To complete our analysis, we now investigate possible downstream effects of changes
192
in the formation rates of SAMW on the tropical oxygen minimum zone. In the steady-
193
state simulations of Palter et al. [2010], 30-60% of the water on the 26.8 isopycnal in
194
the EEP between 30◦S and 30◦N originate from SAMW (their Figure 6) and suggest
195
that the associated nutrient transport could be sensitive to climate change. In our model
196
experiments, SAMW also circulates northward from the formation area along the 26.8
197
isopycnal and we find a steady-state average contribution of ∼20% between 30◦S and
198
30◦N, slightly lower than Palter et al. [2010]. In the EEP the 26.8 isopycnal is located
199
at a depth of approximately 280-310 m under pre-industrial conditions. Given that the
200
mean water age, derived from the ideal age tracer, in the suboxic waters of the EEP at
201
300 m depth is 276 years, we suggest that an increase of the Southern Ocean overturning
202
circulation does not have a large impact on the OMZ dynamics on time scales of 50
203
years (which is currently the time span covered by observations used to estimate oxygen
204
trends). Indeed, after 50 years only 5% of the newly formed SAMW reach the EEP in
205
our experiment. Since there is no significant difference in the depth of the 26.8 isopycnal
206
in the EEP between experiments REF and posWIND we conclude that planetary wave
207
processes forced remotely by a perturbation in the Southern Ocean can, to first order, be
208
neglected in the analysis of southern hemispheric wind impacts on the tropical OMZ.
209
The sensitivity to southern hemispheric wind anomalies is even larger for simulated
210
suboxic volume changes until the end of the 21st century. Figure 4 shows the suboxic
211
volume of the Pacific Ocean, here defined as water with oxygen concentrations smaller
212
than 10 mmol m−3. In REF, we find an increase of the suboxic volume of∼36% until 2100.
213
Note that the suboxic volume expands already during 1960–2010, when all simulations still
214
show some local oxygen increase in the tropical thermocline (Figure 3a-c). Applying the
215
full southern-hemispheric wind anomalies in WIND results in an increase of the suboxic
216
volume twice as large as in REF (total increase of ∼72%), whereas a mere change of the
217
southern westerlies (posWIND) has negligible effect on suboxic volume changes compared
218
to experiment REF. This indicates that observed and expected 21st century changes in
219
the meridional extension of the tropical trade winds are as important for suboxic volume
220
changes as CO2-induced atmospheric heat flux changes of a business-as-usual emission
221
scenario.
222
4. Summary and Conclusion
In our study we investigate the impact of changes in the southern hemispheric wind
223
fields on global oxygen as well as on the extension of the tropical OMZ relative to changes
224
forced by CO2-induced atmospheric buoyancy flux changes only. The changes in the
225
southern hemispheric wind fields, which are in line with an observed shift of the SAM,
226
are a combination of a strengthening and poleward shift of the southern westerlies and a
227
poleward shift of the boundary between southern westerlies and tropical trade winds.
228
Our results confirm that the Southern Ocean plays an important role for the global
229
ocean oxygen supply. We show that a strengthening of the southern westerlies, that leads
230
to an increase of the water formation rates of the oxygen-rich deep and intermediate water
231
masses, can counteract part of the warming-induced decline in marine oxygen levels. The
232
wind-driven intensification of the Southern Ocean meridional overturning circulation in
233
both wind experiments leads to an increase in the global oxygen supply (Figure 2a). These
234
results indicate that changes in the formation of deep water are crucial for changes in the
235
global oxygen inventory. While the strength of the westerlies is identical in simulations
236
WIND and posWIND, the southward shift of the boundary between westerlies and trades
237
in WIND results in a larger increase of SAMW production and a smaller increase of deep
238
water formation and associated oceanic oxygen supply.
239
The southward shift of the boundary between westerlies and trade winds leads to an
240
intensification and a southward shift of the subtropical gyre circulation. Associated with
241
this is a decrease in northward water mass transport along the eastern margin into the
242
shadow zones of the subtropical gyre and thus into the OMZ. Our model simulations reveal
243
that changes in the meridional expansion of the tropical trade winds have a significant
244
impact on the evolution of the suboxic volume in the tropical OMZ during the 21st century:
245
The increase in suboxic volume in experiment WIND (72%) is twice as large as in the
246
buoyancy-only driven experiment REF (36%), whereas a mere change of the southern
247
westerlies, as in posWIND, does not alter the suboxic volume significantly with respect
248
to experiment REF.
249
Although the total change applied to the model’s trade winds is small compared to the
250
climatological wind forcing, the impact on the 21st century OMZ dynamics is as large
251
as the impact of buoyancy driven changes forced by CO2-induced atmospheric heat flux
252
changes alone. Our study thus illustrates the importance of realistic wind forcing for
253
adequate modeling of thermocline biogeochemical tracer distributions. Changes in the
254
meridional extension of the trade winds can also be driven by other processes, such as
255
changes in the Pacific Decadel Oscillation, ENSO or by local weather changes, which
256
are not necessarily restricted to the southern hemisphere and will have to be included in
257
future research.
258
Acknowledgments. The model data used to generate the figures will be available at
259
http ://thredds.geomar.de/thredds/catalog−open−access.html.
260
This study was financially supported by BIOACID II and SFB754. We thank C.J. Somes
261
for proof-reading and three anonymous reviewers for their very constructive comments.
262
References
Bopp, L., Le Qu´er´e, C., Heimann, M., Manning, and P. Monfray (2002), Climate-induced
263
oceanic oxygen fluxes: Implications for the contemporary carbon budget. Global Bio-
264
geochemical Cycles, 16, 2, 1022, doi:10.1029/2001GB001445.
265
Cai, W. (2006), Antarctic ozone depletion causes an intensification of the South-
266
ern Ocean super-gyre circulation, Geophysical Research Letters, Vol. 33, L03712,
267
doi:10.1029/2005GL024911
268
Deutsch, C., Berelson, W., Thunell, R., Weber, T., Tems, C., McManus, J., Crusius,
269
J., Ito, T., Baumgartner, T., Ferreira, V., Mey, J., van Geen, A. (2014), Centennial
270
changes in North Pacific anoxia linked to tropical trade winds, Science, 345 (665),
271
doi:10.1126/science.1252332
272
Dietze, H., Loeptien, U., 2013. Revisiting ”Nutrient Trapping” in global biogeochemical
273
Ocean Circulation Models, Global Biogeochem. Cy., 1-20, doi:10.1002/gbc.20029.
274
Downes, S. M., A. S. Budnick, J. L. Sarmiento, and R. Farneti (2011), Impacts of wind
275
stress on the Antarctic Circumpolar Current fronts and associated subduction, Geophys.
276
Res. Lett., 38, L11605, doi:10.1029/2011GL047668.
277
Duteil, O., C. W. B¨oning, and A. Oschlies (2014), Variability in subtropical-tropical cells
278
drives oxygen levels in the tropical Pacic Ocean, Geophys. Res. Lett., 41,89268934,
279
doi:10.1002/2014GL061774.
280
Fanning, A.G., Weaver, A.J. (1996), An atmospheric energy-moisture model: Climatology,
281
interpentadal climate change and coupling to an ocean general circulation model. J.
282
Geophys. Res. 101: 15111 – 15128.
283
Fyfe, J.C., Saenko, O.A. , Zickfeld, K., Eby, M., Weaver, A.J. (2007), The Role
284
of Poleward-Intensifying Winds on Southern Ocean J. Climate, 20, 53915400. doi:
285
http://dx.doi.org/10.1175/2007JCLI1764.1
286
Fyfe, J.C., Saenko, O.A. (2006), Simulated changes in extratropical Southern Hemisphere
287
winds and currents. Geophys. Res. Lett., 33, L06701, doi:10.1029/2005GL025332
288
Gent, P.R., McWilliams, J. (1990), Isopycnal mixing in ocean circulation models. J. Phys.
289
Oceanogr. 20, 150 – 155.
290
Getzlaff, J., Dietze, H. (2013) Effects of increased isopycnal diffusivity mimicking the
291
unresolved equatorial intermediate current system in an earth system climate model,
292
Geophysical Research Letters, 40 (10). pp. 2166-2170. DOI 10.1002/grl.50419
293
Keller, D. P., Oschlies, A., and Eby, M. (2012): A new marine ecosystem model for the
294
University of Victoria Earth System Climate Model, Geosci. Model Dev., 5, 1195-1220,
295
doi:10.5194/gmd-5-1195-2012.
296
Liu, C., and L. Wu (2012), An intensification trend of South Pacific Mode Wa-
297
ter subduction rates over the 20th century, J. Geophys. Res., 117, C07009,
298
doi:10.1029/2011JC007755.
299
Marshall, J., Speer, K. (2012) Closure of the meridional overturning circulation
300
through Southern Ocean upwelling Nature Geoschience, 5. pp. 171–180. DOI:
301
10.1038/NGEO1391
302
Marshall, G. J., 2003: Trends in the Southern Annular Mode from observations and
303
reanalyses. J. Climate, 16, 4134-4143.
304
Oschlies, A., K. G. Schulz, U. Riebesell, and A. Schmittner (2008), Simulated 21st centurys
305
increase in oceanic suboxia by CO2-enhanced biotic carbon export, Global Biogeochem.
306
Cycles, 22, GB4008, doi:10.1029/2007GB003147.
307
Pacanowski, R. C., 1995. MOM 2 Documentation, User’s Guide and Reference Manual.
308
Tech. Rep. 3, GFDL Ocean Group.
309
Palter. J.B., Sarmiento, J.L., Gnanadesikan, A., Simeon, J., Slater, R.D. (2010), Fuel-
310
ing export production: nutrient return pathways from the deep ocean and their de-
311
pendence on the Meridional Overturning Circulation, Biogeoscience, 7, pp. 3549–3568.
312
DOI: 10.5194/bg-7-3549-2010
313
Ridder, N. and England, M.H. (2014), Sensitivity of ocean oxygenation to variations
314
in tropical zonal wind stress magnitude, Global Biogeochem. Cycles, 28, 909926,
315
doi:10.1002/2013GB004708.
316
Ridgway, K. and Hill, K.. 2009. Chapter 5: The East Australian Current. In: Marine
317
Climate Change in Australia 2009: Impacts and Adaptation Responses. pp. 52-64.
318
NCCARF, Queensland. ISBN 978-1-921609-03-9
319
Roemmich, D., Gilson, J., Davis, R., Sutton, P., Wijffels, S., Riser, S. (2007), Decadal
320
Spinup of the South Pacific Subtropical Gyre. J. Phys. Oceanogr., 37, 162173. doi:
321
http://dx.doi.org/10.1175/JPO3004.1
322
Saenko, O. A., Fyfe, J.C., England, M.H. (2005), On the response of the oceanic wind-
323
drive circulation to atmospheric CO2 increase, Climate Dynamics, 25, pp. 415–426.
324
DOI: 10.1007/s00382-005-0032-5
325
Spence, P., Fyfe, J. C., Montenegro, A., Weaver, A. J. (2010), Southern Ocean Response to
326
Strengthening Winds in an Eddy-Permitting Global Climate Model, Journal of Climate,
327
23, pp. 5332–5343
328
Stramma L., Oschlies, A., Schmidtko, S. (2012a), Mismatch between observed and mod-
329
eled trends in dissolved upper-ocean oxygen over the last 50 yr, Biogeosciences, 9, 4045
330
– 4057, DOI: 10.5194/bg-9-4045-2012
331
Thompson, D.W.J. and Solomon, S. (2002), Interpretation of Recent Southern Hemisphere
332
Climate Change, Science 296, 895 (2002);DOI: 10.1126/science.1069270
333
Weaver, A.J., Eby, M., Wiebe, E. C., et al. (2001), The UVic earth system climate model:
334
Model description, climatology, and applications to past, present and future climates,
335
Atmos. Ocean, 39, 361 – 428.
336
Bilder/windananom_all.pdf
Figure 1. a) Zonal average of monthly zonal wind stress anomalies in Pa applied in the model simulations. b) Zonal average of the annual mean wind stress curl anomaly for experiments WIND (blue) and posWIND (red) in year 2100.
Figure 2. a) Global oxygen inventory in Pmol. The bottom panels show the simulated Eulerian Southern Ocean meridional overturning in Sv in year 2100 (contour): b) REF, c) WIND and d) posWIND. In b) the colored background shows the distribution of the sum of the zonally averaged idealized SAMW and AABW tracers in % in REF for year 2100, c-d) show the differences in % for WIND-REF and posWIND-REF, respectively, for the sum of the zonally averaged idealized SAMW and AABW tracers.
Bilder/do2_sverdrup_300m3.pdf
Figure 3. The left-hand panels show the oxygen trend (mmol m−3year−1) at 300 m depth for 1960–2010 a) REF, b) WIND and c) posWIND. Negative trends indicate a decrease in oxygen. The right-hand panels show the ideal age in years and velocity vectors at 300 m depth in year 2100 for d) REF, e) difference WIND-REF and f) difference posWIND-REF. Positive values in b) and c) indicate a larger ideal age. The black contour line is the same in all three panels and shows the equatorward boundary of the subtropical gyre in REF, here defined as the location with zero zonal velocity.
Figure 4. Simulated suboxic volume [m3] of the Pacific Ocean, defined as water hosting O2 <10 mmol m−3, as a function of time.
50°
40°
30°
20°
10°
b) 0
a)
−3000
−2000
−1000
D ep th [m ]
−5 0 5 10
30 15
20
−3000 10
−2000
−1000
D ep th [m ]
−5 0 5 10
30 15
20 10
−80 −60 −40
−5000
−4000
−3000
−2000
−1000
Latitude
D ep th [m ]
0 20 40 60 80
30 20
10
1850 1900 1950 2000 2050
244 246 248 250 252 254 256
Oxygen[Pmol]
time [years]
REF WIND posWIND
b)
c)
120E 150 180 150 120 90 60W 60S
30 0 30N
−0.2
−0.1 0 0.1 0.2
120E 150 180 150 120 90 60W 60S
30 0 30N
−0.2
−0.1 0 0.1 0.2
30N
0.1 0.2
20N 20
30
180W 160 140 120 100 80W
20S 0 20N
−30
−20
−10 0 10 20
e)
30180W 160 140 120 100 80W
20S 0 20N
50 100 150 200 250 300