Supplement of Earth Syst. Dynam., 10, 847–858, 2019 https://doi.org/10.5194/esd-10-847-2019-supplement
© Author(s) 2019. This work is distributed under the Creative Commons Attribution 4.0 License.
Supplement of
Analysis of the position and strength of westerlies and trades with implications for Agulhas leakage and South Benguela upwelling
Nele Tim et al.
Correspondence to:Nele Tim (nele.tim@hzg.de)
The copyright of individual parts of the supplement might differ from the CC BY 4.0 License.
Supplementary:
Figure S1: Temporal evolution of zonal mean (40 W-100 E) zonal wind stress [N/m2] (shaded co- lor) and the meridional position of maximum of westerlies (light pink curve) and of wind stress curl (blue curve). The linear trends in their positions are also displayed. In December--February derived from NCEP1 (a), ECHAM6XR (b), JRA-55 (c) , and ERA20C (d).
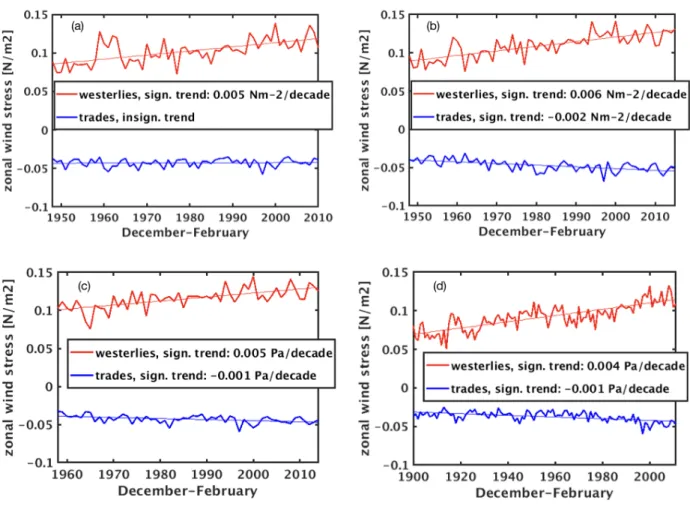
Figure S2: Temporal evolution of the intensity of wind stress of westerlies (mean between 60 S and of the latitude where wind stress turns eastward) and trades (mean between latitude where wind stress turns eastward and 15 S) and their corresponding linear trends. In December--Febru- ary derived from NCEP1 (a), ECHAM6XR (b), JRA-55 (c) , and ERA20C (d).
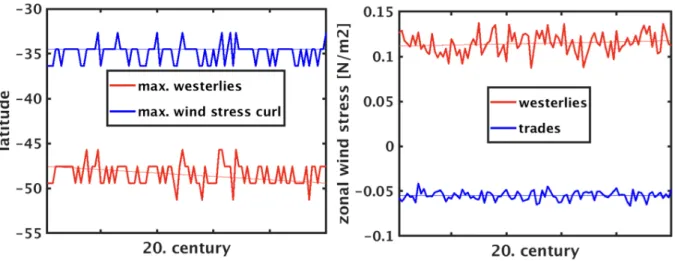
Figure S3: Temporal evolution of maximum of westerlies and of wind stress curl (left figures).
Temporal evolution of the intensity of wind stress of westerlies (mean between 60 S and of the latitude where wind stress turns eastward) and trades (mean between latitude where wind stress turns eastward and 15 S) and their corresponding linear trends (right figures). The linear trends in their positions are also displayed. In December--February derived from the ECHAM2k data set.
![Figure S1: Temporal evolution of zonal mean (40 W-100 E) zonal wind stress [N/m2] (shaded co- co-lor) and the meridional position of maximum of westerlies (light pink curve) and of wind stress curl (blue curve)](https://thumb-eu.123doks.com/thumbv2/1library_info/5321058.1679769/2.892.103.790.158.611/figure-temporal-evolution-stress-meridional-position-maximum-westerlies.webp)