https://doi.org/10.5194/esd-10-847-2019
© Author(s) 2019. This work is distributed under the Creative Commons Attribution 4.0 License.
Analysis of the position and strength of westerlies and trades with implications for Agulhas leakage and
South Benguela upwelling
Nele Tim1,2, Eduardo Zorita1, Kay-Christian Emeis2, Franziska U. Schwarzkopf3, Arne Biastoch3,4, and Birgit Hünicke1
1Helmholtz-Zentrum Geesthacht, Institute of Coastal Research, Geesthacht, Germany
2University of Hamburg, Institute for Geology, Hamburg, Germany
3GEOMAR Helmholtz Centre for Ocean Research Kiel, Kiel, Germany
4Kiel University, Christian-Albrechts-Platz 4, 24118 Kiel, Germany Correspondence:Nele Tim (nele.tim@hzg.de)
Received: 17 April 2019 – Discussion started: 18 April 2019
Revised: 21 October 2019 – Accepted: 4 November 2019 – Published: 5 December 2019
Abstract. The westerlies and trade winds over the South Atlantic and Indian Ocean are important drivers of the regional oceanography around southern Africa, including features such as the Agulhas Current, the Agulhas leakage, and the Benguela upwelling. Agulhas leakage constitutes a fraction of warm and saline water transport from the Indian Ocean into the South Atlantic. The leakage is stronger during intensified westerlies. Here, we analyze the wind stress of different observational and modeled atmospheric data sets (covering the last 2 millen- nia, the recent decades, and the 21st century) with regard to the intensity and position of the southeasterly trades and the westerlies. The analysis reveals that variations of both wind systems go hand in hand and that a poleward shift of the westerlies and trades and an intensification of westerlies took place during the recent decades. Fur- thermore, upwelling in South Benguela is slightly intensified when trades are shifted poleward. Projections for strength and position of the westerlies in the 21st century depend on assumed CO2emissions and on their effect relative to the ozone forcing. In the strongest emission scenario (RCP8.5) the simulations show a further south- ward displacement, whereas in the weakest emission scenario (RCP2.6) a northward shift is modeled, possibly due to the effect of ozone recovery dominating the effect of anthropogenic greenhouse forcing. We conclude that the Agulhas leakage has intensified during the last decades and is projected to increase if greenhouse gas emissions are not reduced. This will have a small impact on Benguela upwelling strength and may also have con- sequences for water mass characteristics in the upwelling region. An increased contribution of Agulhas water to the upwelling water masses will import more preformed nutrients and oxygen into the upwelling region.
1 Introduction
The regional oceanographic phenomena around southern Africa, the Agulhas Current, the Agulhas leakage, and the Benguela upwelling, are all three to a large extent influenced by one of the two wind regimes in this region, the Southern Hemisphere westerlies and the easterly trade winds. In this study we analyze several observational data sets and model simulations to understand the variability and trends in the in- tensity and spatial distribution of westerly and trade winds in
the South Atlantic–Indian Ocean over the past few decades, the last century, and past 2 millennia. We also compare ob- served trends with trends projected in future climate simula- tions driven, among others, by changing greenhouse gas and ozone concentrations.
The Benguela upwelling system is located off the south- west coast of Africa (Blanke et al., 2005). This coastal up- welling system is one of the four eastern boundary upwelling systems of the world (California, Humboldt, Canary, and Benguela) (Shannon, 1985). These upwelling systems, which
are major areas of ocean primary production, are driven by the trade wind system of the subtropics and tropics. The equatorward wind forces surface water along the coast to move offshore. Cold and nutrient-rich water wells up into the sunlit layer near the coast due to mass balance (Bakun et al., 2010). Therefore, these regions have characteristic sea sur- face temperature (SST) patterns and are exceptionally pro- ductive ecosystems.
The Benguela upwelling system is divided into two dis- tinct subsystems, north and south, separated by the Lüderitz upwelling cell at 27◦S (Hutchings et al., 2009). Upwelling in South Benguela varies seasonally, with the strongest up- welling in austral summer (December–February) (Tim et al., 2015), when the South Atlantic subtropical high has moved southward to induce trade winds parallel to the coast. Up- welling feed water in the South Benguela upwelling region is the Eastern South Atlantic Central Water (ESACW) that mixes in the Cape Basin with Indian Ocean water imported by the Agulhas leakage (Mohrholz et al., 2008; Garzoli and Gordon, 1996). The strength of Agulhas leakage dynamically influences the South Benguela upwelling: larger portions of warm saline Indian Ocean water may cause enhanced strat- ification and weaken the upwelling. In addition, in terms of nutrient and CO2budgets, water entering through the Agul- has leakage significantly contributes preformed nutrients that contemporaneously render South Benguela a sink for atmo- spheric CO2(Emeis et al., 2018). Concerning the centennial variability of upwelling over the period 1600–1900, Granger et al. (2018) reasoned from their analysis of grain size and SST changes derived from marine sediment records that the inflow of Agulhas water into the South Benguela upwelling system is stronger when westerlies are located further to the south and SSTs are cooler during northernmost positions of the westerlies.
Just south of the upwelling region, Indian Ocean wa- ters enter the South Atlantic as Agulhas leakage, mainly transported by so-called Agulhas rings. These eddies are shed when the Agulhas Current, the western boundary cur- rent of the southern Indian Ocean (Beal and Bryden, 1997), retroflects into the Indian Ocean at the southern tip of Africa.
The resulting interoceanic connection is an important fea- ture of the global meridional overturning circulation (Gor- don, 1986).
The Agulhas leakage has undergone changes in conjunc- tion with changes in the global climate. During glacial pe- riods the leakage was strongly diminished based on qual- itative reconstructions of foraminiferal assemblage counts, whereas the transport of Indian Ocean waters into the South Atlantic was enhanced during interglacial periods (Peeters et al., 2004). On shorter and more recent timescales, the leak- age has been found to increase in ocean simulations over the second half of the 20th century driven by observed atmo- spheric forcing (Schwarzkopf et al., 2019; Biastoch et al., 2009). This intensification of the leakage can be attributed to an intensification of the Southern Hemisphere winds (Dur-
gadoo et al., 2013). The impact of the position of the west- erlies on the Agulhas leakage is still under debate. The stud- ies of Ruijter (1982) and Biastoch et al. (2009) found that a more northerly position hinders the westward flow of Agul- has water into the South Atlantic, whereas a more southerly position leads to a wider passage of throughflow between the southern coast of South Africa and the westerlies. However, recent studies found diverging results. De Boer et al. (2013) showed that there is no linkage between the position of the zero wind stress curl and the subtropical front. The study by Durgadoo et al. (2013) found that an enhanced leakage tends to occur when westerlies are shifted equatorwards due to the redistribution of momentum input by the winds.
Nevertheless, there is consensus on the impact of the west- erlies on the Agulhas leakage, with the strength of wester- lies being the key driver of the leakage: stronger westerlies lead to a stronger wind stress curl and an intensified transport from the Indian Ocean into the South Atlantic (Cheng et al., 2018; Durgadoo et al., 2013).
Given the importance of variations in the position and strength of the wind systems in this region (westerlies and trade winds as well as wind stress curl), one goal of our study is to understand the consequences of changes in the wind system for the South Benguela upwelling system. The direct impact of changes in the trades has been analyzed in a previous study (Tim et al., 2016, 2015). Here, we are in- terested in the indirect impacts on the South Benguela up- welling via changes in the westerlies, which in turn im- pact the Agulhas leakage and thus the water masses in the Benguela upwelling region. Therefore, we search for a con- nection between the position and strength of the wind sys- tems that may explain synchronous variability and common trends in the Agulhas Current, leakage, and Benguela up- welling. We then examine future trends in the wind system as simulated in future climate simulations to reveal common trends in these three oceanic current systems. The analysis encompasses correlations of the position and strength of the westerlies and trades, their trends, and the connection to the South Benguela upwelling. One drawback of the presently available climate simulations for this analysis, in particular for the past 2000 years and the 21st century, is their relatively coarse spatial resolution. A realistic representation of the im- pact of wind stress on the oceanic circulation systems in this region may require models with finer spatial resolution. Ac- knowledging this unavoidable limitation, given the present generation of global climate models, this type of analysis may still be valuable to understand the variability of the wind systems in this region and its possible drivers, guiding future studies based on more realistic models. Our present study can be considered part of the ongoing comprehensive anal- ysis using state-of-the-art climate models (e.g., Small et al., 2015; Wang et al., 2014).
2 Data and methods
For the analysis of the wind stress we use several different atmospheric data sets, all gridded and derived from simu- lations with atmospheric models, some of them with data assimilation. To investigate variations in the last 6 decades we use the NCEP/NCAR reanalysis 1 (National Centers for Environmental Prediction/National Center for Atmo- spheric Research Reanalysis version 1, hereafter NCEP1) (Kalnay et al., 1996), COREv2 (the version 2 forcing for Coordinated Ocean-ice Reference Experiments) (Large and Yeager, 2009), JRA-55 (the Japanese 55-year Reanalysis) (Kobayashi et al., 2015), and ECHAM6XR (the atmospheric general circulation model of the Max Planck Institute for Meteorology with extra-high resolution) (Schubert-Frisius et al., 2016). NCEP1 is analyzed here over the period Jan- uary 1948–August 2012 and has a horizontal resolution of T62 (200 km). The data set COREv2 covers the period Jan- uary 1958–December 2009 with the same horizontal reso- lution. The atmospheric state is given by NCEP1, whereas radiative fields, precipitation, sea ice, and SST are derived from other sources. The Japanese reanalysis data set JRA- 55, analyzed for the period January 1958–December 2013, has a resolution of T319 (about 55 km). The global data set ECHAM6XR covers the period January 1948–April 2015. It is the result of an atmosphere-only simulation with the spec- tral model ECHAM6. This model was nudged towards the NCEP1 reanalysis at spatial scales larger than about 1000 km (spectral nudging; von Storch et al., 2000), whereas shorter spatial scales are allowed to evolve freely. Its spatial resolu- tion is much finer than the NCEP1 reanalysis (T255, about 50 km).
In addition to the reanalysis data sets that cover approx- imately the last 60 years (∼1950–2010), we include the ERA20C reanalysis data set (European Centre for Medium- Range Weather Forecasts reanalysis for the 20th century) (Poli et al., 2016) to cover a longer time period from the last century (January 1900–December 2010) with a spatial reso- lution of T159 (125 km).
We additionally analyze two simulations with the Max Planck Institute Earth System Model (MPI-ESM-MR) (Gior- getta et al., 2013) for the historical period (1850–2005). The two simulations only differ in their initial conditions. We analyze three future scenarios (MPI-ESM-LR) with differ- ent strengths in greenhouse gas forcing: Representative Con- centration Pathways RCP2.6, RCP4.5, and RCP8.5, wherein the numbers indicate the anthropogenic radiative forcing (W m−2) reached by the year 2100 (Taylor et al., 2012). Tro- pospheric ozone concentrations are the same for all three RCP scenarios (Giorgetta et al., 2013). Furthermore, we an- alyze the variations of wind stress during the last 2 millen- nia in a simulation with the Earth system model MPI-ESM-P (ECHAM2k) (Sebastian Wagner, personal communication, 2018).
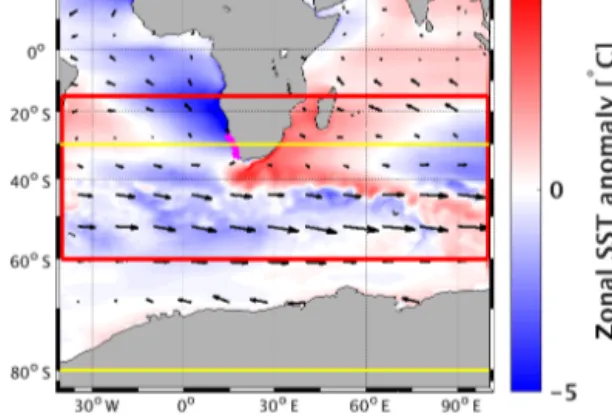
Figure 1.Figure of the research area. Shaded colors (deviations of sea surface temperature from their zonal mean of the INALT20 sim- ulation) depict the warm Agulhas Current at the southeast coast of South Africa and the cool Benguela current at the southwest coast.
Arrows show the mean wind stress field in the study region, de- rived from the COREv2 data set. The area between 40◦W–100◦E and 15–60◦S, in which the position and intensity of the trade winds and westerlies are calculated, is indicated by the red box. The yel- low lines represent the northern and southern border (30 and 80◦S) where the Southern Hemisphere temperature gradient is calculated.
The magenta line is the area where the upwelling index for South Benguela is taken (27–34◦S, 100 km offshore to coast).
For our study of the trade winds and the westerly wind band we analyze the averages of the austral summer sea- son (December–January–February; DJF) of zonal wind stress over the whole South Atlantic and southern Indian Ocean (40◦W–100◦E, 15–60◦S; Fig. 1, red box). From these data, we calculated the temporal variation of the latitude of max- imum westerly winds (hereafter, the position of westerlies) and the latitude of maximum wind stress curl (the latitude at which winds change from westerlies to easterly trades; here- after the position of trades). Furthermore, we calculated the intensity of the westerlies as the meridional mean between 60◦S and the latitude at which winds change from wester- lies to trades to analyze the intensity of the wind stress in addition to the position of the wind systems. For the trades, we calculated the meridional mean between the latitude at which winds change from westerlies to trades and 15◦S.
We focus on DJF because it is the season of maximum up- welling in South Benguela (Tim et al., 2015). To investigate whether there is an impact of the El Niño–Southern Oscilla- tion (ENSO), we used the Multivariate ENSO Index (MEI;
Wolter and Timlin, 1993), a bimonthly time series (1950–
2009) including not only SSTs and sea level pressure (SLP), but also additional atmospheric variables for calculating the index. For ENSO, the seasonal mean of DJF was calculated by averaging the bimonthly means of December–January and January–February.
Vertical velocity in the ocean as simulated by the global ocean simulation INALT20 (1/20◦ horizontal resolution) driven by COREv2 atmospheric forcing (Schwarzkopf et al.,
2019) is used as an upwelling index. The data were selected at 100 m of depth in the region between 27 and 34◦S over a corridor of 100 km along the coast from the Cape Basin (34◦S) to Lüderitz (27◦S; see Fig. 1, magenta area).
For the statistical significance of the linear trends in the wind stress position and intensity and the linear correlations, a significance level ofp=0.05 was adopted.
For the COREv2 data set we used the wind stress as seen by INALT20: this wind stress data set is the COREv2 data interpolated to the global host grid of INALT20, at 1/4◦ resolution and considering ocean velocities (relative winds).
Since the position and intensity of the data sets COREv2, NCEP, and ECHAM6XR are significantly correlated (be- tweenr=0.85 andr=0.94), taking the ocean velocity into account when calculating the wind stress does not impact the conclusions of this study.
3 Results
3.1 Position and intensity of westerlies and trades The positions of the westerlies and trades (DJF means) over the South Atlantic and Indian Ocean are calculated based on the wind stress of the data sets NCEP1, COREv2, JRA- 55, ERA20C, and ECHAM6XR. The interannual variations in the positions of these two variables are significantly cor- related with correlation coefficients between r=0.65 and r=0.78. Figure 2a exemplarily shows the results of the COREv2 data set. For the other data sets, see Fig. S1 in the Supplement.
The width of the westerlies band is defined here as the distance between the latitude of the maximum of the west- erlies and the equatorward latitude at which the wind stress changes to easterly trades. This width is negatively correlated with the position of the westerlies. Thus, a more southerly latitude of the maximum winds tends to occur simultane- ously with a broader subtropical belt of westerlies. Both trades and westerlies tend to shift poleward or equatorward simultaneously, but the amplitude of westerlies displacement is stronger, leading to a correlation between the latitudinal position of the wind systems and the width of the subtropi- cal belt of westerlies. All five data sets show highly signif- icant correlations (betweenr= −0.60 andr= −0.84). Fig- ure 3 shows the wind stress of the COREv2 data set for the year 1964–1965 at the beginning of the time series (panel a) and in the year 2007–2008 at the end of the analysis period (panel b). The intensification, poleward displacement, and widening are clearly borne out by these results.
We also investigate the variations in the intensity of the westerlies and the trade winds. The intensity of the west- erlies is defined here as the zonal wind meridionally aver- aged between 60◦S and the latitude of maximum wind stress curl; the intensity of the trade winds is defined as the zonal wind meridionally averaged between the maximum wind stress curl and 15◦S. As expected, the intensity and position
of the westerlies are highly negatively correlated (between r= −0.56 andr= −0.78) so that a more southerly position of the wind maximum is accompanied by stronger westerlies and vice versa. Furthermore, there is also a positive correla- tion between the width of the westerlies band and the inten- sity of the westerlies so that the width of the westerly band (equatorward of the maximum) is broader when the wester- lies are stronger (for ERA20C r=0.32 and ECHAM6XR r=0.45).
The correlation of the intensity of the westerlies and trades is, although statistically not significant for NCEP1 and COREv2, negative (betweenr= −0.21 andr= −0.62).
These negative correlations indicate a tendency of both wind systems to intensify or weaken at the same time, especially in the model simulation ECHAM6XR and the reanalyses data sets with higher spatial resolution than NCEP1 and COREv2. The correlations are numerically negative because winds are positive when directed eastward. Figure 2b exem- plarily shows the results of the COREv2 data set. For the other data sets, see Fig. S2.
Thus, both subtropical wind systems tend to vary coher- ently, and a more poleward position goes with stronger west- erlies and a broader subtropical belt of westerlies; a more equatorward position goes with a weaker and narrower belt of westerlies.
A trend analysis over the recent decades (1948–2012, 1958–2013, 1958–2009, and 1948–2015) reveals a shift of both the westerlies and trades to more poleward positions in all data sets (Table 1). Trends in the position of the wester- lies are stronger than those of the trades and are statistically significant in all but one data set (the position of trades in COREv2). The strength of the westerlies is also increasing;
all data sets provide significant positive trends. The inten- sity of the trade winds shows a significant (positive) trend in JRA-55 and ECHAM6XR.
The reanalysis covering the whole last century, ERA20C, shows significant trends for the position (poleward shift) and intensity (strengthening) of both wind systems: the westerlies and trades.
The poleward shift and intensification of the westerlies is linked to trends in the Southern Annular Mode (SAM).
This index is defined as the difference of SLP anomaly be- tween 40 and 60◦S, here calculated from the COREv2 data set. Correlations reveal a strong and significant link between SAM and the position of the trades (r= −0.79) and west- erlies (r= −0.73), as well as with the intensity of the west- erlies (r=0.85). The trends identified in the wind systems as previously described are related to the positive trend in SAM over the recent decades (1958–2009). These results agree with the study of Loveday et al. (2015). They found that SAM modulates Indian Ocean westerlies and further de- tected the impact of this connection on the Agulhas leakage.
Expanding our research area to the whole Southern Hemi- sphere, again using the wind stress over the ocean between 15 and 60◦S derived from the NCEP1 and COREv2 data sets,
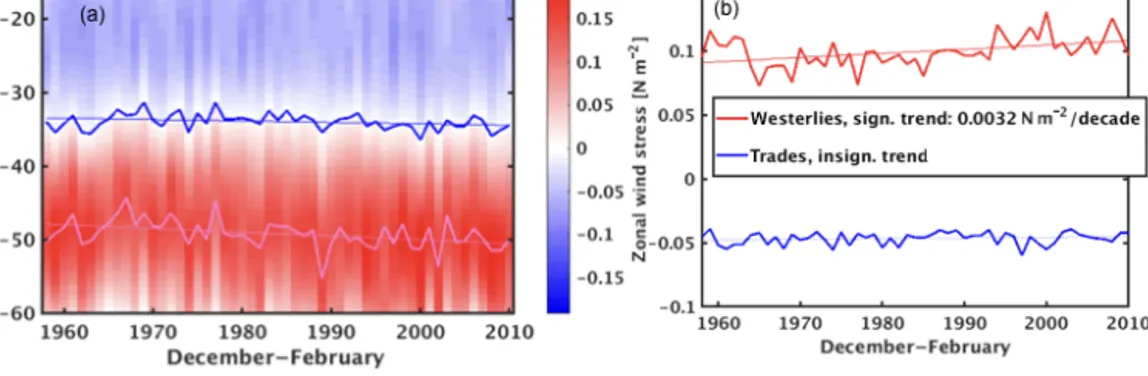
Figure 2.Temporal evolution of zonal mean (40◦W–100◦E) zonal wind stress (N m−2) (shaded color) and the meridional position of the maximum of the westerlies (light pink curve) and the wind stress curl (blue curve). The linear trends in their positions are also displayed.
There is a significant trend of−0.52◦per decade in the position of the westerlies and an insignificant trend for the trades(a). The temporal evolution of the intensity of wind stress for the westerlies (mean between 60◦S and of the latitude at which wind stress turns eastward) and trades (mean between latitude at which wind stress turns eastward and 15◦S) and their corresponding linear trends(b), both in December–
February as derived from the COREv2 data set in the period 1958–2009.
Figure 3.Temporal mean of the December–February wind stress (N m−2) for the periods 1964/1965(a)and 2007/2008(b)derived from the COREv2 data set. Contours and shading represent the same variable.
reveals the comparable correlations and trends in both data sets as in the previous analysis that was limited to the At- lantic and Indian Ocean sector. The position and intensity of the westerlies display significant trends, whereas the trades do not.
A candidate forcing mechanism for the trends and variabil- ity of the westerlies may involve the latitudinal surface tem- perature gradient (via the thermal wind equation). To test this hypothesis, we calculate the Southern Hemisphere merid- ional temperature gradient between 30 and 80◦S from the NCEP1 data (Fig. 1, yellow lines). This gradient was esti- mated with a linear fit of the zonal mean temperature against latitude for each December-to-February season, thus yielding one value of the gradient per year. Correlations between the latitudinal temperature gradient at the surface and the wind stress reveal a strong temperature gradient associated with a southerly position of the westerlies (r= −0.83), a broader westerlies band (r=0.65), and stronger westerlies (r=0.8).
The estimated impact of the meridional temperature gradi- ent on the zonal wind stress profile between 45 and 65◦S is depicted in Fig. 4, along with the climatological merid- ional profile of the wind stress. The impact of the temper-
ature gradient is estimated from a linear regression between the meridional temperature gradient in this region (predictor) and the zonal wind stress at each latitude band (predictand).
wind_stress(latitude, time)= wind_stress_climatology(latitude)
+α×temperature_gradient(time)
+residual(latitude,time) (1)
Figure 4 shows with red and blue lines the mean wind stress profile in years with an anomalous meridional temperature gradient: red indicates steeper than 1 standard deviation, and blue indicates flatter than 1 standard deviation.
3.2 Variability in the past and future climate
The global ECHAM2k simulation is a coupled atmosphere–
ocean simulation with a state-of-the art Earth system model driven by external climate drivers (solar variations, volcanic activity, and greenhouse gases). The simulation covers the last 2 millennia, for which statistical analyses of trends and variability of the wind systems were conducted similarly to
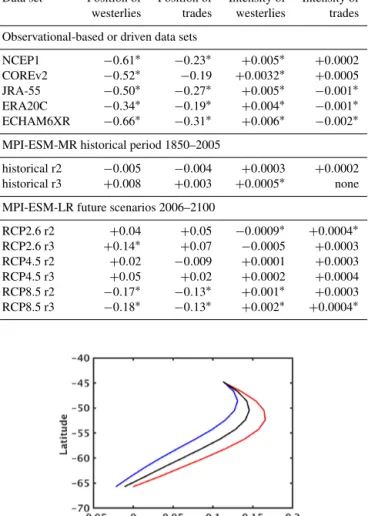
Table 1. Trends of the position (degrees per decade) and in- tensity (Nm−2 per decade) of the westerlies and trades for the five observational-based data sets (NCEP1, COREv2, JRA-55, ERA20C, ECHAM6XR), for two free-running MPI-ESM simula- tions (r2 and r3) for the historical period, and for two simulations (r2 and r3) for three future scenarios. Statistically significant trends at the 95 % level are marked with an asterisk.
Data set Position of Position of Intensity of Intensity of westerlies trades westerlies trades Observational-based or driven data sets
NCEP1 −0.61∗ −0.23∗ +0.005∗ +0.0002 COREv2 −0.52∗ −0.19 +0.0032∗ +0.0005 JRA-55 −0.50∗ −0.27∗ +0.005∗ −0.001∗ ERA20C −0.34∗ −0.19∗ +0.004∗ −0.001∗ ECHAM6XR −0.66∗ −0.31∗ +0.006∗ −0.002∗ MPI-ESM-MR historical period 1850–2005
historical r2 −0.005 −0.004 +0.0003 +0.0002 historical r3 +0.008 +0.003 +0.0005∗ none MPI-ESM-LR future scenarios 2006–2100
RCP2.6 r2 +0.04 +0.05 −0.0009∗ +0.0004∗ RCP2.6 r3 +0.14∗ +0.07 −0.0005 +0.0003 RCP4.5 r2 +0.02 −0.009 +0.0001 +0.0003 RCP4.5 r3 +0.05 +0.02 +0.0002 +0.0004 RCP8.5 r2 −0.17∗ −0.13∗ +0.001∗ +0.0003 RCP8.5 r3 −0.18∗ −0.13∗ +0.002∗ +0.0004∗
Figure 4. Impact of the meridional surface temperature gradient between 30 and 80◦S on the Southern Hemisphere wind stress intensity and position. The black curve shows the climatological mean of the zonal wind stress at the latitudinal range 45–65◦S in December–February (seasonal mean over the period January 1948–
August 2012) with NCEP1. The blue and red curves show the mean wind stress profile in years with a steeper temperature gradient (more than 1 standard deviation; red line) or in years with a flat- ter temperature gradient (more than 1 standard deviation; blue line).
The meridional temperature gradient was estimated as the slope of a linear fit of the zonal mean temperature against latitude.
those for reanalysis data in the previous section. In general, the correlations of the position and intensity of trades and westerlies support the inferences based on the reanalysis data sets and the global downscaling product ECHAM6XR. Vari- ations in the latitudinal position and strength of the wester-
lies and trades tend to be simultaneous, and the westerlies band is broader when the westerly maximum has a more poleward position. Regarding centennial trends, the results are more ambiguous: calculated for each century separately, they suggest that winds are stronger when located more pole- ward in 16 (14) centuries out of 21 for the westerlies (trades) (Fig. S3). During the 16th century, a particularly cold century during the Little Ice Age (LIA) between the 15th and the 19th centuries, the westerlies significantly weakened and shifted equatorward. This is supported by the studies by Hahn et al.
(2017), Stager et al. (2012), and Granger et al. (2018), who also found that the winds shifted equatorward during cooler and poleward during warmer periods. Nevertheless, the po- sition of Southern Hemisphere westerlies during the LIA is still under debate and seems to depend on the region, as stud- ies of the African, South American, and Australian sector provide varying results (Chase and Meadows, 2007).
The MPI-ESM simulations for the historical period (1850–
2005) and the future (2006–2100) reveal the same coherence of the westerlies and trades as the other data sets (NCEP1, COREv2, JRA-55, ERA20C, and ECHAM6XR). However, a significant difference is that the intensities of the trades and westerlies are not correlated in the RCP4.5 and RCP8.5 simulations. Also, the trends for most parts are statistically not significant over the historical period and only partly sig- nificant in scenarios of future radiative forcing (Table 1).
Although the simulations of the historical period produce weaker trends than observed, we provide an explanation here as to why the simulations with different scenarios of green- house emissions produce different trends in the wind sys- tems. This explanation involves the compensation of diverg- ing trends caused by ozone on the one hand and by anthro- pogenic greenhouse gases on the other hand. The strongest scenario, RCP8.5, indicates a poleward shift and intensifi- cation of the westerlies (and a poleward shift and weaken- ing of the trades). In the weaker emission scenario (RCP2.6), by contrast, the simulation displays a northward shift of the westerlies and a weakening of the trades and westerlies. As prescribed ozone concentrations are the same in all three sce- narios, the amount of anthropogenic greenhouse gas emis- sions is likely the factor that causes the difference in the simulated trends in the wind systems. It has previously been found in simulations that ozone recovery causes a northward shift and a weakening of the tropospheric jet and a lowering of the SAM (Southern Annular Mode) values (Watson et al., 2012). This is likely the effect seen in the simulations with the weaker RCP2.6 scenario. Only with the stronger RCP8.5 scenario are the emissions strong enough to counteract the ef- fects of ozone recovery. The simulated trends under RCP4.5 forcing are not statistically significant, which in our interpre- tation would indicate a balance of both driving factors, ozone recovery and anthropogenic greenhouse gas emissions. It has to be kept in mind that the details of these results depend on the model.
Figure 5. Meridional position of the maximum intensity of the westerlies in December–February derived from the COREv2 re- analysis and the MPI-ESM historical simulations r2 and r3.
The comparison of the time series from COREv2 to the MPI-ESM historical runs in the period 1958–2009 reveals that the position of the westerlies is more to the north during the last 20 years in the coupled model simulation than in the reanalysis data set (Fig. 5) and at a similar latitudinal position as the reanalysis in the beginning of the simulation time pe- riod. This leads to the not significant trends in the historical period in the MPI-ESM simulations. Therefore, the response of the wind stress to the increase in anthropogenic green- house gases and decrease in ozone is weaker in the MPI- ESM simulation than in the observational-based COREv2 data. This weaker sensitivity, detected in the historical pe- riod, may be relevant for the real future trends. Thus, the sim- ulated decrease in the westerlies in the scenario RCP2.6 and increase under scenario RCP8.5 may be an underestimation of the expected response.
3.3 The impact of the position of westerlies and trades on the South Benguela upwelling
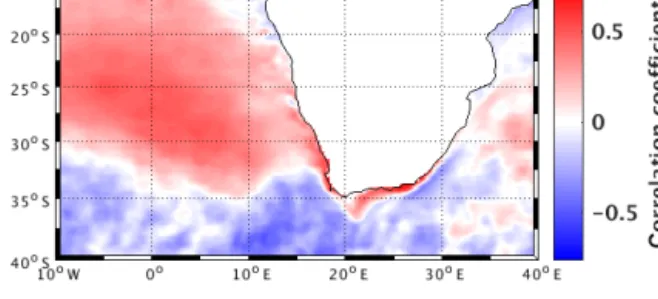
For this section we limit our analysis to the COREv2 data set and use the simulated vertical velocity of the COREv2-driven INALT20 ocean simulation to investigate the link between the westerlies and upwelling intensity in the Benguela up- welling system. The correlation between the upwelling (sim- ulated vertical velocity at 100 m of depth), spatially aver- aged over the South Benguela upwelling region (27–34◦S, 100 km width band off the coast; Fig. 1, magenta area), and the position of the trades is not significant but shows a weak tendency towards stronger upwelling when the trades are lo- cated further south. In contrast to their position, the intensity of the trades does show a significant negative correlation with upwelling (r= −0.33), implying stronger upwelling when trades are intensified. Although the link between the position of the trades and upwelling is weak, there is a clear corre- lation between the position of the trades and SSTs (Fig. 6).
A northerly position of the trades is linked to negative SST anomalies west of the southern tip of the African continent and in the offshore part of the South Benguela upwelling re-
Figure 6. Correlation pattern of the sea surface temperature in the INALT20 simulation and the position of the trades from the COREv2 reanalysis in December–February over the period 1958–
2009.
gion but not directly at the coast. The correlation of the posi- tion of the trades and the spatial average of the SST over the upwelling region is significant and positive (r=0.43). Thus, a northerly position of the trade winds is associated with warm SSTs in the upwelling region and with cooler SSTs fur- ther offshore (Fig. 6). This is explained by the relationships between the position of the trades and intensity of upwelling on the one hand and by the relationship between the position of the trades and the Agulhas leakage on the other hand. First, warm SSTs in the upwelling region indicate that upwelling is weakened during a more northerly position of the trades.
Secondly, the Agulhas leakage is weakened during weaker westerlies. Since the position of the trades and the westerlies is significantly correlated, a more northerly position of the trades leads to weaker westerlies. Furthermore, since west- erlies and trades in general shift in the same direction, the low SSTs offshore of the upwelling on the shelf are caused by a weak Agulhas leakage and a reduced transport of warm water from the Indian Ocean into the Cape Basin.
ENSO has been found to have some influence on the South Atlantic trade winds, on the westerlies, and also on the Benguela upwelling (Tim et al., 2015; Philippon et al., 2012). The correlation between ENSO and the trades is rel- atively strong and significant (intensity:r=0.38, position:
r=0.46), whereas the correlation between ENSO and the westerlies is weak and not significant. Nevertheless, the sign of both correlations is the same so that ENSO does not dis- rupt the tendency of the trades and westerlies to intensify or weaken at the same time. The position of the trades is dis- placed to the north, trades are weak during a positive ENSO phase (El Niño), and Benguela upwelling is slightly reduced (Tim et al., 2015). Westerlies also tend to be located further north during an El Niño event (although this link is statisti- cally weaker) and the Agulhas leakage is reduced, leading to cooler SSTs in the Cape Basin and offshore of the upwelling region.
4 Discussion and conclusions
We analyzed the intensity and position of the trade winds and of the belt of westerlies in the South Atlantic and southern Indian Ocean with regard to implications for the intensity of the Agulhas leakage and the South Benguela upwelling dur- ing austral summer (December–February), as modeled for the last 2 millennia, the last century, and the past 60 years (∼1950–2010) and projected for the 21st century.
Our conclusions are listed and discussed in the following.
– Link between the position and intensity of trades and westerlies. The analysis of the reanalysis data sets NCEP1, COREv2, JRA-55, and ERA20C, the global high-resolution simulation ECHAM6XR, and the Earth system model MPI-ESM shows that interannual latitu- dinal shifts in the position and intensity of the trades and westerlies go hand in hand. Both systems tend to si- multaneously shift latitudinally. When the shift is pole- ward they also tend to become stronger. These results are confirmed by the analyses of the position and in- tensity of the wind stress over the entire southern ocean between 60 and 15◦S. One driving mechanisms appears to be the surface air temperature difference between the subtropics and midlatitudes, as the position and inten- sity of the wind systems are correlated with the merid- ional temperature gradient: the stronger the gradient, the further south and stronger the westerlies. As for these atmospheric data sets that are generated in simulations in which the SSTs are prescribed, the causal link be- tween the temperature gradient and the wind stress can only come from the prescribed SSTs to the simulated wind stress. Thus, these correlations indeed result from a physical link. In the case of coupled simulations, the answer is not as clear. However, there is a very plau- sible mechanism by which temperature gradients drive the geostrophic part of the westerlies through the ef- fect of temperature on density. A mechanism by which zonal winds may physically cause meridional tempera- ture gradients is not as plausible.
Correlations with the Southern Annular Mode (SAM) reveal a strong connection to the sea level pressure (SLP) difference between the subtropics and midlati- tudes as well.
– Trends over the historical period. During the recent decades the westerlies have shifted poleward and have become more intense (in the reanalysis data sets). How- ever, the trends of the MPI-ESM for the historical time period (1850–2005) are weaker than in the reanalysis data sets and mainly insignificant (even when analyz- ing a time span comparable to that covered by the other data sets). Swart and Fyfe (2012) also found an in- tensification and poleward shift of the Southern Hemi- sphere surface westerly wind stress jet in various Cou- pled Model Intercomparison Project model simulations
(CMIP3 and CMIP5) and reanalysis data sets. Further- more, there are reasons that suggest that the trends in the reanalysis are not artifacts. NCEP1 has been shown to have an above-average trend of SAM (Marshall, 2003) and therefore probably in other parameters dependent on SLP in that region. COREv2 is based on NCEP1. The global simulation with the atmospheric general circula- tion model ECHAM6XR is only dependent on NCEP1 and shows even stronger trends than the reanalysis data sets. Also analyzing the more recent data sets JRA-55 and ERA20C confirms our results of a poleward shift and intensification of the westerlies and the trades over the South Atlantic and Indian Ocean. Thus, these long- term trends are present across different reanalysis data sets that assimilate different observations.
Watson et al. (2012) and McLandress et al. (2011) found that increasing anthropogenic greenhouse gas emissions and ozone depletion drive the trends in the position and intensity of the westerlies over the past decades. The ozone concentration has not yet fully recovered from the minimum attained in the 1990s, and a slightly posi- tive trend in observations since the year 2000 is over- lain by large interannual variability (Solomon et al., 2016). The trends in the intensity and position of the westerlies have been found to cause an intensification of the Agulhas leakage in ocean simulations driven by atmospheric meteorological reanalysis (Biastoch et al., 2009). Durgadoo et al. (2013) and Loveday et al. (2014) showed that Agulhas leakage and the Agulhas Current are decoupled, but both respond to the intensification of the westerlies and trades, respectively. Beal and Elipot (2016) confirm that intensified winds impact the Ag- ulhas Current, though not by strengthening it but by broadening it. Thus, the coherent variability and trends in the two wind systems cause a modulation of both oceanic components: the Agulhas Current and Agulhas leakage.
– Link between wind systems, Agulhas leakage, and South Benguela upwelling. The meridional shifts of the trades and the westerlies and the associated variations in their intensity have an impact on the SSTs around southern Africa. The position of the winds is only weakly corre- lated with South Benguela upwelling intensity (stronger upwelling when trades are shifted poleward). In con- trast, the strength of the trades is significantly corre- lated with Benguela upwelling, with more intense trades being linked to stronger upwelling in South Benguela.
Furthermore, a more southerly position of the wester- lies and trades leads to positive SST anomalies in the Cape Basin and the offshore part of the South Benguela upwelling region. This SST anomaly pattern cannot be explained by a more intense upwelling, which is usually linked to more intense trades and westerlies. Instead, the physical mechanisms linking variations in the strength
and position of the wind systems to SST in the South Atlantic is the Agulhas leakage, which modulates the advection of warm Indian Ocean water into the South Atlantic and into the Benguela upwelling system.
This agrees with the proxy-based findings of Granger et al. (2018) for the late Holocene. They found that dur- ing a northward shift of the westerlies, SSTs were lower in South Benguela, not caused by intensified upwelling but due to changes in the advected water masses.
– Trends over the last 2 millennia. Regarding the cen- tennial timescales over the past 2 millennia, the anal- ysis of the wind stress variations (of the general circu- lation model ECHAM2k) is consistent with the results obtained for the observational period. Both wind sys- tems, the westerlies and trade winds, are stronger when located further south in most of the centuries and vice versa. Furthermore, the northward shift and weakening of the westerlies during the cooler Little Ice Age (LIA) in the 16th century in these simulations is consistent with evidence from sediment cores for the same period (Granger et al., 2018): a weak Agulhas leakage during periods of cooler climate.
Nevertheless, model simulations and proxies hold un- certainties. Model simulations tend to overestimate the response to external climate forcing in the Southern Hemisphere during the last 2 millennia (PAGES 2k- PMIP3 group, 2015). Proxy analyses found that the period of the LIA has a different spatial and tempo- ral structure on both hemispheres (PAGES 2k Net- work, 2013). The scarcity of temporally highly re- solved climate archives (e.g., tree rings) induces large non-climatic noise in southern hemispheric reconstruc- tions, also leading to increased uncertainty (PAGES 2k- PMIP3 group, 2015). Despite these uncertainties, the temperature levels were in general lower during the pe- riod of the LIA in the Southern Hemisphere for both proxy (Granger et al., 2018) and model simulations.
– Projected trends for the 21st century. The future evolu- tion of the wind stress was analyzed with three emission scenarios of the MPI-ESM, differing in the prescribed strength of greenhouse gas forcing. Future trends of RCP2.6, the weakest scenario, indicate a northward shift and weakening of the westerlies, while trends de- rived from the scenario RCP8.5, the strongest scenario, indicate a southward shift and strengthening. The sce- nario with moderate emissions, RCP4.5, has no signifi- cant trend. As ozone concentration changes are equal in the three scenarios, these different trajectories lead us to conclude that the ozone pool will be the dominant driver if greenhouse gas emissions are drastically reduced. In the more probable business-as-usual scenario (RCP8.5) the increase in atmospheric greenhouse gas concentra- tions will override the ozone effect and will lead to a
further poleward shift and strengthening of the wester- lies.
Such a poleward shift and intensification of the west- erlies will enhance the Agulhas leakage and therefore cause a larger transport of warm Indian Ocean wa- ter into the South Atlantic. This is likely to affect the Benguela upwelling system in several ways and may have done so in the recent and geological past. A stronger leakage may increase the volume and change the properties of the Eastern South Atlantic Central Wa- ter (ESACW), containing Agulhas water that enters the Benguela upwelling system (Tim et al., 2018). This wa- ter mass will become younger, warmer, and richer in oxygen, and its higher volume increases the share of preformed nutrients in the South Benguela system. In contrast, a weakened Agulhas leakage due to a north- ward shift of the wind systems reduces the contribution of Agulhas water in the upwelling region, possibly to be compensated for by the inflow of an older intermediate water mass (the South Atlantic Central Water (SACW) dominant in the northern Benguela upwelling system) with low oxygen, high CO2, and high nutrient concen- trations. We postulate that variability in the positions and strengths of the dominant wind systems – remote westerlies and the trade winds – sets the pace for the Ag- ulhas contribution to the upwelling feed water masses in the Benguela upwelling system, impacting the produc- tivity of the region, its CO2 balance, ecosystems, and living natural resources.
Data availability. NCEP1 is available at https://www.esrl.noaa.
gov/psd/data/gridded/data.ncep.reanalysis.derived.surfaceflux.html (Kalnay et al., 1996), JRA-55 at https://rda.ucar.edu (Kobayashi et al., 2015), ERA20C at https://www.ecmwf.int/en/forecasts/
datasets/reanalysis-datasets/era-20c (Poli et al., 2016), and COREv2 at https://data1.gfdl.noaa.gov/nomads/forms/core/
COREv2/CIAF_v2.html (Large and Yeager, 2009). The MPI- ESM-MR, MPI-ESM-LR, and ECHAM6XR (Schubert-Frisius et al., 2016; Giorgetta et al., 2013) are available on the CERA database (https://cera-www.dkrz.de/WDCC/ui/cerasearch/). The INALT20 data set and ECHAM2k data set are available upon request from Franziska Schwarzkopf and Sebastian Wagner, respectively.
Supplement. The supplement related to this article is available online at: https://doi.org/10.5194/esd-10-847-2019-supplement.
Author contributions. NT and EZ conducted the analysis. FUS performed the INALT20 simulation. All authors participated in the discussion of the results and the writing of the paper.
Competing interests. The authors declare that they have no con- flict of interest.
Acknowledgements. The model simulation INALT20 has been performed at the North German Supercomputing Alliance (HLRN).
Our thanks go to Sebastian Wagner for his advice on paleoclimate reconstructions and for providing the MPI-ESM-P simulation of the past 2 millennia (ECHAM2k).
Financial support. This research has been supported by the Federal Ministry of Education and Research of Germany within the SPACES-Agulhas II project (grant nos. 03F0750A, 03F0750C) and the SPACES-CASISAC project (grant nos. 03F0796A, 03F0796D).
The article processing charges for this open-access publication were covered by a Research
Centre of the Helmholtz Association.
Review statement. This paper was edited by Gerrit Lohmann and reviewed by two anonymous referees.
References
Bakun, A., Field, D. B., Redondo-Rodriguez, A., and Weeks, S. J.:
Greenhouse gas, upwelling-favorable winds, and the future of coastal ocean upwelling ecosystems, Glob. Change Biol., 16, 1213–1228, https://doi.org/10.1111/j.1365-2486.2009.02094.x, 2010.
Beal, L. M. and Bryden, H. L.: Observations of an Ag- ulhas undercurrent, Deep-Sea Res. Pt. I, 44, 1715–1724, https://doi.org/10.1016/s0967-0637(97)00033-2, 1997.
Beal, L. M. and Elipot, S.: Broadening not strengthening of the Agulhas Current since the early 1990s, Nature, 540, 570–573, https://doi.org/10.1038/nature19853, 2016.
Biastoch, A., Böning, C. W., Schwarzkopf, F. U., and Lutje- harms, J.: Increase in Agulhas leakage due to poleward shift of Southern Hemisphere westerlies, Nature, 462, 495–498, https://doi.org/10.1038/nature08519, 2009.
Blanke, B., Speich, S., Bentamy, A., Roy, C., and Sow, B.: Modeling the structure and variability of the southern Benguela upwelling using QuikSCAT wind forcing, J. Geophys. Res.-Oceans, 110, C07018, https://doi.org/10.1029/2004jc002529, 2005.
Chase, B. M. and Meadows, M. E.: Late Quaternary dynamics of southern Africa’s winter rainfall zone, Earth Sci. Rev., 84, 103–
138, https://doi.org/10.1016/j.earscirev.2007.06.002, 2007.
Cheng, Y., Beal, L. M., Kirtman, B. P., and Putrasahan, D.: Interannual Agulhas Leakage Variability and Its Re- gional Climate Imprints, J. Climate, 31, 10105–10121, https://doi.org/10.1175/JCLI-D-17-0647.1, 2018.
De Boer, A. M., Graham, R. M., Thomas, M. D., and Kohfeld, K. E.:
The control of the Southern Hemisphere Westerlies on the po- sition of the Subtropical Front, J. Geophys. Res.-Oceans, 118, 5669–5675, https://doi.org/10.1002/jgrc.20407, 2013.
Durgadoo, J. V., Loveday, B. R., Reason, C. J. C., Penven, P., and Biastoch, A.: Agulhas Leakage Predominantly Responds to the
Southern Hemisphere Westerlies, J. Phys. Oceanogr., 43, 2113–
2131, https://doi.org/10.1175/JPO-D-13-047.1, 2013.
Emeis, K., Eggert, A., Flohr, A., Lahajnar, N., Nausch, G., Neu- mann, A., Rixen, T., Schmidt, M., Van der Plas, A., and Was- mund, N.: Biogeochemical processes and turnover rates in the Northern Benguela Upwelling System, J. Marine Syst., 188, 63–
80, https://doi.org/10.1016/j.jmarsys.2017.10.001, 2018.
Garzoli, S. and Gordon, A.: Origins and variability of the Benguela Current, J. Geophys. Res.-Oceans, 101, 897–906, https://doi.org/10.1029/95jc03221, 1996.
Giorgetta, M. A., Jungclaus, J., Reick, C. H., Legutke, S., Bader, J., Böttinger, M., Brovkin, V., Crueger, T., Esch, M., Fieg, K., Glushak, K., Gayler, V., Haak, H., Hollweg, H.-D., Ilyina, T., Kinne, S., Kornblueh, L., Matei, D., Mauritsen, T., Mikolajew- icz, U., Mueller, W., Notz, D., Pithan, F., Raddatz, T., Rast, S., Redler, R., Roeckner, E., Schmidt, H., Schnur, R., Segschnei- der, J., Six, K. D., Stockhause, M., Timmreck, C., Wegner, J., Widmann, H., Wieners, K.-H., Claussen, M., Marotzke, J., and Stevens, B.: Climate and carbon cycle changes from 1850 to 2100 in MPI-ESM simulations for the Coupled Model Intercom- parison Project phase 5, J. Adv. Model. Earth Syst., 5, 572–597, https://doi.org/10.1002/jame.20038, 2013.
Gordon, A. L.: Interocean exchange of thermocline water, J. Geophys. Res.-Oceans, 91, 5037–5046, https://doi.org/10.1029/JC091iC04p05037, 1986.
Granger, R., Meadows, M. E., Hahn, A., Zabel, M., Stuut, J.-B. W., Herrmann, N., and Schefuß, E.: Late-Holocene dynamics of sea-surface temperature and terrestrial hy- drology in southwestern Africa, Holocene, 28, 695–705, https://doi.org/10.1177/0959683617744259, 2018.
Hahn, A., Schefuß, E., Andò, S., Cawthra, H. C., Frenzel, P., Kugel, M., Meschner, S., Mollenhauer, G., and Zabel, M.: Southern Hemisphere anticyclonic circulation drives oceanic and climatic conditions in late Holocene southernmost Africa, Clim. Past, 13, 649–665, https://doi.org/10.5194/cp-13-649-2017, 2017.
Hutchings, L., Van Der Lingen, C., Shannon, L., Crawford, R., Verheye, H., Bartholomae, C., Van der Plas, A., Louw, D., Kreiner, A., Ostrowski, M., Fidel, Q., Barlowa, R. G., Lamont, T., Coetzee, J., Shillington, F., Veitch, J., Currie, J. C., and Monteiro, P. M. S.: The Benguela Current: An ecosystem of four components, Prog. Oceanogr., 83, 15–32, https://doi.org/10.1016/j.pocean.2009.07.046, 2009.
Kalnay, E., Kanamitsu, M., Kistler, R., Collins, W., Deaven, D., Gandin, L., Iredell, M., Saha, S., White, G., Woollen, J., Zhu, Y., Chelliah, M., Ebisuzaki, W., Higgins, W., Janowiak, J., Mo, K. C., Ropelewski, C., Wang, J., Leet- maa, A., Reynolds, R., Jenne, R., and Joseph, D.: The NCEP/NCAR 40-year reanalysis project, B. Am. Me- teorol. Soc., 77, 437–471, https://doi.org/10.1175/1520- 0477(1996)077<0437:tnyrp>2.0.co;2, 1996 (data available at: https://www.esrl.noaa.gov/psd/data/gridded/data.ncep.
reanalysis.derived.surfaceflux.html, last access: 31 August 2018).
Kobayashi, S., Ota, Y., Harada, Y., Ebita, A., Moriya, M., Onoda, H., Onogi, K., Kamahori, H., Kobayashi, C., Endo, H., Miyaoka, K., and Takahashi, K.: The JRA-55 Reanalysis: General Spec- ifications and Basic Characteristics, J. Meteorol. Soc. Jpn. Ser.
II, 93, 5–48, https://doi.org/10.2151/jmsj.2015-001, 2015 (data available at: https://rda.ucar.edu, last access: 15 August 2018).
Large, W. and Yeager, S.: The global climatology of an in- terannually varying air–sea flux data set, Clim. Dynam., 33, 341–364, https://doi.org/10.1007/s00382-008-0441-3, 2009 (data available at: https://data1.gfdl.noaa.gov/nomads/forms/
core/COREv2/CIAF_v2.html, last access: 31 August 2018).
Loveday, B. R., Durgadoo, J. V., Reason, C. J. C., Biastoch, A., and Penven, P.: Decoupling of the Agulhas Leakage from the Agulhas Current, J. Phys. Oceanogr., 44, 1776–1797, https://doi.org/10.1175/JPO-D-13-093.1, 2014.
Loveday, B. R., Penven, P., and Reason, C. J. C.: Southern Annu- lar Mode and westerly-wind-driven changes in Indian-Atlantic exchange mechanisms, Geophys. Res. Lett., 42, 4912–4921, https://doi.org/10.1002/2015GL064256, 2015.
Marshall, G. J.: Trends in the Southern Annular Mode from Observations and Reanalyses, J. Cli- mate, 16, 4134–4143, https://doi.org/10.1175/1520- 0442(2003)016<4134:TITSAM>2.0.CO;2, 2003.
McLandress, C., Shepherd, T. G., Scinocca, J. F., Plummer, D. A., Sigmond, M., Jonsson, A. I., and Reader, M. C.: Separating the Dynamical Effects of Climate Change and Ozone Depletion.
Part II: Southern Hemisphere Troposphere, J. Climate, 24, 1850–
1868, https://doi.org/10.1175/2010JCLI3958.1, 2011.
Mohrholz, V., Bartholomae, C., Van der Plas, A., and Lass, H.: The seasonal variability of the northern Benguela undercurrent and its relation to the oxygen budget on the shelf, Cont. Shelf Res., 28, 424–441, https://doi.org/10.1016/j.csr.2007.10.001, 2008.
PAGES 2k Network: Continental-scale temperature variability during the past two millennia, Nat. Geosci., 6, 339–346, https://doi.org/10.1038/ngeo1797, 2013.
PAGES 2k-PMIP3 group: Continental-scale temperature variabil- ity in PMIP3 simulations and PAGES 2k regional temperature reconstructions over the past millennium, Clim. Past, 11, 1673–
1699, https://doi.org/10.5194/cp-11-1673-2015, 2015.
Peeters, F. J., Acheson, R., Brummer, G.-J. A., De Ruijter, W. P., Schneider, R. R., Ganssen, G. M., Ufkes, E., and Kroon, D.:
Vigorous exchange between the Indian and Atlantic oceans at the end of the past five glacial periods, Nature, 430, 661–665, https://doi.org/10.1038/nature02785, 2004.
Philippon, N., Rouault, M., Richard, Y., and Favre, A.: The influ- ence of ENSO on winter rainfall in South Africa, Int. J. Clima- tol., 32, 2333–2347, https://doi.org/10.1002/joc.3403, 2012.
Poli, P., Hersbach, H., Dee, D. P., Berrisford, P., Simmons, A. J., Vitart, F., Laloyaux, P., Tan, D. G. H., Peubey, C., Thépaut, J.-N., Trémolet, Y., Hólm, E. V., Bonavita, M., Isaksen, L., and Fisher, M.: ERA-20C: An Atmo- spheric Reanalysis of the Twentieth Century, J. Climate, 29, 4083–4097, https://doi.org/10.1175/JCLI-D-15-0556.1, 2016 (data available at: https://www.ecmwf.int/en/forecasts/datasets/
reanalysis-datasets/era-20c, last access: 31 August 2018).
Ruijter, W. D.: Asymptotic Analysis of the Ag- ulhas and Brazil Current Systems, J. Phys.
Oceanogr., 12, 361–373, https://doi.org/10.1175/1520- 0485(1982)012<0361:AAOTAA>2.0.CO;2, 1982.
Schubert-Frisius, M., Feser, F., Von Storch, H., and Rast, S.: Op- timal Spectral Nudging for Global Dynamical Downscaling, Mon. Weather Rev., 145, 909–927, https://doi.org/10.1175/mwr- d-16-0036.1, 2016 (data available at: https://cera-www.dkrz.de/
WDCC/ui/cerasearch/, last access: 13 December 2018).
Schwarzkopf, F. U., Biastoch, A., Böning, C. W., Chanut, J., Durgadoo, J. V., Getzlaff, K., Harlaß, J., Rieck, J. K., Roth, C., Scheinert, M. M., and Schubert, R.: The INALT family – a set of high-resolution nests for the Agulhas Current sys- tem within global NEMO ocean/sea-ice configurations, Geosci.
Model Dev., 12, 3329–3355, https://doi.org/10.5194/gmd-12- 3329-2019, 2019.
Shannon, L. V.: The Benguela Ecosystem Part I: Evolution of the Benguela, physical features and processes, Oceanogr. Mar. Biol., 23, 105–182, 1985.
Small, R. J., Curchitser, E., Hedstrom, K., Kauffman, B., and Large, W. G.: The Benguela Upwelling System: Quantifying the Sensitivity to Resolution and Coastal Wind Representa- tion in a Global Climate Model, J. Climate, 28, 9409–9432, https://doi.org/10.1175/JCLI-D-15-0192.1, 2015.
Solomon, S., Ivy, D. J., Kinnison, D., Mills, M. J., Neely, R. R., and Schmidt, A.: Emergence of healing in the Antarctic ozone layer, Science, 353, 269–274, https://doi.org/10.1126/science.aae0061, 2016.
Stager, J. C., Mayewski, P. A., White, J., Chase, B. M., Neumann, F.
H., Meadows, M. E., King, C. D., and Dixon, D. A.: Precipitation variability in the winter rainfall zone of South Africa during the last 1400 yr linked to the austral westerlies, Clim. Past, 8, 877–
887, https://doi.org/10.5194/cp-8-877-2012, 2012.
Swart, N. C. and Fyfe, J. C.: Observed and simulated changes in the Southern Hemisphere surface westerly wind-stress, Geophys.
Res. Lett., 39, L16711, https://doi.org/10.1029/2012GL052810, 2012.
Taylor, K. E., Stouffer, R. J., and Meehl, G. A.: An Overview of CMIP5 and the Experiment Design, B. Am. Meteorol. Soc., 93, 485–498, https://doi.org/10.1175/BAMS-D-11-00094.1, 2012.
Tim, N., Zorita, E., and Hünicke, B.: Decadal variability and trends of the Benguela upwelling system as simulated in a high-resolution ocean simulation, Ocean Sci., 11, 483–502, https://doi.org/10.5194/os-11-483-2015, 2015.
Tim, N., Zorita, E., Hünicke, B., Yi, X., and Emeis, K.-C.: The im- portance of external climate forcing for the variability and trends of coastal upwelling in past and future climate, Ocean Sci., 12, 807–823, https://doi.org/10.5194/os-12-807-2016, 2016.
Tim, N., Zorita, E., Schwarzkopf, F. U., Rüs, S., Emeis, K.-C., and Biastoch, A.: The impact of Agulhas leakage on the central water masses in the Benguela upwelling system from a high-resolution ocean simulation, J. Geophys. Res.-Oceans, 123, 9416–9428, https://doi.org/10.1029/2018jc014218, 2018.
von Storch, H., Langenberg, H., and Feser, F.: A Spectral Nudg- ing Technique for Dynamical Downscaling Purposes, Mon.
Weather Rev., 128, 3664–3673, https://doi.org/10.1175/1520- 0493(2000)128<3664:ASNTFD>2.0.CO;2, 2000.
Wang, C., Zhang, L., Lee, S.-K., Wu, L., and Mechoso, C. R.: A global perspective on CMIP5 climate model biases, Nat. Clim.
Change, 4, 201–205, https://doi.org/10.1038/NCLIMATE2118, 2014.
Watson, P. A. G., Karoly, D. J., Allen, M. R., Faull, N., and Lee, D. S.: Quantifying uncertainty in future Southern Hemi- sphere circulation trends, Geophys. Res. Lett., 39, L23708, https://doi.org/10.1029/2012GL054158, 2012.
Wolter, K. and Timlin, M. S. (Eds.): Monitoring ENSO in COADS with a Seasonally Adjusted Principal Component Index, Pro- ceedings of the 17th Climate Diagnostics Workshop, Nor-
man, OK, NOAA/NMC/CAC, NSSL, Oklahoma Climate Sur- vey, CIMMS and the School of Meteorology, University of Ok- lahoma, Norman, OK, USA, 1993.