www.earth-syst-dynam.net/8/129/2017/
doi:10.5194/esd-8-129-2017
© Author(s) 2017. CC Attribution 3.0 License.
Changes in the seasonal cycle of the Atlantic meridional heat transport in a RCP 8.5 climate projection in MPI-ESM
Matthias Fischer1, Daniela I. V. Domeisen2,3, Wolfgang A. Müller4, and Johanna Baehr1
1Institute of Oceanography, Center for Earth System Research and Sustainability, Universität Hamburg, Bundesstrasse 53, 20146 Hamburg, Germany
2GEOMAR Helmholtz Centre for Ocean Research Kiel, Kiel, Germany
3University of Kiel, Kiel, Germany
4Max Planck Institute for Meteorology, Hamburg, Germany Correspondence to:Johanna Baehr (johanna.baehr@uni-hamburg.de)
Received: 6 June 2016 – Discussion started: 16 June 2016
Revised: 17 December 2016 – Accepted: 4 January 2017 – Published: 22 February 2017
Abstract. We investigate changes in the seasonal cycle of the Atlantic Ocean meridional heat transport (OHT) in a climate projection experiment with the Max Planck Institute Earth System Model (MPI-ESM) performed for the Coupled Model Intercomparison Project Phase 5 (CMIP5). Specifically, we compare a Representative Concentration Pathway (RCP) RCP 8.5 climate change scenario, covering the simulation period from 2005 to 2300, to a historical simulation, covering the simulation period from 1850 to 2005. In RCP 8.5, the OHT declines by 30–50 % in comparison to the historical simulation in the North Atlantic by the end of the 23rd century. The decline in the OHT is accompanied by a change in the seasonal cycle of the total OHT and its components. We decompose the OHT into overturning and gyre component. For the OHT seasonal cycle, we find a northward shift of 5◦and latitude-dependent shifts between 1 and 6 months that are mainly associated with changes in the meridional velocity field. We find that the changes in the OHT seasonal cycle predominantly result from changes in the wind-driven surface circulation, which projects onto the overturning component of the OHT in the tropical and subtropical North Atlantic. This leads in turn to latitude-dependent shifts between 1 and 6 months in the overturning component. In comparison to the historical simulation, in the subpolar North Atlantic, in RCP 8.5 we find a reduction of the North Atlantic Deep Water formation and changes in the gyre heat transport result in a strongly weakened seasonal cycle with a weakened amplitude by the end of the 23rd century.
1 Introduction
Global surface temperatures are projected to warm – depend- ing on the considered climate change scenario – intensively over the next centuries (IPCC, 2013), accompanied by a pro- jected shift in the amplitude and phase of the seasonal cycle of surface air temperatures (Dwyer et al., 2012). In concert, the Atlantic meridional overturning circulation (AMOC) is projected to slow down (Weaver et al., 2012; IPCC, 2013), which can be attributed to a reduction of deep water forma- tion in the North Atlantic, especially in the Labrador Sea and Greenland Sea (Vellinga and Wood, 2002). The associated Atlantic Ocean meridional heat transport (OHT) is also ex- pected to weaken due to the direct linear relation of AMOC
and OHT found in observations and model studies (Johns et al., 2011; Msadek et al., 2013). However, it is unclear how climate change along with a projected shift in the seasonal cycle of surface temperatures affects the seasonal cycle of the ocean circulation, and especially of the OHT. Here, we inves- tigate projected changes in the OHT seasonal cycle in a Cou- pled Model Intercomparison Project Phase 5 (CMIP5) cli- mate projection (Taylor et al., 2012) performed in the global coupled Max Planck Institute Earth System Model (MPI- ESM). In the CMIP5 Representative Concentration Pathway (RCP) RCP 8.5, surface air temperatures are projected to in- crease by about 8◦C in the global mean by the year 2300 in the CMIP5 multi-model ensemble (IPCC, 2013). The warm-
ing manifests itself over the continents and in particular in polar regions where an increase in surface temperatures of more than 20◦C arises in climate projections until 2300 (e.g.
IPCC, 2013; Bintanja and Van der Linden, 2013). Due to the strong warming in polar latitudes, the meridional tempera- ture gradient from the equator to the poles is also strongly reduced in the Northern Hemisphere. The atmospheric cir- culation patterns are projected to move poleward in concert with the increase in surface temperature, leading to a pole- ward expansion of the tropical cell and an associated pole- ward shift of the jet stream (Chang et al., 2012; Hu et al., 2013; IPCC, 2013), while the response of the storm track ex- hibits a more complex pattern (Zappa et al., 2013). A warmer planet has been shown to lead to an expansion of the Hadley cell and a poleward shift of the westerlies in both dynam- ical core (Butler et al., 2010) and complex climate models (Lu et al., 2008), following a systematically warmer Northern Hemisphere (e.g. Toggweiler, 2009). Under global warming, the hemispheric temperature asymmetry increases, leading to an additional northward shift of the intertropical convergence zone (ITCZ) and the position of the westerlies. A number of mechanisms have been proposed for the shift of the Hadley circulation and the westerlies (Lu et al., 2014, and references therein).
In contrast to the general warming, the surface air tem- peratures show a prominent area of reduced warming over the North Atlantic subpolar gyre (SPG) in the set of CMIP5 climate projections that might be associated with an adjust- ment of the Atlantic meridional overturning circulation (Dri- jfhout et al., 2012) and/or a reduction of the OHT into the SPG (e.g. Rahmstorf et al., 2015). These changes in the sur- face temperature patterns thus suggest considerable changes in the North Atlantic Ocean circulation, the AMOC and the associated OHT.
The implications of the Atlantic Ocean circulation and the OHT for the North Atlantic sector and the European climate have been widely discussed. The AMOC and OHT in the North Atlantic have been shown to affect the North Atlantic heat content and the North Atlantic sea surface temperatures (SSTs; e.g. Dong and Sutton, 2003; Grist et al., 2010; Son- newald et al., 2013; Muir and Fedorov, 2014). Changes in the North Atlantic SSTs and the air–sea interaction appear to be important for influencing the atmospheric circulation, the multi-decadal variability of the North Atlantic sector, and the North American and European climate on interannual to multi-decadal timescales (e.g. Rodwell et al., 2004; Sutton and Hodson, 2005; Gastineau and Frankignoul, 2015).
Furthermore, a response of the North Atlantic Oscillation (NAO) to North Atlantic SSTs has been found both in ob- servations and model studies (Czaja and Frankignoul, 1999, 2002; Rodwell and Folland, 2002; Frankignoul et al., 2013;
Gastineau et al., 2013; Gastineau and Frankignoul, 2015).
Via the Atlantic Multidecadal Oscillation (AMO), which is thought to be associated with AMOC and OHT variability (e.g. Delworth and Greatbatch, 2000; Knight et al., 2005;
Msadek and Frankignoul, 2009; Zhang and Wang, 2013), the SST variability has been linked to a number of climate phenomena, such as Sahel rainfall, Atlantic hurricane activ- ity, and North American and European summer climate (En- field et al., 2001; Sutton and Hodson, 2005; Knight et al., 2006; Zhang and Delworth, 2006; Sutton and Dong, 2012).
Recently, Clement et al. (2015) reported that the AMO can be reproduced in an atmospheric circulation model coupled to a slab ocean without changes in the ocean circulation and heat transport. They showed in their model that the AMO is a response to the atmospheric circulation in the mid-latitudes rather than to internal ocean dynamics. However, the specific role and direct importance of the OHT for European climate is still controversially discussed and the exact mechanism is not fully understood (e.g. Bryden, 1993; Seager et al., 2002;
Rhines et al., 2008; Riser and Lozier, 2013). The seasonal coupling between ocean and atmosphere is less understood.
Minobe et al. (2010) have shown an atmospheric response to Gulf Stream variability with seasonal variations. When also considering the impact of seasonal variations in the total OHT on European climate, the relation becomes even more complex and thus requires a better understanding of the OHT and its coupling to the atmosphere.
Most of the present understanding stems from model anal- ysis due to a lack of continuous observations. These observa- tions of the OHT rely on hydrographic snapshots (e.g. Bryan, 1962; Hall and Bryden, 1982; Lavin et al., 1998; Lumpkin and Speer, 2007) or inverse methods (e.g. Macdonald and Wunsch, 1996; Ganachaud and Wunsch, 2000, 2003) and give estimates of the time-mean OHT of about 1 PW at its maximum at about 20◦N, but they do not describe the OHT variability (see also Wunsch, 2005). Furthermore, single hy- drographic snapshots may be affected by a seasonal bias due to the predominance of field work during summer. Recently, the two time series of the 26◦N rapid array and observations at 41◦N have indicated interannual variability and a clear seasonal cycle of the OHT in the North Atlantic (Johns et al., 2011; Hobbs and Willis, 2012).
Model studies led to a better understanding of the dynam- ics of the seasonal cycle of the OHT. The pioneering study by Bryan (1982a) used a global ocean circulation model forced with observed winds. Bryan pointed out the impor- tance of the wind-driven Ekman mass transport and of the as- sociated Ekman heat transport for driving the seasonal vari- ability of the OHT, which was also found in subsequent studies (Sarmiento, 1986; Lee and Marotzke, 1998; Jayne and Marotzke, 2001; Böning et al., 2001; Cabanes et al., 2008; Balan Sarojini et al., 2011; Munoz et al., 2011). Bryan (1982a) argued that changes in the zonally integrated wind stress, leading to changes in the Ekman mass transport, are balanced by a barotropic return flow. Jayne and Marotzke (2001) provided the theoretical and dynamical justification for Bryan’s argumentation, stressing again the important role of the Ekman transport in the seasonal cycle of the OHT.
Traditionally, the OHT is decomposed into a vertical over- turning component, which is commonly linked to the merid- ional overturning circulation, and a horizontal gyre compo- nent giving correlations between the zonal deviations of the velocity and temperature field (Bryan, 1962, 1982b; Bryden and Imawaki, 2001; Siedler et al., 2013). The gyre compo- nent is commonly linked to the horizontal gyre circulation and contributions from the eddy field. Previous studies have shown that the overturning component dominates the time mean, as well as the inter-decadal variability of the OHT in the tropical and subtropical North Atlantic, whereas the over- turning and gyre components contribute about equally to the OHT and its inter-decadal variability in the subpolar North Atlantic (e.g. Eden and Jung, 2001).
With this study, we aim to understand how the seasonal cy- cle of the Atlantic Ocean meridional heat transport is affected by global warming and what determines potential changes in the OHT seasonal cycle. For our analysis, we use a CMIP5 climate change projection performed in MPI-ESM, with a fo- cus on the climate change scenario RCP 8.5. We aim to iden- tify changes in the seasonal cycle of OHT and its sources.
To analyse different physical mechanisms that contribute to the changes in the seasonal cycle, we analyse the individ- ual contributions to the total OHT on seasonal timescales.
Therefore, we decompose the OHT into gyre and overturn- ing components, related to the horizontal gyre circulation and to the overturning circulation in the North Atlantic, and we consider changes in the wind-driven Ekman heat transport.
2 Model and methods
2.1 The CMIP5 climate change scenario RCP 8.5 in MPI-ESM
We analyse climate projection experiments of the CMIP5 en- semble (Taylor et al., 2012) performed in the coupled Max Planck Institute Earth System model in low-resolution con- figuration (MPI-ESM-LR) integrated from 1850 to 2300.
MPI-ESM-LR comprises the Max Planck Institute Ocean Model (MPIOM) for the ocean component and the atmo- spheric general circulation model ECHAM6 for the atmo- spheric component (Marsland et al., 2003; Jungclaus et al., 2013; Stevens et al., 2013). In MPIOM, the horizontal resolu- tion is 1.5◦on average, with 40 unevenly spaced vertical lev- els (Marsland et al., 2003; Jungclaus et al., 2013). ECHAM6 has a horizontal resolution of T63 and includes 47 vertical levels (Stevens et al., 2013).
For our analysis, we focus on one member in the CMIP5 ensemble and use the historical simulation (1850–2005) ex- tended with the RCP 8.5 from 2006 to 2300. In RCP 8.5, a rising radiative forcing following “business as usual” is ap- plied, which rises to 8.5 W m−2in the year 2100 and further stabilises after that (van Vuuren et al., 2011). We focus in this study on long-term changes in RCP 8.5, comparing the pe- riod 1850–1950 for the historical simulation (HISTmean) to
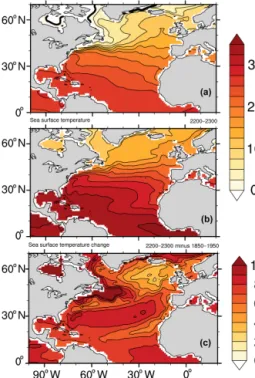
Figure 1.Sea surface temperature (◦C) in(a)the historical sim- ulation (1850–1950),(b)RCP 8.5 (2200–2300) for the time mean and(c)difference between RCP 8.5 and the historical simulation.
Contour interval is 2.5◦in(a)and(b)and 1◦C in(c).
the period 2200–2300 for the RCP 8.5 scenario (RCPmean), where we expect the strongest changes in the North Atlantic Ocean circulation and in the seasonal cycle of the OHT.
2.1.1 Projected changes in the North Atlantic sea surface temperatures
In concert with the projected warming of surface air tem- peratures, the SSTs are projected to rise globally and also in the North Atlantic sector in RCP 8.5 (Fig. 1). A similar
“warming hole” signature as found for surface air tempera- tures (see Drijfhout et al., 2012) is present in the North At- lantic SSTs (Fig. 1), with a stronger warming in polar regions and an area of reduced warming in the SPG (Fig. 1c). Pro- nounced regional variations in the SST change suggest im- portant changes in the North Atlantic Ocean circulation and its dynamics. The SST front along the Gulf Stream–North Atlantic current path shifts northward and weakens, which might also impact the North Atlantic storm track, as already shown for the current climate state (e.g. Minobe et al., 2008, 2010; Hand et al., 2014).
2.1.2 Projected changes in the North Atlantic horizontal gyre circulation and zonal-mean zonal wind The area of reduced warming in the eastern SPG indicates changes in the North Atlantic Ocean dynamics and in the gyre circulation (e.g. Drijfhout et al., 2012). The North At-
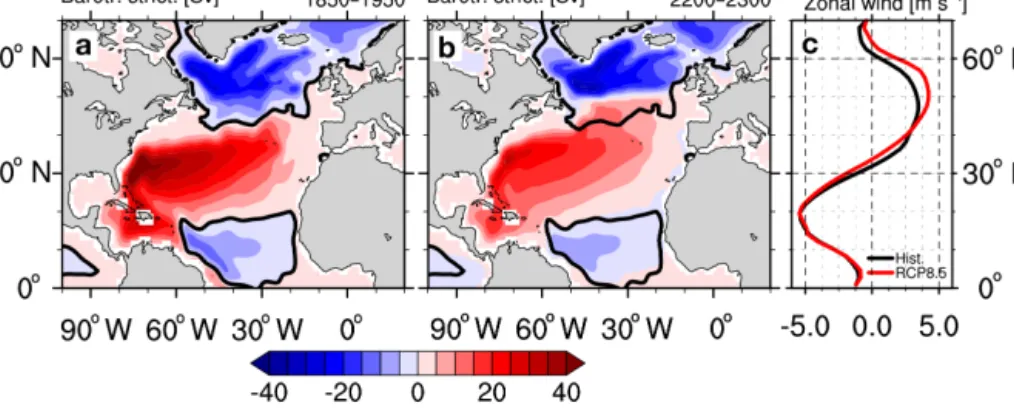
Figure 2.The barotropic stream function (Sv=106m3s−1) in(a)the historical simulation (1850–1950) and(b)RCP 8.5 (2200–2300) for the time mean over the respective periods. The thick black line shows the zero contour in the historical simulation. Contour interval is 5 Sv.
(c)Zonal mean zonal wind (at 1000 hPa) averaged over the North Atlantic region (90◦W to 10◦E) for the historical simulation (black) and RCP 8.5 (red), indicating the northward shift of the westerlies.
lantic barotropic stream function shows substantial changes in the annual mean pattern (Fig. 2). The barotropic stream function weakens in the subtropical gyre and intensifies in the SPG in RCP 8.5. We identify a northward shift of the subtropical gyre and a northward shift of the boundary be- tween subtropical and subpolar gyre by about 5◦between the HISTmean(Fig. 2a) and RCPmean (Fig. 2b) associated with the northward shift of the atmospheric wind field (Fig. 2c).
The zonal-mean zonal wind across the Atlantic indicates considerable changes in the annual mean surface wind field in RCP 8.5 (Figs. 2c, 3). As compared to the HISTmean, the northern Hadley cell slightly expands poleward and equator- ward and the Ferrel cell shifts poleward in RCPmeanin MPI- ESM (Fig. 3a) as in most CMIP5 models (e.g. Hu et al., 2013). As a consequence, the westerlies between 30 and 60◦N are shifted poleward in RCP 8.5 by about 5◦(Fig. 3b, c). This shift resembles the wind pattern observed during a positive NAO anomaly (as defined from pre-industrial con- trol, while the loading pattern may change considerably with climate change; Ning and Bradley, 2016), which is associ- ated with an acceleration of the westerlies over large areas of the SPG (Fig. 3b, c), along with a deceleration of the wester- lies between 30 and 40◦N and a slight intensification of the trade winds south of 30◦N.
In concert with this intensification of the surface wind field, the circulation of the SPG strengthens with an increase in the average transport by about 2 Sv, which might be related to changes in heat fluxes in the SPG (e.g. Eden and Wille- brand, 2001; Eden and Jung, 2001; Barrier et al., 2014). In particular, the flat-bottom Sverdrup transport in the subpolar gyre indicates only a weak increase of about 0.5 Sv in the gyre strength from HISTmeanto RCPmean(not shown), sug- gesting that changes in the deep circulation might also be im- portant (Greatbatch et al., 1991). The subtropical gyre shows a weakening in the barotropic stream function by about 20 Sv at its maximum at about 30◦N and by about 4 Sv in its mean, indicating important changes in the dynamics of the subtrop-
Figure 3.(a)The (global) Eulerian mean mass transport stream function (in 1010kg s−1with zonal averaging at fixed pressure) for the historical simulation (1850–1950, black contours) and RCP 8.5 (2200–2300, red contours) between 20◦S and 80◦N.(b)Vertical profile of the zonal-mean zonal wind (m s−1) over the North At- lantic averaged from 10◦E to 90◦W in the historical simulation (1850–1950, black contours) and RCP 8.5 (2200–2300, colours) for the time mean over the respective periods.(c)The difference in the zonal-mean zonal wind between RCP 8.5 and the historical simula- tion. Contour interval is 2×10¹⁰kg s−1in(a), 1 m s−1in(b)and 0.5 m s−1in(c).
ical gyre (Fig. 2). Considering the Sverdrup transport in the subtropical gyre, we find a decrease in the mean by about 1.5 Sv, while the maximum is reduced by roughly 10 Sv. In concert with the northward shift of the ocean circulation in RCP 8.5, the North Atlantic current moves further north in RCP 8.5. This leads to the simulated changes in the SST front (Fig. 1).
2.2 The Atlantic meridional heat transport and its decomposition
Traditionally, the meridional heat transport His diagnosed from the zonal and vertical integral of the heat flux across an east–west section through the Atlantic (e.g. Hall and Bryden, 1982):
H(y)=ρ0cp xE
Z
xW
0
Z
−H(x,y)
v(x, y, z)θ(x, y, z) dzdx, (1)
withρ0a reference density,cpthe specific heat capacity of sea water,H the water depth,xthe longitude,ythe latitude, zthe depth,xEandxW the eastern and western boundaries of the transect,vthe meridional velocity, andθthe potential temperature in◦C.
2.2.1 Impact of the variability of the temperature and velocity field on the OHT
In order to assess the impact of temporal variations on the velocity field and the potential temperature field, we separate their contributions to the OHT. In a first step we calculate the OHT with a time-mean velocity field ([v], Eq. 2), and in a second step with a time-mean temperature field ([θ], Eq. 3) over the analysed periods HISTmeanand RCPmean. We con- sider the time mean of thev- (θ-) field but consider the full spatial variations of the respective field together with the full spatial and temporal variability of theθ- (v-) field, such that the two contributions can be calculated from
H[v](y)=ρ0cp xE
Z
xW
0
Z
−H(x,y,z)
v(x, y, z)
θ(x, y, z, t) dzdx (2)
H[θ](y)=ρ0cp xE
Z
xW
0
Z
−H(x,y,z)
v(x, y, z, t)
θ(x, y, z)
dzdx, (3)
with v the meridional velocity, θ the temperature, and[v] and[θ]the time mean of the velocity and temperature (◦C) field over the analysed periods HISTmeanand RCPmean. The two cases correspond to the time-mean velocity field, ad- vecting the time-dependent temperature field and the time- dependent velocity field acting on the time-mean tempera- ture field. Based on this split-up of the OHT we then analyse the impact of the variability of the velocity and temperature field on the seasonal cycle of the OHT.
2.2.2 Overturning and gyre components of the OHT The decomposition of the OHT into contributions from the zonal mean vertical circulation and the horizontal circula- tion is well-established by considering the zonal mean (v, θ) and deviations from the zonal mean (v0, θ0) of the meridional velocity and temperature field respectively:v=v+v0 and θ=θ+θ0 (e.g. Bryan, 1962, 1982b; Bryden and Imawaki, 2001). This yields for the OHT
H(y)=ρ0cp xE
Z
xW
0
Z
−H(x,y)
v(x, y, z)θ(x, y, z) dzdx
| {z }
Hov=overturning component
+ρ0cp
xE
Z
xW
0
Z
−H(x,y)
v0(x, y, z)θ0(x, y, z) dzdx
| {z }
Hgyre=gyre component
, (4)
giving an overturning componentHovand a gyre component Hgyrefrom the horizontal gyre circulation. As the total OHT, both components hold mass balance by definition for a closed basin. Traditionally, the overturning component is related to the zonally averaged vertical-meridional (overturning) circu- lation and the gyre component is related to the horizontal transport by the large-scale gyres and small-scale eddies.
Furthermore, an Ekman heat transport contribution to the overturning heat transport can be calculated from
Hovek(y)= −cp
xE
Z
xW
τx(x, y)
f(y) (θek(x, y)− hθ(x, y, z)i) dx, (5)
withτx the zonal wind stress,f the Coriolis parameter,hθi the temperature field averaged zonally and vertically across the section, andθekthe temperature of the Ekman layer fol- lowing Böning and Hermann (1994). Here, the Ekman heat transport at the surface is assumed to be compensated for by a deep return flow. We also assume θek to be close to the surface temperature, which yields only small uncertainties (Johns et al., 2011). Williams et al. (2014) analysed contribu- tions from the overturning, gyre and Ekman heat transport to the heat convergence in the North Atlantic for decadal signals based on perturbation experiments with and without wind.
Thus, they avoided the assumption of a uniform return flow as done in Eq. (5). Jayne and Marotzke (2001) showed that the computation of the Ekman heat transport conserves mass only for short timescales of some weeks, but not necessar- ily for the time-mean heat transport. Therefore, we apply the Ekman transport calculation only to the OHT seasonal vari- ability and not to the time-mean OHT.
3 Mean changes in the Atlantic meridional overturning circulation and meridional heat transport
3.1 AMOC
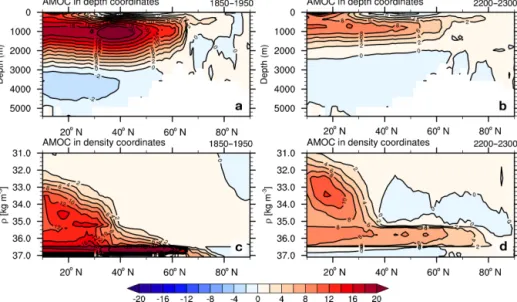
The mean changes seen in the SSTs, the surface wind field and in the North Atlantic Ocean circulation influence the AMOC and the OHT, which we focus on in the remainder of the study. The AMOC shows significant changes in the time mean from HISTmeanto RCPmean(Fig. 4). The AMOC cal- culated in depth coordinates shows that the northward over- turning cell is reduced in strength and becomes shallower from the HISTmeanto RCPmean(Fig. 4a, b). The maximum ψmaxof the stream functionψ(y, z)=
0
R
z xE
R
xW
v(x, y, z) dxdz, commonly used as an index for the AMOC, is substantially reduced between 30 and 50 % in the North Atlantic from HISTmeanto RCPmean(Figs. 4a, b, 5a).
Considering the AMOC in density coordinates (Fig. 4c, d) indicates a similar shoaling of the AMOC cell to layers of lower density from HISTmean to RCPmean (Fig. 4c, d). We find only a slight decrease in the wind-driven surface cell (down to approximately 1000 m) in the tropics by about 2 Sv at the maximum, whereas the deep thermohaline cell is re- duced by more than 50 % from a maximum of about 24 Sv in HISTmeanto about 10 Sv in RCPmean; this is consistent with the widely held picture that the AMOC consists of both a wind-driven and a thermohaline part (e.g. Kuhlbrodt et al., 2007). In RCP 8.5, the formation of North Atlantic Deep Water (NADW) in the Labrador Sea and the Nordic seas is almost absent for the 2200–2300 period. Instead of deep convection mixing surface water down to the bottom (about 3000 m depth in the Labrador Basin and Irminger Basin) in the historical simulation, the maximum mixed layer depth is mostly limited to the upper 1000 m in RCP 8.5 (not shown), which thus directly reduces the deep branch of the AMOC.
In addition, the AMOC’s weakening is associated with a re- duction of the geostrophic volume transport (Fig. 5a). For simplicity, we approximate the maximum geostrophic trans- port ψgeo by the residual of ψmax and the Ekman trans- port ψek given by theψek= − 1
ρ0f xE
R
xW
τxdx, withτx as the zonal wind stress at the ocean surface: ψgeo≈ψmax−ψek. The geostrophic transport is proportional to the zonal cross- basin density gradient which is decreased from HISTmeanto RCPmeanand thus reduces the AMOC in the North Atlantic (not shown). The Ekman transport indicates only small and local changes from HISTmean to RCPmean that do not con- tribute notably to the weakening of the AMOC (Fig. 5a).
3.2 OHT
Similar to the AMOC, the RCP 8.5 scenario reveals consider- able changes in the associated OHT. For RCPmean, the OHT
shows a pronounced weakening by 30–50 % from about 1.2 PW to about 0.8 PW between 10 and 30◦N and from about 0.8 PW to about 0.4 PW between 40 and 55◦N by the end of the 23rd century (Fig. 5b). The reduction in the to- tal OHT in the subtropical North Atlantic can be attributed almost entirely to a reduction in the overturning heat trans- port, while changes in the gyre component are comparably small. Only in the SPG, the gyre component also indicates a substantial weakening, so that both the overturning and the gyre components contribute to the reduction in the total heat transport in the subpolar North Atlantic. The reduction of the overturning heat transport can be attributed to a reduction of the geostrophic contribution to the AMOC (Fig. 5a) and the associated reduction of the zonally averaged geostrophic meridional velocity field.
4 Changes in the seasonal cycle of the Atlantic meridional heat transport
4.1 The total OHT
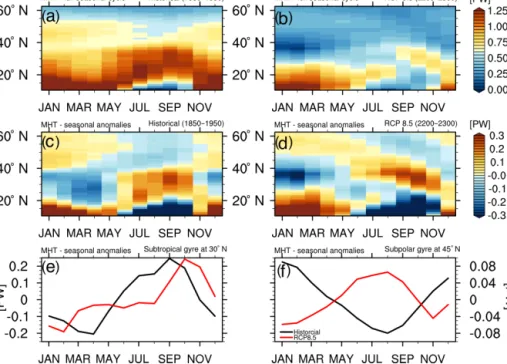
To assess the response of the seasonal cycle of the OHT to a changing climate in RCP 8.5, we first analyse the latitude- dependent seasonal cycle of the total OHT before focusing on the seasonal cycle of individual OHT components. The seasonal cycle of the OHT shows regionally varying patterns with a seasonal amplitude declining from the equator to the pole and phase changes between the tropical, subtropical and subpolar North Atlantic (Fig. 6). The most obvious change in the OHT from the HISTmean to the RCPmean is the re- duction of the mean heat transport, which appears in almost all months (Fig. 6a, b). Since the changed seasonal cycle is superimposed on the strong reduction of the OHT, we con- sider in the following analysis anomalies of the seasonal cy- cle relative to the annual mean at every latitude (Fig. 6c, d) to thus highlight the seasonally varying changes.
The seasonal anomalies indicate changes in space and time in the OHT seasonal cycle from the HISTmean to the RCPmean(Fig. 6c, d). The OHT seasonal cycle pattern shows a northward shift by about 5◦following the general north- ward shift of the atmospheric jet and the gyre circulation in RCP 8.5. We also find a latitude-dependent temporal shift of 1 to 6 months of the minima and maxima of the seasonal cy- cle that are not fully in agreement with the northward shift of the pattern. The temporal shift appears to be different be- tween the tropical, subtropical and subpolar North Atlantic.
Especially latitudes along the gyre boundaries between the tropical and subtropical North Atlantic (at about 20◦N) and the subtropical and subpolar North Atlantic (at about 40◦N) indicate significant phase shifts of 4 to 6 months that mostly result from the northward shift here.
In addition, we find changes in the seasonal amplitude in RCPmean, which also depend on latitude and are partly in- fluenced by the northward shift. Between 30 and 40◦N, the seasonal cycle generally exhibits an intensification in the am-
Figure 4.(a)and(b)show the AMOC in depth coordinates.(c)and(d)show the AMOC in density coordinates in the North Atlantic.(a) and(c)show the historical simulation (1850–1950) and(b)and(d)show RCP 8.5 (2200–2300). Contour interval is 2 Sv.
Figure 5.(a)Time-mean Atlantic meridional overturning circulation, the Ekman transport and the geostrophic volume transport (≈AMOC–
Ekman),(b)time-mean Atlantic meridional heat transport (OHT) with the overturning component and the gyre component (in PW). The historical simulation (1850–1950) is shown by solid lines, RCP 8.5 (2200–2300) by dashed lines.
plitude, whereas the seasonal amplitude between 40–50◦N is influenced mostly by the northward shift. As an example for the subtropical and subpolar gyre, the OHT seasonal cycle is shown at 30 and 45◦N from the HISTmeanto the RCPmean
(Fig. 6e–f), showing prominent changes in the amplitude, the phase and the general seasonality of the OHT.
4.1.1 Contributions from the seasonal variability in the temperature and velocity field
To identify whether changes in the seasonal cycle of the ve- locity field or in the temperature field dominate the changes seen in the total OHT, we consider the OHT with a time- mean velocity field[v](Eq. 2) allowing for temporal and sea- sonal variability in the potential temperature field and a time- mean temperature field[θ]allowing for temporal variability in the velocity field (Eq. 3). Thus, the non-time-mean compo- nent provides the seasonal variability only. The OHT based on[v](Fig. 7a, b) reveals a reduced seasonality compared to the full OHT seasonal variability, especially in the tropical and subtropical North Atlantic. The changes in the seasonal cycle from the HISTmean to the RCPmean are rather small.
The OHT based on[θ](Fig. 7c, d) reproduces the bulk of the total OHT seasonal cycle and also the changes in the seasonal cycle from the HISTmeanto the RCPmean. This clearly indi- cates that the strongest changes in the OHT seasonal cycle mostly result from changes in the meridional velocity field, whereas the overall warming of the ocean temperatures plays a less important role in directly changing the OHT seasonal cycle via the temperature field.
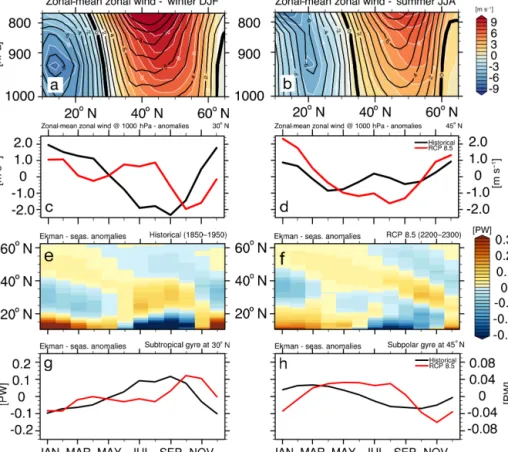
4.1.2 Zonal-mean zonal wind and Ekman heat transport The seasonal cycle of the zonal-mean zonal wind indicates a seasonal maximum of the atmospheric westerly jet in winter and meridional shifts in the position of the jet from summer to winter in the HISTmean(Fig. 8; shown is the full zonal- mean zonal velocity field). Especially in the tropical Atlantic, the seasonality of the wind field is strongly affected by the seasonal migration of the ITCZ (e.g. Schneider et al., 2014).
Between the HISTmeanand RCPmeanthe zonal wind under- goes changes in amplitude and position of the jet with asso- ciated temporal changes in the seasonal cycle (Fig. 8a, b; see Lu et al., 2014). We found a seasonally dependent shift and
Figure 6.The Atlantic meridional heat transport seasonal cycle (in PW) in the historical simulation (1850–1950,(a)and(c)) and RCP 8.5 (2200–2300,(b)and(d)). The OHT seasonal cycle in the historical simulation (1850–1950, black) and RCP 8.5 (2200–2300, red)(e)at 30◦N in the subtropical gyre and(f)at 45◦N in the subpolar gyre.(a)and(b)show the full seasonal cycle and(c)–(f)show anomalies relative to the annual mean at every latitude. Colour interval in(a)–(d)is 0.02 PW.
Figure 7.The Atlantic meridional heat transport seasonal cycle (in PW) in the historical simulation (1850–1950,(a)and(c)) and RCP 8.5 (2200–2300,(b)and(d)) related to the variability in the temperature field (upper panels) and to variability in the velocity field (lower panels).
Shown are anomalies relative to the annual mean at every latitude. Colour interval is 0.02 PW.
expansion of the Hadley cell and a northward shift of the Fer- rel cell. During winter, the westerlies are shifted northward by about 5◦from the HISTmeanto the RCPmean. In contrast to the changes in winter, we found a general broadening of the westerlies during summer in the RCPmean, corresponding to a southward shift of the trade wind regime by about 2◦and a poleward shift of the maximum westerlies for the RCPmean (Fig. 8a, b). Changes in the zonal wind during summer lead to reduced easterly winds over the subtropical gyre, reduced
westerlies between 40 and 50◦N, and enhanced westerlies north of 50◦N (Fig. 8a, b).
The seasonal cycle of the Ekman heat transport indicates a weakening in the seasonal cycle in the tropical North At- lantic, with a decrease in the seasonal amplitude by about 50 % from the HISTmean to the RCPmean (Fig. 8e–h). In the subtropical gyre, we find a dominant influence of the northward-shifted westerlies on the Ekman heat transport.
The Ekman heat transport in the SPG shows – in contrast to the subtropical gyre – relatively small changes in terms of the
Figure 8.The zonal-mean zonal wind (ms−1) over the North Atlantic averaged from 10◦E to 90◦W and the associated Ekman heat transport seasonal cycle (PW).(a–b)Vertical profile of the zonal wind for historical conditions (1850–1950, black contours) and RCP 8.5 (2200–2300).
Contour interval in(a)and(b)is 1 m s−1.(c–d)Seasonal cycle of the surface wind at 30 and 45◦N for historical conditions (1850–1950, black) and RCP 8.5 (2200–2300, red).(e–f)Seasonal cycle of the Ekman heat transport (in PW) in the historical simulation (1850–1950, left panel) and RCP 8.5 (2200–2300, right panel).(g–h)Seasonal cycle of the Ekman heat transport at 30 and 45◦N for historical conditions (1850–1950, black) and RCP 8.5 (2200–2300, red). Shown are anomalies relative to the annual mean at every latitude. Contour interval in (e)and(f)is 0.02 PW. Please note the different vertical axes in(c),(d)and(g),(h).
amplitude, resulting in a slight strengthening in summer and a weakening in winter (Fig. 8e, f). As an example, the Ek- man heat transport seasonal cycle is shown at 30 and 45◦N (Fig. 8g, h), indicating the influence of the northward-shifted pattern.
The changes in the seasonal amplitude of the Ekman heat transport come in concert with a temporal shift of the sea- sonal minima and maxima (Fig. 8e–h). The Ekman heat transport in the tropical North Atlantic undergoes a 1-to-2- month temporal shift to later months. In the southern part of the subtropical gyre (about 20–30◦N), we find the largest temporal shift of the seasonal maximum and minimum of 2–
6 months to later months (Fig. 8e). In the northern part, the maximum is shifted by 1–2 months, as is the minimum. The subpolar gyre region shows only small changes in the Ekman heat transport seasonal cycle (1–2 months), while a latitude- dependent larger shift of about 5 months is identified for the maximum at about 40◦N due to the northward shift of the pattern along the gyre boundary (e.g. Fig. 8f). Overall, the seasonal cycle of the Ekman heat transport changes depend-
ing on latitude, closely following the changes in the seasonal cycle of the surface wind.
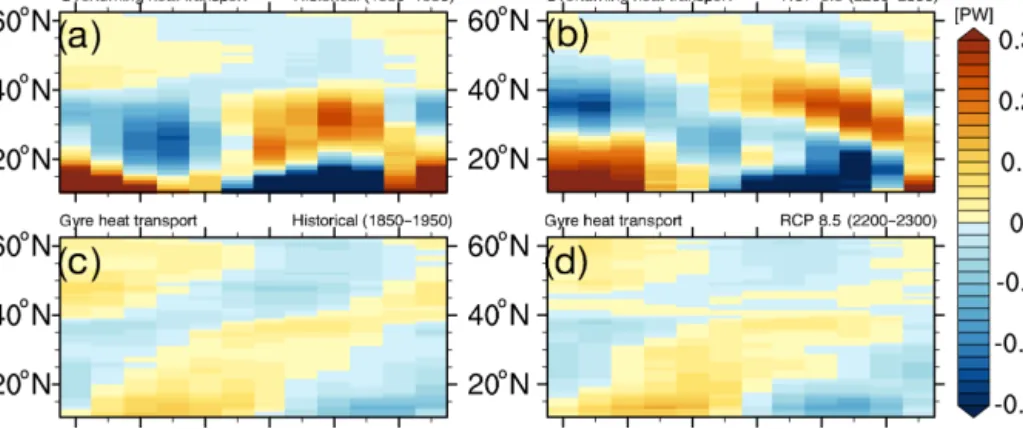
4.1.3 Overturning and gyre heat transport
The overturning and gyre components similarly show for the time mean and long-term variability that the overturning component dominates the OHT seasonal cycle in the sub- tropical North Atlantic (Fig. 9a, b), while the gyre compo- nent gains influence in the subpolar gyre (Fig. 9c, d). The changes in the seasonal cycle of the overturning component from the HISTmeanto the RCPmeantherefore reveal clear sim- ilarities to the changes in the seasonal cycle of the total OHT (Fig. 6). We found a similar northward shift of the seasonal cycle pattern by about 5◦– suggesting a relation to the sur- face wind field – and comparable changes to the OHT in the seasonal amplitude, with a 2-to-4-month shift of the mini- mum and maximum in the subtropical gyre and up to a 6- month shift in the subpolar gyre. This close relation shows that changes in the seasonal cycle of the overturning compo- nent drive the changes in the seasonal cycle of the total OHT
in both the subtropical and subpolar gyre (Fig. 8a, b). Sim- ilarly, changes in the amplitude of the seasonal cycle of the overturning component result in changes in the amplitude of the seasonal cycle of the total OHT, with a reduction in the seasonal amplitude in the tropics and a slight increase in the seasonal amplitude between 30 and 45◦N.
In RCPmean (Fig. 9c, d), the gyre component reveals a slight intensification of the seasonal amplitude in tropical latitudes, while no notable changes in the seasonal ampli- tude occur in the subtropical and subpolar gyre. Important changes for the gyre component’s seasonal cycle take place at about 40◦N, where the gyre boundary is situated in the model. We find a northward shift in the seasonal cycle pat- tern in the subpolar gyre following the northward shift in the barotropic stream function and the zonal-mean zonal wind (Fig. 2), with the seasonal cycle in the subpolar gyre covering latitudes north of 40◦N in the HISTmean, while the seasonal cycle covers latitudes north of 45◦N in the RCPmean(Fig. 9c, d).
The comparison of the changes in the OHT, the overturn- ing component (Fig. 8a, b) and the Ekman heat transport re- veals that changes in the Ekman heat transport (Fig. 8e, f) can explain a large part of the changes in the seasonal cy- cle of the OHT and overturning component: on the one hand by the contribution of Ekman heat transport’s seasonal cycle to the overturning component and on the other hand, the ef- fects from wind stress on the vertical motion (heaving and shoaling) of isopycnals shown in earlier studies (Köhl, 2005;
Chidichimo et al., 2010; Kanzow et al., 2010). Thereby, the surface wind stress might change the interior geostrophic flow and hence the heat transport and its variability. Note that between 30 and 40◦N, the Ekman transport change alone cannot explain the changes in the seasonal cycle of the OHT, though these latitudes are strongly influenced by changes in the mean strength of the North Atlantic Deep Water (Ap- pendix A). Overall, changes in the seasonal cycle are pre- dominantly driven by changes in the ocean’s surface and up- per ocean, as also found in the seasonal cycle of the tempera- ture transport in potential density coordinates (Appendix A), indicating predominantly changes in the surface and upper ocean circulation.
5 Discussion
The changes in the mean climate state of the North Atlantic and a projected reduction in the AMOC and OHT in the MPI-ESM come in concert with changes in the seasonal cy- cle of the OHT. Bryan (1982a) and subsequent studies have shown that the Ekman heat transport is responsible for a large fraction of the seasonal variability of the overturning heat transport and thus of the total oceanic OHT. We have shown that under climate change the overturning heat transport is the most important term leading to the changes in the OHT seasonal cycle. These changes in the overturning heat trans-
port are mostly wind-driven via changes in the Ekman heat transport, which are mostly confined to the upper layers of the ocean. These overturning heat transport changes might also be associated with changes in the geostrophic interior flow from wind-driven heaving and shoaling of the isopycnal slope, as shown for the AMOC seasonal cycle in observa- tions (Kanzow et al., 2010), as well as with changes in the water mass characteristics (Appendix A). Changes in the Ek- man transport and the associated vertical Ekman velocities change the isopycnal slope and thus the geostrophic velocity field. Overall, the seasonal cycle of the OHT largely adjusts to a changed seasonality of the atmospheric circulation and the zonal wind in RCP 8.5. Similar changes in the seasonal cycle for extreme climate change scenarios have also been found in other atmospheric variables such as surface temper- atures and precipitation (Dwyer et al., 2012; Donohoe and Battisti, 2013; Dwyer et al., 2014).
Most prominent among the atmospheric changes with cli- mate change is the expansion of the Hadley cell and the asso- ciated northward shift of the ITCZ and the mid-latitude west- erlies (Sun et al., 2013; Lu et al., 2014). However, the exact mechanism leading to the shift of the ITCZ and the wester- lies is still not fully understood and remains under discussion (Seidel et al., 2008), especially in CMIP5 models where the problem of a double ITCZ occurs in some models (Hwang and Frierson, 2013; Christensen et al., 2013). As shown by Hu et al. (2013), almost all CMIP5 models show a poleward expansion of the Hadley cell in the RCP 4.5 and RCP 8.5 scenarios for the period 2006 to 2100. Hu et al. (2013) also show that the CMIP5 historical simulations underestimate the trend in the poleward expansion of the Hadley cell repre- sented by reanalysis data for the preceding decades, although it is unclear whether the trend is anthropogenically forced or whether the models capture the natural variability and extent of the Hadley cell correctly.
Furthermore, changes in the surface winds and wind stress may be model dependent and may differ in detail, i.e. some models do not project a northward shift of the westerlies di- rectly at the surface and therefore in the associated surface wind stress. Thus, the proposed mechanism for changes in the seasonal cycle of the oceanic OHT by the Ekman heat transport and the associated changes in the geostrophic ve- locity field might differ between individual models used for the CMIP5 multi-model ensemble and might require a simi- lar analysis in other CMIP5 models.
The strong decrease in the mean overturning heat transport leading to the 30–50 % decrease in the OHT suggests that either the reduced meridional temperature gradient requires less heat to be transported to the poles or that a compensa- tion mechanism must be at work, bringing additional heat from the equator to the poles to obtain a closed heat budget.
In MPI-ESM, the atmosphere compensates for the decrease in the meridional ocean heat transport, implying an increased atmospheric heat transport (not shown), as also suggested by Rose and Ferreira (2012). A deeper analysis of the atmo-
Figure 9.The seasonal cycle of(a–b)the overturning component and(c–d)the gyre component (in PW) in the historical simulation (1850–
1950, left panel) and RCP 8.5 (2200–2300, right panel). Shown are anomalies relative to the annual mean at every latitude. Contour interval is 0.02 PW.
spheric compensation and changes in the atmospheric heat transport is needed but is beyond the scope of our study.
The advection of heat by the ocean determines ocean heat storage rates and is an important factor for air–sea heat ex- change (Dong et al., 2007), and thus for carrying heat to the North Atlantic sector and especially towards the European continent. By the changed ocean and heat transport dynam- ics, the surface air–sea heat fluxes are presumably exposed to changes regarding areas of heat flux divergences and conver- gences and thus of heat exchange and shifts in the seasonal cycle of surface heat fluxes, which might affect the climate over Europe.
In agreement with other studies (e.g. Gregory et al., 2005), the cooling associated with the decline of the OHT and the AMOC is smaller than the radiative heating of the atmo- spheric temperatures due to global warming. This yields an overall increase in surface temperature in the North Atlantic sector, which may be possible to separate from an AMOC decrease due to their distinctive footprints in outgoing long- wave and absorbed shortwave radiation (Drijfhout, 2015).
However, it is difficult to clearly separate the effect of the re- duced ocean heat transport on surface temperatures from the increased radiative heating of surface temperatures. To iden- tify this impact of the reduced OHT and changes in the OHT seasonal cycle, further studies will be required for clarifying the impact of a reduction and a changed seasonal cycle of the OHT on the North Atlantic sector and European climate.
6 Conclusions
Based on our analysis in the MPI-ESM CMIP5 climate pro- jection RCP 8.5, we conclude for the Atlantic Ocean merid- ional heat transport that
1. accompanied by a 30 to 50 % decline in the time-mean OHT, the seasonal cycle of the OHT shifts in time (1 to 6 months, depending on latitude and season) and in
space (5◦northward) in both the subtropical and subpo- lar gyres in RCP 8.5.
2. these changes stem from a latitude-dependent altered seasonal cycle and a northward shift in the zonal- mean zonal wind (about 5◦northward) and the resulting changes in the surface wind field that lead to a shift by 1 to 5 months in the seasonal cycle of the Ekman heat transport and the overturning heat transport.
3. especially in the tropical and subtropical North Atlantic, the OHT seasonal cycle is mostly forced and mostly changed in the surface layer and the upper ocean, where the wind acts as the dominant direct driver of the sea- sonal variability and leads to temporal shifts from 1 to 6 months.
4. thus, the changes in the total OHT seasonal cycle in the subtropical gyre result mostly from the zonal-mean wind-driven and surface-intensified parts of the over- turning heat transport, whereas in the subpolar gyre, the changes in the seasonal cycle are dominated by the gyre heat transport.
5. in the subpolar North Atlantic, we also find that the re- duction of the North Atlantic Deep Water formation re- sults in a weakened seasonal cycle with a weakened sea- sonal amplitude by the end of the 23rd century and thus changes the OHT seasonal cycle in the SPG.
These findings may have important implications for the im- pact of climate change on the decadal predictability of the AMOC and the OHT.
Appendix A: The meridional temperature transport in potential density coordinates
A1 Methods
The decomposition of the OHT into overturning and gyre components merely represents the vertical integral of the temperature and meridional velocity fields and thereby masks out any contribution from different layers and water masses in the North Atlantic. To analyse how the vertical structure of the North Atlantic ocean circulation and asso- ciated changes in the water mass characteristics contribute to changes in the seasonal cycle of the OHT, we calculate the OHT in potential density coordinates, similar to the analysis of Talley (2003). Specifically, we calculate the temperature transport for chosen potential density ranges since we can not ensure mass balance for every considered density class.
The temperature transportT in PWT (1 PWT=1×10¹⁵W) per density class is calculated from
T(y,(σ2i, σ2i+1))=ρ0cp xE
Z
xW
z(x,y,σ2i+1)
Z
z(x,y,σ2
i)
v(x, y, z)θ(x, y, z) dxdz, (A1)
withσ2 being the potential density referenced to 200 dbar, v the meridional velocity andθthe potential temperature in
◦C. For every density class, the temperature transport is inte- grated between the depth of the upper and lower limits of that density class given by the depth of the respective isopycnal z(x, y, σ2i) andz(x, y, σ2i+1). For the temperature transport, the unit PWT is used to make clear the difference of the tem- perature transport to the mass-balanced OHT. Even though the temperature transport does not hold mass balance, it is an appropriate choice for the calculation of the heat flux associ- ated with the individual water masses. However, for the full integral, which is the sum of the individual components ofT and gives the OHT, mass is conserved. In contrast to Talley (2003), we useσ2as density.
Through the relation of the density, in particular of the zonal density gradient, to the geostrophic transport of the AMOC by the thermal wind relation, we expect to find changes in the vertical structure where water mass proper- ties and the potential density change. For the definition of individual water masses, we therefore perform a regression analysis for eastern boundary fields, western boundary fields, and the zonal mean fields ofθ,S, andσ2 on the AMOC at 26◦N for the HISTmeanand RCPmeanindividually for annual mean values ofθ,S, andσ2. The regression analysis then en- ables us to identify main water masses based on changes in the vertical profiles of the regression profile of θ,S andσ2 on the AMOC (not shown), following Baehr et al. (2007).
Based on the regression analysis, we subdivide the tem- perature transport into four layers with fixed potential den- sity ranges, with water masses associated with the surface
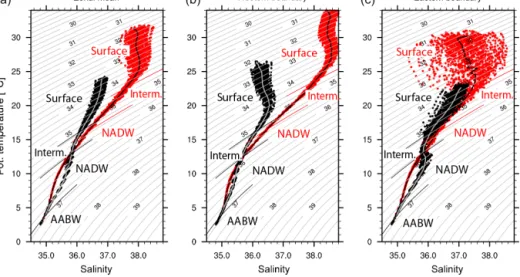
circulation, an intermediate layer, North Atlantic Deep Wa- ter (NADW, including parts of the lower Labrador Sea Wa- ter=LSW, Denmark Strait Overflow Water=DSOW and Iceland–Scotland Overflow Water=ISOW) and abyssal wa- ters from the Antarctic Bottom Water (AABW) (see Ta- ble A1). The temperature–salinity diagrams reveal changes in the water mass properties from the HISTmean to the RCPmean, with warmer and saltier waters for surface and intermediate layers in the RCPmean than in the HISTmean, yielding layers of lighter density in the RCPmean(Appendix Fig. A1). Since we find changes in the density classes and the associated water mass characteristics between the HISTmean
and RCPmean, the water mass definitions differ between the HISTmean and RCPmean. The individual water masses are therefore determined separately. In RCP 8.5, the deep wa- ter formation in the North Atlantic is considerably reduced, leading to a change in the water mass distribution. It is not convenient anymore to define a traditional North Atlantic Deep Water, which is why the density classes used to de- fine the individual water masses differ between the HISTmean and RCPmean. A finer separation of individual water masses is not feasible in the model. For each water mass with the respective density range, we then calculate the temperature transport following Eq. (A1) and the corresponding seasonal cycles.
The temperature transport for the individual water masses confirms that the northward heat transport is mostly confined to the surface layer in the tropical and subtropical North At- lantic in the HISTmean and RCPmean (Fig. A2). The inter- mediate water temperature transport increases from the sub- tropical to the subpolar gyre and dominates the total OHT between 40 and 55◦N in the HISTmeanand between 40 and 70◦N in the RCPmean, reflecting the outcropping of the inter- mediate layer around 45◦N. The NADW contributes with a southward (negative) temperature transport to the total OHT in the subtropical gyre, representing a return flow at depth and thus partially compensates for the surface-intensified temperature transport in the HISTmeanand RCPmean. In the HISTmean, the temperature transport of the NADW changes to northward (positive) transport in the subpolar gyre, con- siderably increases north of 50◦N and dominates the total OHT. Here, the NADW reaches the surface with outcropping isopycnals and thus includes both the northward flow at the surface and the southward flow at depth and determines the total OHT in the northern SPG. In the RCPmeanthe tempera- ture transport of the NADW is considerably reduced in the subpolar North Atlantic and yields southward temperature transport in the whole North Atlantic. This reflects that the deep water formation in the North Atlantic is considerably reduced and the isopycnals of the NADW do not outcrop any- more in the subpolar gyre. The temperature transport of the intermediate water shows only little changes, but it replaces and even intensifies the northward temperature transport of the NADW in the subpolar gyre in the RCPmean. The AABW
Figure A1.Temperature–salinity diagrams at 26◦N for the historical simulation (1850–1950 in black) and RCP 8.5 (2200–2300 in red) for (a)zonal mean,(b)western boundary, and(c)eastern boundary temperatures and salinities. Water masses show the surface, intermediate, North Atlantic Deep Water (NADW) and Antarctic Bottom Water (AABW). The mean of the temperature–salinity diagrams averaged over density layers is shown in grey and black.
Figure A2.(a)Time-mean temperature transport in the surface layer (red) and intermediate layer (yellow, in PWT) compared to the total OHT (black) and(b)time-mean temperature transport in the North Atlantic Deep Water (NADW, magenta) and Antarctic Bottom Water (AABW, blue) (in PWT) compared to the total OHT. The historical simulation (1850–1950) is shown by solid lines, RCP 8.5 (2200–2300) by dashed lines.
shows only a small amount of transport in the North Atlantic in both the HISTmeanand RCPmean.
A2 Seasonal cycle in the temperature transport in potential density coordinates
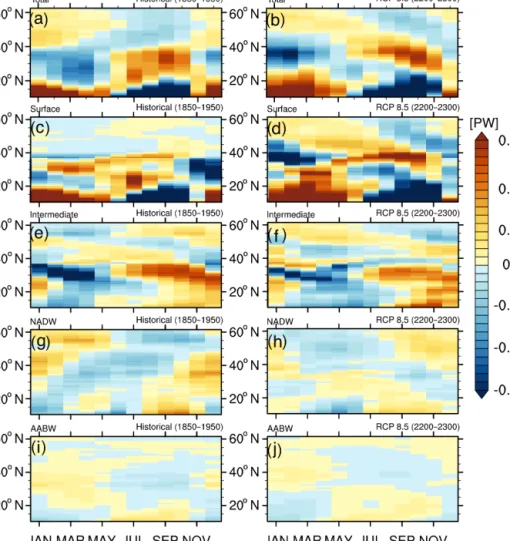
When analysing the seasonal cycle of the temperature trans- port in potential density coordinates, we find a strong sea- sonal cycle in the temperature transport in the surface layer (Fig. A3c–d) in both the HISTmeanand RCPmean, with sea- sonal amplitudes of about 3 and 2 PW respectively. Between the HISTmean and RCPmean, the seasonal cycle pattern in the surface layer shifts considerably northward in the trop- ical and subtropical North Atlantic and thus alters the sea- sonal cycle between 20 to 30◦N with temporal shifts of 4 to 6 months in the minimum and maximum. Furthermore, the seasonal cycle in the surface layer generally intensifies in the subpolar gyre in the RCPmean. The surface layer seasonal cy- cle can be assumed to be mostly wind-driven in the tropical
North Atlantic and the subtropical gyre, so that the seasonal cycle also closely follows the Ekman heat transport seasonal cycle.
In the intermediate layer the temperature transport also indicates a relevant contribution to the OHT seasonal cycle (Fig. A3e–f). In the tropical and subtropical North Atlantic, the seasonal cycle of the intermediate water is mainly op- posite to the seasonal cycle of the surface layer in both the HISTmeanand RCPmeanand thus partly compensates for the seasonal cycle in the surface layer. From the HISTmeanto the RCPmean, the pattern shows shifts in the seasonal cycle of about 1 month to later months, but no clear northward shift like in the surface layer. The seasonal cycle in the subpolar gyre indicates a general phase shift of up to 6 months from the HISTmeanto the RCPmean, with a shift of the maximum from summer to winter between approximately 40 to 50◦N and a shift of the maximum from winter to spring between 50 and 60◦N.
Figure A3.Contributions to the total OHT seasonal cycle from the temperature transport (PWT) of individual water masses calculated in potential density classes in the historical simulation (left) and RCP 8.5 (right):(a–b)total OHT,(c–d) surface layer,(e–f)intermediate layer, (g–h)NADW and(i–j)AABW. Shown are anomalies relative to the annual mean at every latitude. Contour interval is 0.02 PWT.
Table A1.Definition of water masses.
Surface Intermediate NADW AABW
HISTmean σ2≤35.2 kg m−3 35.2 kg m−3< σ2≤35.8 kg m−3 35.8 kg m−3< σ2≤36.91 kg m−3 σ2>36.91 kg m−3 RCPmean σ2≤34.5 kg m−3 34.5 kg m−3< σ2≤35.4 kg m−3 35.4 kg m−3< σ2≤36.91 kg m−3 σ2>36.91 kg m−3
In the NADW (Fig. A3g–h), substantial changes occur resulting from changes in the water mass formation in the North Atlantic. In the HISTmean, the formation of NADW is present and leads to a seasonal cycle in the temperature transport of the NADW, giving an important contribution es- pecially in the subpolar gyre. In the RCPmean, the seasonal cycle is weakened in the remaining temperature transport of the NADW, with a decrease in the seasonal amplitude, thus showing a surface-ward shift of the processes acting on the OHT seasonal cycle, especially in the subpolar gyre.
The AABW seasonal cycle is generally weak and thus does not considerably contribute to the full OHT seasonal
cycle (Fig. A3i–j). Still, we found a seasonal cycle in the HISTmean. In the RCPmeanwe found changes in the seasonal cycle with a northward shift of the pattern and also latitude- dependent temporal shifts. These changes in the AABW might result from changed dynamics in the Southern Ocean that are also influencing the global ocean circulation, which we do not focus on in this study and thus need further analy- sis.
Competing interests. The authors declare that they have no con- flict of interest.
Acknowledgements. We thank the two anonymous reviewers for very constructive comments. We thank Ralf Hand for stimu- lating discussions. This work was supported by the Cooperative Project RACE, Regional Atlantic Circulation and Global Change, funded through the German Federal Ministry for Education and Research (BMBF), 03F0651A (Matthias Fischer, Johanna Baehr), and by the Cluster of Excellence CliSAP (EXC177), Universität Hamburg, funded through the German Research Foundation (DFG) (Daniela I. V. Domeisen and Johanna Baehr). The work of Wolfgang M. Müller was supported by the German Federal Ministry for Education and Research (BMBF) project MiKlip (PT01LP1144A). Furthermore, research leading to these results has received funding from the European Union’s Seventh Framework Programme (FP7/2007-2013) under grant agreement no. 308378 ENV.2012.6.1-1: seasonal-to-decadal climate predictions towards climate services (http://www.specs-fp7.eu/). The climate simula- tions were performed at the German Climate Computing Centre (DKRZ).
Edited by: V. Lucarini
Reviewed by: two anonymous referees
References
Baehr, J., Haak, H., Alderson, S., Cunningham, S. A., Jungclaus, J. H., and Marotzke, J.: Timely detection of changes in the merid- ional overturning circulation at 26◦N in the Atlantic, J. Climate, 20, 5827–5841, 2007.
Balan Sarojini, B., Gregory, J. M., Tailleux, R., Bigg, G. R., Blaker, A. T., Cameron, D. R., Edwards, N. R., Megann, A. P., Shaf- frey, L. C., and Sinha, B.: High frequency variability of the At- lantic meridional overturning circulation, Ocean Sci., 7, 471–
486, doi:10.5194/os-7-471-2011, 2011.
Barrier, N., Cassou, C., Deshayes, J., and Treguier, A.-M.: Response of North Atlantic Ocean Circulation to Atmospheric Weather Regimes, J. Phys. Oceanogr., 44, 179–201, 2014.
Bintanja, R. and Van der Linden, E.: The changing seasonal climate in the Arctic, Scientific Reports, 3, 1556, doi:10.1038/srep01556, 2013.
Böning, C. and Hermann, P.: Annual cycle of poleward heat trans- port in the ocean: Results from high-resolution modelling of the North and Equatorial Atlantic, J. Phys. Oceanogr., 24, 91–107, 1994.
Böning, C., Dieterich, C., Barnier, B., and Jia, Y.: Seasonal cycle of meridional heat transport in the subtropical North Atlantic:
A model intercomparison in relation to observations near 25◦N, Prog. Oceanogr., 48, 231–253, 2001.
Bryan, K.: Measurements of meridional heat transport by ocean cur- rents, J. Geophys. Res., 67, 3403–3414, 1962.
Bryan, K.: Seasonal variation in meridional overturning and pole- ward heat transport in the Atlantic and Pacific Oceans: A model study, J. Mar. Res., 40, 39–53, 1982a.
Bryan, K.: Poleward heat transport by the ocean: observa- tions and models, Annu. Rev. Earth Pl. Sc., 10, 15–38, doi:10.1146/annurev.ea.10.050182.000311, 1982b.
Bryden, H. and Imawaki, S.: Ocean heat transport, in: Ocean cir- culation and climate: observing and modelling the global ocean, volume 77 of International Geophysics Series, chap. 6.1, edited by: Siedler, G., Church, J., and Gould, J., vol. 77, Academic Press, San Francisco, 455–474, 2001.
Bryden, H. L.: Ocean heat transport across 24◦N latitude, Interac- tions Between Global Climate Subsystems the Legacy of Hann, 65–75, 1993.
Butler, A. H., Thompson, D. W., and Heikes, R.: steady-state at- mospheric circulation response to climate change-like thermal forcings in a simple general circulation model, J. Climate, 23, 3474–3496, 2010.
Cabanes, C., Lee, T., and Fu, L.: Mechanisms of Interan- nual Variations of the Meridional Overturning Circulation of the North Atlantic Ocean, J. Phys. Oceanogr., 38, 467–480, doi:10.1175/2007JPO3726.1, 2008.
Chang, E. K., Guo, Y., and Xia, X.: CMIP5 multimodel ensemble projection of storm track change under global warming, J. Geo- phys. Res.-Atmos., 117, D23118, doi:10.1029/2012JD018578, 2012.
Chidichimo, M. P., Kanzow, T., Cunningham, S. A., Johns, W. E., and Marotzke, J.: The contribution of eastern-boundary density variations to the Atlantic meridional overturning circulation at 26.5◦N, Ocean Sci., 6, 475–490, doi:10.5194/os-6-475-2010, 2010.
Christensen, J., Krishna Kumar, K., Aldrian, E., An, S.-I., Cav- alcanti, I., de Castro, M., Dong, W., Goswami, P., Hall, A., Kanyanga, J., Kitoh, A., Kossin, J., Lau, N.-C., Renwick, J., Stephenson, D., S.-P., X., and Zhou, T.: Climate Phenomena and their Relevance for Future Regional Climate Change, in: Cli- mate Change 2013: The Physical Science Basis. Contribution of Working Group I to the Fifth Assessment Report of the Intergov- ernmental Panel on Climate Change, edited by: Stocker, T., Qin, D., Plattner, G.-K., Tignor, M., Allen, S., Boschung, J., Nauels, A., Xia, Y., V., B., and Midgley, P., Cambridge University Press, Cambridge, United Kingdom and New York, NY, USA, 2013.
Clement, A., Bellomo, K., Murphy, L. N., Cane, M. A., Mauritsen, T., Rädel, G., and Stevens, B.: The Atlantic Multidecadal Oscilla- tion without a role for ocean circulation, Science, 350, 320–324, 2015.
Czaja, A. and Frankignoul, C.: Observed impact of Atlantic SST anomalies on the North Atlantic Oscillation, J. Climate, 15, 606–
623, 2002.
Czaja, A. and Frankignoul, C.: Influence of the North Atlantic SST on the atmospheric circulation, Geophys. Res. Lett., 26, 2969–
2972, 1999.
Delworth, T. L. and Greatbatch, R. J.: Multidecadal thermohaline circulation variability driven by atmospheric surface flux forcing, J. Climate, 13, 1481–1495, 2000.
Dong, B. and Sutton, R. T.: Variability of Atlantic Ocean heat trans- port and its effects on the atmosphere, Ann. Geophys., 46, 87–97, doi:10.4401/ag-3391, 2003.
Dong, S., Hautala, S. L., and Kelly, K. A.: Interannual Variations in Upper-Ocean Heat Content and Heat Transport Convergence in the Western North Atlantic, J. Phys. Oceanogr., 37, 2682–2697, doi:10.1175/2007JPO3645.1, 2007.
Donohoe, A. and Battisti, D. S.: The seasonal cycle of atmospheric heating and temperature, J. Climate, 26, 4962–4980, 2013.