Decomposition of the Mean Barotropic Transport in a High-Resolution Model of the North
Atlantic Ocean
Yuan Wang1 , Martin Claus2,3 , Richard J. Greatbatch2,3 , and Jinyu Sheng1
1Department of Oceanography, Dalhousie University, Halifax, Nova Scotia, Canada,2GEOMAR Helmholtz Centre for Ocean Research Kiel, Kiel, Germany,3Faculty of Mathematics and Natural Sciences, University of Kiel, Kiel, Germany
Abstract
We show how a barotropic shallow water model can be used to decompose the mean barotropic transport from a high-resolution ocean model based on the vertically averaged momentum equations. We apply the method to a high-resolution model of the North Atlantic for which the local vorticity budget is both noisy and dominated by small spatial scales. The shallow water model acts as an effective filter and clearly reveals the transport driven by each term. The potential energy (joint effect of baroclinicity and bottom relief) term is the most important for driving transport, including in the northwest corner, while meanflow advection is important for driving transport alongf/Hcontours around the Labrador Sea continental slope. Both the eddy momentumflux and the meanflow advection terms drive significant transport along the pathway of the Gulf Stream and the North Atlantic Current.1. Introduction
The Gulf Stream and its extensions play an important role in the Northern Hemisphere climate (Minobe et al., 2008; O’Reilly et al., 2016; Scaife et al., 2014), because of its massive volume transport and associated redis- tribution of heat and salinity (Böning et al., 2016; Trenberth & Caron, 2001). After the Gulf Stream detaches from the shelf break at Cape Hatteras, its volume transport increases dramatically up to about 150 Sverdrup (Sv) (Fuglister, 1963). This increase in transport has been attributed to the presence of the Northern Recirculation Gyre on its north side and the Worthington Gyre on its south side (Hogg, 1992;
Hogg et al., 1986; Worthington, 1976). The Gulf Stream reattaches to the bottom slope at the southern tip of the Grand Banks of Newfoundland and the Newfoundland Ridge. Its main branch follows the slope of the Newfoundland Shelf northward as the North Atlantic Current (NAC), before it turns sharply eastward at the northwest corner, heading toward Europe.
The dynamics of the northwest corner (centered at about 50°N, 45°W) (Lazier, 1994) and the recirculation gyres associated with the Gulf Stream and its extensions are not fully understood, and general circulation models have trouble reproducing these features of the circulation. Typically, for example, the northwest corner is missing due to the misplaced NAC (see Delworth et al., 2012; Drews et al., 2015; Flato et al., 2013;
Griffies et al., 2015), leading to the so-called“cold bias”that, in turn, can be detrimental to the representation of low-frequency variability in models (Drews & Greatbatch, 2016, 2017) and also to the overlying atmosphere in coupled models (Keeley et al., 2012; Scaife et al., 2011). Furthermore, the region of the Mann Eddy (cen- tered at about 42°N, 46°W) is suggested to be a pivotal point in modulating variability of the Atlantic Meridional Overturning Circulation (Tulloch & Marshall, 2012).
There has long been discussion on the dynamics driving the recirculation gyres. It has been suggested that the deep circulation plays an important role in their dynamics through the bottom pressure torque and asso- ciated bottom vortex stretching (Greatbatch et al., 1991; Holland, 1973; Zhang & Vallis, 2007). Recirculation gyres have also been modeled using extensions to a stratified ocean of the Fofonoff (1954) model (Greatbatch, 1987; Marshall & Nurser, 1986). In these models, the eddyfluxes provide a weak forcing while it is the advection by the meanflow, in particular the advection of mean vorticity in the time-averaged vor- ticity equation, that shields the recirculation gyres from the influence of the eastern boundary and allows the transport to exceed the Sverdrup transport. Hogg and Stommel (1985) had earlier noted that closed potential vorticity contours can occur beneath the Gulf Stream due to the tilt of the isopycnals and the underlying topography (see also Greatbatch & Zhai, 2006) and that transient eddies can drive large transports within these contours. More recently, Greatbatch et al. (2010) have estimated that the transport driven by the
Geophysical Research Letters
RESEARCH LETTER
10.1002/2017GL074825
Key Points:
•A linear shallow water model is shown to be an effective means of decomposing the mean barotropic transport from a high-resolution, eddying model of the North Atlantic based on the vertically averaged horizontal momentum equations
•The potential energy, meanflow advection, and eddy momentumflux terms all contribute to the mean barotropic transport of the Gulf Stream and its extension, including the northwest corner and the Mann Eddy
•Meanflow advection is found to play an important role in the interaction between the circulation and the continental slope
Supporting Information:
•Supporting Information S1
Correspondence to:
M. Claus, mclaus@geomar.de
Citation:
Wang, Y., Claus, M., Greatbatch, R. J. &
Sheng, J. (2017). Decomposition of the mean barotropic transport in a high-resolution model of the North Atlantic Ocean.Geophysical Research Letters,44, 11,537–11,546. https://doi.
org/10.1002/2017GL074825
Received 5 JUL 2017 Accepted 1 NOV 2017
Accepted article online 6 NOV 2017 Published online 20 NOV 2017
©2017. The Authors.
This is an open access article under the terms of the Creative Commons Attribution-NonCommercial-NoDerivs License, which permits use and distri- bution in any medium, provided the original work is properly cited, the use is non-commercial and no modifications or adaptations are made.
eddy momentumfluxes alone is comparable to the observed total transport in the Gulf Stream and North Atlantic Current region. In that paper, the surface eddy momentumfluxes were derived from satellite altime- try observations. However, a vertical profile for the eddy momentumfluxes had to be assumed to calculate the vertical integral of thefluxes that is difficult to verify given the limited observations. One of the aims of the present study is to assess the importance of the eddy momentumfluxes, compared to other drivers for vertically integrated transport, in a high-resolution ocean model.
Traditionally, the vertically integrated (barotropic) gyre transport in the ocean has been understood in terms of the vorticity equation derived from either the vertically integrated or the vertically averaged momentum equations (see, for example, Bell, 1999 and Yeager, 2015). The former approach (see equation (S24) in the supporting information), based on vortex stretching of the water column, takes theflat-bottom Sverdrup transport (equation (S25)) implied by the surface wind stress as its reference point, and the effect of variable bottom topography enters by means of the bottom pressure torque (see Holland, 1973, for an early example).
On the other hand, when considering the vorticity equation derived from the vertically averaged momentum equations (equation (S21) in the supporting information), the reference is the topographic Sverdrup transport for a uniform density ocean (equation (S22)). The effect of density stratification is included by means of the joint effect of baroclinicity and bottom relief (JEBAR) term (see Mertz & Wright, 1992, for a detailed discussion of JEBAR), an approach dating back to Sarkisyan and Ivanov (1971). Greatbatch et al.
(1991) exploited these two different approaches in order to suggest a decomposition of the gyre transport into its different components and illustrated their decomposition for the North Atlantic using the diagnostic model of Mellor et al. (1982). Bell (1999) and Yeager (2015) have discussed both approaches applied as model diagnostics, the former focusing on the North Atlantic and the representation of the Gulf Stream in models, and latter showing how the same approach can be used to provide a decomposition for the meridional over- turning circulation in models. Neither Bell (1999) nor Yeager (2015) used models that included eddies and were therefore unable to say anything about the transport that is driven by the eddy momentumfluxes.
In order to infer the transport driven by the eddy momentumfluxes, Greatbatch et al. (2010) used a barotro- pic, linear shallow water model driven by forcing terms that were specified in the horizontal momentum equations. The barotropic model solves for the vertically averaged (barotropic) velocity, and the forcing terms were derived by vertically averaging the momentumflux convergence implied by the satellite-derived sur- face eddy momentumfluxes based on the assumed vertical profile. Their approach is therefore based on the vertically averaged, rather than the vertically integrated, momentum equations. In the present study, we extend this approach to include, additionally, forcing terms associated with meanflow advection, the potential energy (which leads to the JEBAR term in the vorticity equation), and direct wind forcing (as for a uniform density ocean) (see equation (S11)). A detailed derivation of the forcing terms is given in the support- ing information. The forcing terms are, in turn, derived from a high-resolution ocean model that includes mesoscale eddies. We show that the local vorticity budget in the model is quite noisy and is dominated by small spatial scales from which it is difficult to infer the relative importance of the different forcing terms.
Dynamically computing the implied transport using the shallow water model acts as an effective filter enabling the transport stream function from the high-resolution model to be decomposed into its separate parts.
The high-resolution ocean model used here is the VIKING20 configuration (Behrens, 2013). VIKING20 has the advantage that it captures the Gulf Stream, NAC, and their associated recirculation gyres without data assim- ilation (see Mertens et al., 2014, and Breckenfelder et al., 2017, for a detailed assessment of the performance of VIKING20). Section 2 presents the four forcing terms and discusses the setup of the linear shallow water model used to compute the transport driven by each forcing term. Results for the mean transport averaged over 50 years (1960–2009) are shown and discussed in section 3. A summary and discussion are given in section 4.
2. Methods
VIKING20 is a two-way nested ocean model configuration that consists of a high-resolution (1/20°) component (referred to as the nest in the following), covering the northern North Atlantic (from ~30°N to 85°N) that is embedded within a global component of roughly 1/4° horizontal resolution (referred to as the base). Both components are composed of the Nucleus for European Modelling of the Ocean (NEMO)
(Madec, 2008), using the Océan PArallélisé system (OPA) for ocean circulation, and the Louvain-la-Neuve Ice Model version 2 (LIM2) for sea ice. The two-way nesting is accomplished with the help of the Adaptive Grid Refinement In Fortran (AGRIF) system (see Behrens, 2013, and Böning et al., 2016, for the details). After a 30 year spin-up of the base component alone, VIKING20 was integrated from 1948 to 2009 using the Coordinated Ocean-Ice Reference Experiment 2 atmospheric forcing (Large & Yeager, 2009). Output pro- duced by the nest component of VIKING20 during the period of 1960–2009 is used in this study to calculate the forcing terms for the vertically and time-averaged horizontal momentum equations. It should be noted that the separation between the mean and the perturbation velocity is carried out each year separately, fol- lowing Rieck et al. (2015). As such, the meanflow advection forcing also includes a rectified contribution from the interannual variability.
To compute the barotropic transport driven by each of the forcing terms, we use a linear, barotropic shallow water model (SWM) that is run to steady state. In steady state, the equations governing the SWM are
fv¼Z 1 ρ0acosθ∂pb
∂λ ru HþFx fu¼M 1
ρ0a
∂pb
∂θ rv HþFy
0¼ 1 acosθ
∂Hu
∂λ þ∂cosθHv
∂θ:
where each of the four forcing terms in turn is denoted as (Z,M), whereZis the zonal component andMis the meridional component. It should be noted that the free surface variable in the SWM should be interpreted as the bottom pressure,pb;ais the radius of the Earth; (λ,θ) are longitude and latitude;uandvare vertically averaged velocities in the eastward and northward directions, respectively;His the ocean bottom depth;r is a linear bottom friction coefficient; and (Fx,Fy) denotes a horizontal Laplacian viscosity term with lateral eddy viscosity coefficient given byAh(see the supporting information for the detailed expression).
The forcing terms, (Z,M), are computed from the output of the nest component of VIKING20 for each year separately and then averaged over all years to provide the forcing for the SWM. The formulation of (Z,M) in the four cases is given below (the detailed derivation is given in the supporting information), where an overbar denotes a time average over a single year (following Rieck et al., 2015) and< >a vertical integral fromz=H(corresponding to the ocean bottom) toz= 0 (the ocean surface):
1. The potential energy term:
Z¼ 1 Hacosθ ∂
∂λ gðρρmÞ ρ0
z
* +
" #
M¼ 1 Ha
∂
∂θ gðρρmÞ ρ0
z
* +
" #
whereρrepresents the in situ density andρmrepresents the horizontally averaged mean density.
2. Meanflow advection:
Z¼ 1 Hacosθ
∂h iu u
∂λ þ∂cosθh iu v
∂θ
M¼ 1 Hacosθ
∂h iv u
∂λ þ∂cosθh iv v
∂θ
3. Eddy momentumflux:
Z¼ 1 Hacosθ
∂Du0u0E
∂λ þ∂cosθDu0v0E
∂θ 2
4
3 5
M¼ 1 Hacosθ
∂Du0v0E
∂λ þ∂cosθDv0v0E
∂θ 2
4
3 5
4. The wind stress term:
Z¼ τxs
ρ0H M¼ τsy
ρ0H
The SWM in this study is very similar to the model described by Greatbatch et al. (2010) and is set up for the model domain covered by the high-resolution nest component of VIKING20. The model uses a staggered latitude/longitude C-grid with a horizontal resolution of 1/20° covering the North Atlantic between 85°W to 5°E and from 31°N to 67°N. The bottom topography is interpolated from that of the VIKING20 nest component to the SWM grid. To keep the model stable and restrict noise, a linear bottom friction coefficient with r= 5 × 10⁴ m s1 and Laplacian horizontal viscosity coefficient Ah= 150 m2 s1 are applied. While there is some sensitivity to the choice of these values, the stream function computed from the SWM, when all four forcings are used together, is close to that from VIKING20, as we show in Figure 1 (discussed in detail later), suggesting that these values effectively mimic the dissipation in VIKING20. No attempt was made to extract the dissipation terms from VIKING20 itself (which, in any case, are not part of the available model output). In addi- tion, to inhibit topographic instability associated with the steep and rough topography (Killworth, 1987) on the high-resolution SWM grid, a 3-by-3 running averagefilter is applied to smooth regions with water depth less than 1,000 m. Note that we want to preserve the topography in the deep ocean as close as possible to that of the nest component of VIKING20 since this study focuses on the large-scale barotropic trans- port in the open ocean rather than on the shelf. In addition, Hudson Strait, Davis Strait, Denmark Strait, the Faroe Bank Channels, the English Channel, and the Strait of Gibraltar are all closed in the model.
Unlike the VIKING20 nest, the lateral boundaries of the SWM are closed, since we do not attempt to decompose the open boundary forcing for the VIKING20 nest component according to each forcing term. Since there aref/Hcontours that enter the model domain at the southern boundary, transport driven by each forcing term outside the SWM domain (which is the same as that of the VIKING20 nest) is not taken care of by our model solution and this indeed has an impact on the computed barotropic transport, as we discuss later. While this is a dis- advantage of our method as applied to VIKING20, the problem would not arise if the southern boundary of the nest extended south of the equator since then the southern bound- ary of the SWM domain would not crossf/Hcontours.
3. Results
Figure 1a presents the total barotropic transport computed directly from VIKING20 within the region of the VIKING20 nest, and Figure 1b presents the sum of the barotropic transport from the SWM driven by each of the four forcing terms separately (note that since the SWM is linear, this is the same as the transport driven by all four terms together). The barotropic transport from the VIKING20 nest (Figure 1a) depicts a well- developed northern recirculation gyre south of Atlantic Canada, and recirculation gyres associated with the North Atlantic Current, including the anticyclonic Mann Eddy centered at 42°N, 46°W and the northwest corner near 50°N, 45°W. The recirculation gyres in the SWM are at the same locations and of similar strengths Figure 1.Model-computed 50 year mean barotropic transport (color shading in
units of Sverdrups) for (a) the VIKING20 nest, (b) the sum of the four cases computed by the SWM, and (c) a–b. The lines aref/Hcontours of 17, 20, 25, 35, 45, and 55 in units of 109s1m1, which are smoothed using a Gaussian filter with a standard deviation of 0.5° in latitude and longitude. The locations of the northwest corner (NWC) and Mann Eddy (ME) are shown (Figure 1a).
to those in the VIKING20 nest, which indicates that our linear decomposition method is able reproduce their dynamics from VIKING20. Nevertheless, the combined barotropic transport from the SWM is weaker in the subtropical gyre and a bit stronger in the subpolar gyre. The difference, as shown in Figure 1c, is mostly asso- ciated with the closed southern boundary in the SWM; indeed, the difference in the barotropic transport is generally anticyclonic, following thef/Hcontours. It is also possible that some of the difference is related to the different friction parameterizations used in the SWM and VIKING20. Nevertheless, the unexplained bar- otropic transport does not exhibit the recirculation gyres or quasi-stationary eddies along the Gulf Stream and the North Atlantic Current, which implies that the dynamics of these recirculation gyres are primarily explained by the four forcing terms specified within the SWM domain.
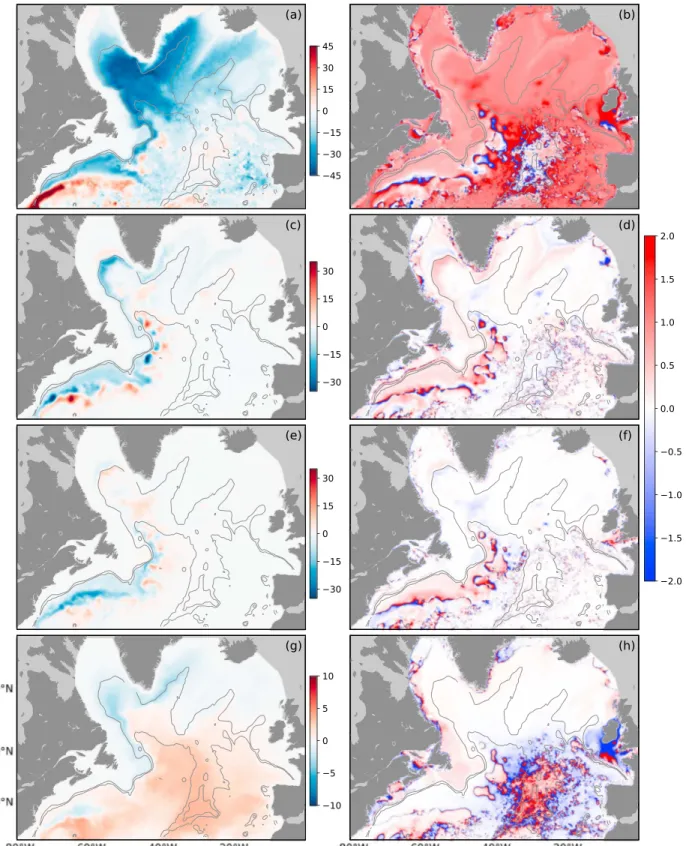
Figure 2 shows the 50 year mean barotropic transport driven by the potential energy (PE), meanflow advec- tion, eddy momentumflux, and the wind stress terms (here the wind-driven transport for an ocean of uni- form density), and the ratio of their contributions to the total explained barotropic transport from the SWM. The PE term plays a dominant role over most parts of the model domain, especially in the subpolar gyre, the Northern Recirculation Gyre, and the Gulf Stream separation region, including the Worthington Gyre, consistent with previous studies (e.g., Greatbatch et al., 1991; Myers et al., 1996). The PE term also plays the primary role along the path of the Gulf Stream, where it is complemented by the meanflow advection and eddy momentumflux terms. The meanflow advection term also drives considerable barotropic transport around the western subpolar gyre associated with the recirculating boundary current around the Labrador Sea and Irminger Sea (Fischer et al., 2015; Lavender et al., 2000). The meanflow advection and, to some extent, the eddy momentumflux terms, drive a series of recirculations along the path of the Gulf Stream and the North Atlantic Current, including in the northwest corner, not unlike the eddy-driven transport inferred for this region by Zhai et al. (2004). In the northwest corner, the meanflow advection term predomi- nantly drives the anticyclonic mesoscale recirculation centered at 50°N, 45°W, but with some role for the PE and eddy momentumflux terms. For the Mann Eddy the meanflow advection/eddy momentumflux and PE terms are dominant over the eastern and western halves, respectively. This implies that all three dynamical processes are working together to shape this semipermanent anticyclonic eddy. The location of the Mann Eddy and the adjacent North Atlantic Current is observed to migrate over 200 km (Meinen, 2001), suggesting variability in the relative importance of these terms over time.
Figure S1 in the supporting information shows the local vorticity budget diagnosed from VIKING20 and based on equation (S21). It should be noted that the plottedfields have been smoothed to reduce noise. The plottedfields nevertheless exhibit mostly small-scale features, and it is difficult to infer the relative impor- tance of the different forcing terms. Similar plots in Bell (1999) and Yeager (2015) are more informative, but it should be noted that the models they used have much coarser resolution with much less detailed bot- tom topography (a major source of noise) than is carried by VIKING20. An advantage of our method is that the SWM effectively integrates the forcing terms to provide transportfields (without smoothing) that not only closely resemble that in VIKING20 (Figure 1) but also provide an effective decomposition of the transport in VIKING20 into its constituent parts (Figure 2). Furthermore, as we noted earlier, the southern boundary of the VIKING20 nest would be much less troublesome if it was located either at or south of the equator. A good example, illustrating the power of our method, is provided by the eddy momentumflux forcing. From Figure S1, this appears weak and much less important than implied by Figure 2. Nevertheless, some useful information can be gained from Figure S1. The general tendency (although not universal) for the JEBAR term to balance the advection of planetary vorticity is consistent with the dominance of the PE term for explaining the transport in VIKING20 (Figure 2). Furthermore, it is seen that the meanflow advection term is most impor- tant in the region of the East Greenland Current and it appears that this region plays a role in driving the recir- culation gyre around the rim of the Labrador Sea that can be seen in Figure 2b.
Compared to the barotropic transport driven by the eddy momentumfluxes in Greatbatch et al. (2010) using satellite-altimetry-derived forcing, the SWM, using the forcing derived from the output of the VIKING20 nest, generates a very similar pattern but less magnitude. As noted earlier, Greatbatch et al. (2010) had to assume a vertical profile for the eddy momentumfluxes and, as noted by these authors, the more surface trapped the profile, the less the transport that is driven by these terms. Since the eddy momentumfluxes derived from the VIKING20 nest have a similar magnitude at the surface to those seen in the altimeter data (not shown), the explanation for the reduced transport computed here is almost certainly that the vertical profile of thefluxes in the model is surface intensified (see Figure S2 in the supporting information), rather than linear, as
Figure 2.Model-computed 50 year mean barotropic transport (color shading in units of Sverdrups) driven by (a) the PE (JEBAR), (c) meanflow advection, (e) eddy momentumflux, and (g) wind stress terms. Note that the color coding is not the same in all panels. (b, d, f, and h) The ratio of the corresponding barotropic transport to the total barotropic transport (as shown in Figure 1b). The contours aref/Hcontours of 30 and 45 in units of 109s1m1, which are smoothed using a Gaussianfilter with a standard deviation of 0.5° in latitude and longitude.
assumed by Greatbatch et al. (2010). Furthermore, the vertical integral of the vertical profile shown in Figure S2 has about 25% the magnitude of the corresponding linear profile assumed by Greatbatch et al.
(2010), similar to the reduction in the magnitude of the transport that is driven by these terms (Figure 2c) compared to that reported by Greatbatch et al. (2010).
The barotropic transport that is directly driven by the surface wind stress within the SWM domain (Figure 2g) is weak but, nevertheless, has a role to play over the Mid-Atlantic Ridge south of the Charlie-Gibbs Fracture zone (Figure 2h). Note that the wind-driven transport presented here is the wind-forced response of a uni- form density ocean which, as noted by Greatbatch et al. (1991), is very different in the North Atlantic from that of theflat-bottom Sverdrup transport (compare Figures 2g and 3c to see this comparison directly).
This is because the presence of the Mid-Atlantic Ridge causes thef/Hcontours to exhibit large latitudinal excursions. Furthermore, our diagnosis of the response to this term is affected by the closed southern bound- ary and is missing transport that would otherwise propagate into the SWM domain from the south along the western side of the mid-Atlantic ridge and also near the eastern boundary. For example, a comparison with Figure 2a in Greatbatch et al. (1991) shows much more transport in the subtropical gyre region, west of the Mid-Atlantic Ridge, than can be seen in Figure 2g.
We can also decompose the barotropic transport following equation (S24) in the supporting information.
Since (S24) is the vorticity balance for the vertically integrated, as distinct from the vertically averaged, momentum equations, the forcing terms are the eddy momentumflux, meanflow advection, and wind stress terms given in section 2 but now multiplied by the local depthH, and the SWM is run using a uniform depth, here taken to be 4,000 m with the lateral eddy viscosity is reduced to 2 m2s1. Note that using the value of 150 m2s1reduces the amplitude shown but does not affect the spatial pattern, and also that integrating the Figure 3.Model-computed 50 year mean barotropic transport (color shading in units of Sverdrups) for theflat bottom case driven by (a) meanflow advection, (b) eddy momentumflux, (c) wind stress, and (d) the part that is estimated to be driven by bottom pressure torque.
forcing terms directly along lines of latitude, following (S24), leads to a very noisy solution from which it is hard to extract the signal. To estimate the barotropic transport driven by the bottom pressure torque (Figure 3d), we take the transport stream function from VIKING20 shown in Figure 1a and subtract the parts that are associated with the eddy momentumfluxes (Figure 3a), meanflow advection (Figure 3b), and surface wind stress (Figure 3c), the latter corresponding to theflat-bottom Sverdrup transport given by equation (S25) (modified by the lateral mixing as in the model of Munk, 1950). From Figure 3, we see that the implied transport driven by the bottom pressure torque is strongly influenced by the meanflow advection and eddy momentumflux contributions, especially the former. Indeed, it is clear that there is a lot of cancellation between Figures 3a and 3d suggesting that the meanflow advection has a big influence on how the circula- tion interacts with the sloping bottom topography in the model, appearing, in fact, to be more important than the spreading of newly formed dense water masses. If the latter were important, then the transport dri- ven by the bottom pressure torque would be dominated by the difference between the VIKING20 stream function and the component driven by the surface wind stress (Figure 3c). Clearly, this is not the case.
4. Summary and Discussions
In this study, the mean barotropic transport in the North Atlantic Ocean has been diagnosed using a shallow water model (SWM) driven by forcing terms derived from the high-resolution component of a nested ocean circulation model configuration, VIKING20. By this method, the mean barotropic transport over the period of 1960–2009 simulated by VIKING20 (without data assimilation) can be attributed to four forcing terms in the vertically averaged momentum equation: the eddy momentumflux, meanflow advection, potential energy (PE), and wind stress forcing for an ocean of uniform density (Figure 2). We have seen that the local vorticity budget is noisy and characterized by small spatial scales (Figure S1) from which it is difficult to infer the rela- tive importance of the different forcing terms. For example, the eddy momentumflux terms appear to be unimportant in Figure S1, yet are a significant contributor to the transport of the Gulf Stream and its recircu- lations. Indeed, the SWM approach adopted here offers a powerful tool for diagnosing the transport output from high-resolution ocean models and is an effective alternative when analyzing models that include eddies to the approaches adopted to Bell (1999) and Yeager (2015).
Regarding the four forcing terms, the PE term is the primary forcing, including in the northwest corner region east of Newfoundland where models have great difficulty simulating the circulation (see Delworth et al., 2012; Drews et al., 2015; Flato et al., 2013; Griffies et al., 2015) and the recirculation gyres associated with the Gulf Stream Extension, consistent with previous work (e.g., Greatbatch et al., 1991; Zhang & Vallis, 2007). Both the eddy momentumflux and the meanflow advection terms play a significant role in the Gulf Stream region and its extensions, including the North Atlantic Current, and the meanflow advection is found to be an important driver for transport around the rim of the Labrador Sea (this is the recirculation gyre noted by Lavender et al., 2000, based on drifter data). The transport driven by the eddy momentum fluxes shows a very similar pattern to the transport stream function derived in a previous study using eddy momentumfluxes derived from satellite data (Greatbatch et al., 2010) apart from the lower amplitude, which we attribute to the vertical profile of eddy momentumfluxes assumed in that study; in the VIKING20 nest the eddy momentumfluxes are more surface intensified (Figure S2). Interestingly, in addition to PE forcing (i.e., JEBAR), both the eddy momentumfluxes and mean flow advection play a role in driving the Gulf Stream recirculation gyres either side of the Gulf Stream Extension (Hogg, 1992). The fact the eddy momen- tumfluxes are important shows that unlike in the theories of Marshall and Nurser (1986) and Greatbatch (1987), the eddy forcing of these gyres is not“weak”. The theory in those papers depends on the meanflow advection term playing a major role, and it is interesting that some role for this term is, indeed, found. In general, the wind stress forcing (which leads to the response for a uniform density ocean) has a relatively minor contribution that arises from the blocking of thef/Hcontours by the Mid-Atlantic Ridge (Figure 1c) (Greatbatch et al., 1991) and the closed southern boundary for our SWM.
This study explicitly illustrates the dynamics governing the recirculation gyres associated with the Gulf Stream and North Atlantic Current, including the northwest corner, which are not well understood. It is demonstrated that the northwest corner is primarily driven by the combination of the PE and meanflow advection terms with some role for the eddy momentumfluxes. The role of the PE forcing is anticipated given the impact of theflow-field correction in alleviating the cold bias in Drews et al. (2015), since the correction assumes that a diagnostic calculation, in which the densityfield is specified, is capable of reproducing the
northwest corner in a model. Another example is the Mann Eddy, which is a semipermanent anticyclonic eddy that is observed to migrate sometimes over a distance of 200 km (Meinen, 2001). Figure 2 suggests that the east/west side of the Mann Eddy is primarily driven by the meanflow advection and eddy momentum flux/PE terms. This explains the eastward shift in the position of the Mann Eddy in the study using only the eddy momentumflux forcing by Greatbatch et al. (2010), and may also explain the challenge for a 1/4° hor- izontal resolution model to reproduce the eastern branch of the Mann Eddy (see Figure 5a in Urrego-Blanco &
Sheng, 2012).
It is still challenging for numerical models to replicate many observed recirculation gyres, especially for climate models that trade off resolution and dynamics for efficiency, which can be significantly detrimental to the model veracity (e.g., the cold bias). Numerical corrections, such as those described by Drews et al.
(2015), turn out to be one possible way to improve the model performance, while the lack of knowledge on dynamics driving those recirculation gyres imposes difficulties. The importance of the PE term in the dynamics of the northwest corner is consistent with previous studies (e.g., Zhang et al., 2011).
Nevertheless, a new and surprising result is the influence that the meanflow advection has on the interaction between the circulation and the sloping bottom topography, i.e., the bottom pressure torque (see Figure 3).
This suggests a feedback between the circulation in the continental slope region and the mean flow advection that might well contribute to the difficulties models have with, for example, Gulf Stream separation and the northwest corner. We suggest that the method presented here, using a linear shallow water model, is an effective tool with which to diagnose the drivers for transport in high-resolution ocean models, including models that do not exhibit a northwest corner or a correct Gulf Stream separation. Such diagnoses are needed in order to disentangle the different types of feedback operating in these models.
References
Behrens, E. (2013).The oceanic response to Greenland melting: The effect of increasing model resolution. Kiel: Christian-Albrechts-Universität.
8-Diss-136843
Bell, M. J. (1999). Vortex stretching and bottom torques in the Bryan-Cox ocean circulation model.Journal of Geophysical Research,104(C10), 23,545–23,563. https://doi.org/10.1029/1999JC900064
Böning, C. W., Behrens, E., Biastoch, A., Getzlaff, K., & Bamber, J. L. (2016). Emerging impact of Greenland meltwater on deepwater formation in the North Atlantic Ocean.Nature Geoscience,9(7), 523–527.
Breckenfelder, T., Rhein, M., Roessler, A., Böning, C. W., Biastoch, A., Behrens, E., & Mertens, C. (2017). Flow paths and variability of the North Atlantic Current: A comparison of observations and a high-resolution model.Journal of Geophysical Research: Oceans,122, 2686–2708.
https://doi.org/10.1002/2016JC012444
Delworth, T. L., Rosati, A., Anderson, W., Adcroft, A. J., Balaji, V., Benson, R.,…Pacanowski, R. C. (2012). Simulated climate and climate change in the GFDL CM2. 5 high-resolution coupled climate model.Journal of Climate,25(8), 2755–2781. https://doi.org/10.1175/JCLI-D-11-00316.1 Drews, A., & Greatbatch, R. J. (2016). Atlantic multidecadal variability in a model with an improved North Atlantic Current.Geophysical
Research Letters,43, 8199–8206. https://doi.org/10.1002/2016GL069815
Drews, A., & Greatbatch, R. J. (2017). Evolution of the Atlantic Multidecadal Variability in a model with an improved North Atlantic Current.
Journal of Climate,30(14), 5491–5512. https://doi.org/10.1175/JCLI-D-16-0790.1
Drews, A., Greatbatch, R. J., Ding, H., Latif, M., & Park, W. (2015). The use of aflowfield correction technique for alleviating the North Atlantic cold bias with application to the Kiel climate model.Ocean Dynamics,65(8), 1079–1093. https://doi.org/10.1007/s10236-015-0853-7 Fischer, J., Karstensen, J., Zantopp, R., Visbeck, M., Biastoch, A., Behrens, E.,…Valdimarsson, H. (2015). Intra-seasonal variability of the DWBC
in the western subpolar North Atlantic.Progress in Oceanography,132, 233–249. https://doi.org/10.1016/j.pocean.2014.04.002 Flato, G., Marotzke, J., Abiodun, B., Braconnot, P., Chou, S. C., Collins, W. J.,…Eyring, V. (2013). Evaluation of climate models. In T. F. Stocker,
et al. (Eds.),Climate change 2013: The physical science basis. Contribution of working group I to the Fifth Assessment Report of the Intergovernmental Panel on Climate Change(Vol. 5, pp. 741–866). Cambridge: Cambridge University Press.
Fofonoff, N. P. (1954). Steadyflow in a frictionless homogeneous ocean.Journal of Marine Research,13, 254–262.
Fuglister, F. C. (1963). Gulf stream’60.Progress in Oceanography,1, 265–373.
Greatbatch, R. J. (1987). A model for the inertial recirculation of a gyre.Journal of Marine Research,45(3), 601–634. https://doi.org/10.1357/
002224087788326821
Greatbatch, R. J., Fanning, A. F., Goulding, A. D., & Levitus, S. (1991). A diagnosis of interpentadal circulation changes in the North Atlantic.
Journal of Geophysical Research,96(C12), 22,009–22,023. https://doi.org/10.1029/91JC02423
Greatbatch, R. J., & Zhai, X. (2006). Influence of assimilated eddies on the large-scale circulation in a model of the northwest Atlantic Ocean.
Geophysical Research Letters,33, L02614. https://doi.org/10.1029/2005GL025139
Greatbatch, R. J., Zhai, X., Claus, M., Czeschel, L., & Rath, W. (2010). Transport driven by eddy momentumfluxes in the Gulf Stream Extension region.Geophysical Research Letters,37, L24401. https://doi.org/10.1029/2010GL045473
Griffies, S. M., Winton, M., Anderson, W. G., Benson, R., Delworth, T. L., Dufour, C. O.,…Rosati, A. (2015). Impacts on ocean heat from transient mesoscale eddies in a hierarchy of climate models.Journal of Climate,28(3), 952–977. https://doi.org/10.1175/JCLI-D-14-00353.1 Hogg, N. G. (1992). On the transport of the Gulf Stream between Cape Hatteras and the Grand Banks.Deep-Sea Research Part A:
Oceanographic Research Papers,39(7–8), 1231–1246.
Hogg, N. G., Pickart, R. S., Hendry, R. M., & Smethie, W. J. (1986). The northern recirculation gyre of the Gulf Stream.Deep-Sea Research Part A:
Oceanographic Research Papers,33(9), 1139–1165.
Hogg, N. G., & Stommel, H. (1985). On the relation between the deep circulation and the Gulf Stream.Deep-Sea Research Part A:
Oceanographic Research Papers,32(10), 1181–1193.
Acknowledgments
We are grateful to three reviewers for their constructive comments on the manuscript. These comments have led to considerable improvements. Y.W. is grateful for funding support from the NSERC CREATE Transatlantic Ocean System Science and Technology (TOSST) grant and for the opportunity to spend 4 months at GEOMAR. J.S. is funded by the MEOPAR and NSERC.
Support is also acknowledged from the German Ministry for Education and Research (BMBF) through MiKlip2, sub- project 01LP1517D (ATMOS-MODINI).
M.C. is grateful for funding support from the Deutsche Forschungsgemeinschaft through the Sonderforschungsbereich 754“Climate-Biogeochemistry Interactions in the Tropical Ocean”. R.J.
G. is also grateful for continuing support from GEOMAR. Data shown in this paper are available at data.geomar.de.
Holland, W. R. (1973). Baroclinic and topographic influences on the transport in western boundary currents.Geophysical and Astrophysical Fluid Dynamics,4(1), 187–210.
Keeley, S. P. E., Sutton, R. T., & Shaffrey, L. C. (2012). The impact of North Atlantic sea surface temperature errors on the simulation of North Atlantic European region climate.Quarterly Journal of the Royal Meteorological Society,138, 1774–1783. https://doi.org/10.1002/qj.1912 Killworth, P. D. (1987). Topographic instabilities in level model OGCMs.Ocean Modelling,75, 9–12.
Large, W. G., & Yeager, S. G. (2009). The global climatology of an interannually varying air–seaflux data set.Climate Dynamics,33(2-3), 341–364. https://doi.org/10.1007/s00382-008-0441-3
Lavender, K. L., Davis, R. E., & Owens, W. B. (2000). Mid-depth recirculation observed in the interior Labrador and Irminger seas by direct velocity measurements.Nature,407(6800), 66–69. https://doi.org/10.1038/35024048
Lazier, J. R. N. (1994). Observations in the northwest corner of the North Atlantic Current.Journal of Physical Oceanography,24(7), 1449–1463.
https://doi.org/10.1175/1520-0485(1994)024%3C1449:OITNCO%3E2.0.CO;2
Madec, G. (2008). NEMO reference manual, ocean dynamic component: NEMO-OPA. InNote du Pôle modélisation,Inst. Pierre Simon Laplace, Fr. (Tech. Rep., 27).
Marshall, J., & Nurser, G. (1986). Steady, free circulation in a stratified quasi-geostrophic ocean.Journal of Physical Oceanography,16(11), 1799–1813. https://doi.org/10.1175/1520-0485(1986)016%3C1799:SFCIAS%3E2.0.CO;2
Meinen, C. S. (2001). Structure of the North Atlantic current in stream-coordinates and the circulation in the Newfoundland basin.Deep-Sea Research Part I: Oceanographic Research Papers,48(7), 1553–1580. https://doi.org/10.1016/S0967-0637(00)00103-5
Mellor, G. L., Mechoso, C. R., & Keto, E. (1982). A diagnostic calculation of the general circulation of the AtlanticOcean.Deep Sea Research,29, 1171–1192. https://doi.org/10.1016/0198-0149(82)90088-7
Mertens, C., Rhein, M., Walter, M., Böning, C. W., Behrens, E., Kieke, D.,…Stöber, U. (2014). Circulation and transports in the Newfoundland Basin, western subpolar North Atlantic.Journal of Geophysical Research: Oceans,119, 7772–7793. https://doi.org/10.1002/2014JC010019 Mertz, G., & Wright, D. G. (1992). Interpretations of the JEBAR term.Journal of Physical Oceanography,22, 301–305. https://doi.org/10.1175/
1520-0485(1992)022,0301:IOTJT.2.0.CO;2
Minobe, S., Kuwano-Yoshida, A., Komori, N., Xie, S.-P., & Small, R. J. (2008). Influence of the Gulf Stream on the troposphere.Nature,452(7184), 206–209. https://doi.org/10.1038/nature06690
Munk, W. H. (1950). On the wind-driven ocean circulation.Journal of Meteorology,7(2), 80–93. https://doi.org/10.1175/1520-0469(1950)007%
3C0080:OTWDOC%3E2.0.CO;2
Myers, P. G., Fanning, A. F., & Weaver, A. J. (1996). JEBAR, bottom pressure torque, and Gulf Stream separation.Journal of Physical Oceanography,26(5), 671–683. https://doi.org/10.1175/1520-0485(1996)026%3C0671:JBPTAG%3E2.0.CO;2
O’Reilly, C. H., Minobe, S., & Kuwano-Yoshida, A. (2016). The influence of the Gulf Stream on wintertime European blocking.Climate Dynamics, 47(5-6), 1545–1567. https://doi.org/10.1007/s00382-015-2919-0
Rieck, J. K., Böning, C. W., Greatbatch, R. J., & Scheinert, M. (2015). Seasonal variability of eddy kinetic energy in a global high-resolution ocean model.Geophysical Research Letters,42, 9379–9386. https://doi.org/10.1002/2015GL066152
Sarkisyan, A. S., & Ivanov, V. F. (1971). Joint effect of baroclinicity and bottom relief as an important factor in the dynamics of sea currents.
Izvestiya Academy of Sciences, USSR, Atmospheric and Oceanic Physics,7(2), 173–188.
Scaife, A. A., Arribas, A., Blockley, E., Brookshaw, A., Clark, R. T., Dunstone, N.,…Gordon, M. (2014). Skillful long-range prediction of European and North American winters.Geophysical Research Letters,41, 2514–2519. https://doi.org/10.1002/2014GL059637
Scaife, A. A., Copsey, D., Gordon, C., Harris, C., Hinton, T., Keeley, S.,…Williams, K. (2011). Improved Atlantic winter blocking in a climate model.Geophysical Research Letters,38, L23703. https://doi.org/10.1029/2011GL049573
Trenberth, K. E., & Caron, J. M. (2001). Estimates of meridional atmosphere and ocean heat transports.Journal of Climate,14(16), 3433–3443.
https://doi.org/10.1175/1520-0442(2001)014%3C3433:EOMAAO%3E2.0.CO;2
Tulloch, R., & Marshall, J. (2012). Exploring mechanisms of variability and predictability of Atlantic Meridional Overturning Circulation in two coupled climate models.Journal of Climate,25(12), 4067–4080. https://doi.org/10.1175/JCLI-D-11-00460.1
Urrego-Blanco, J., & Sheng, J. (2012). Interannual variability of the circulation over the Eastern Canadian Shelf.Atmosphere-Ocean,50(3), 277–300. https://doi.org/10.1080/07055900.2012.680430
Worthington, L. V. (1976).On the North Atlantic circulation. Baltimore, MD: Johns Hopkins University Press.
Yeager, S. (2015). Topographic coupling of the Atlantic overturning and gyre circulations.Journal of Physical Oceanography,45(5), 1258–1284.
https://doi.org/10.1175/JPO-D-14-0100.1
Zhai, X., Greatbatch, R. J., & Sheng, J. (2004). Diagnosing the role of eddies in driving the circulation of the northwest Atlantic Ocean.
Geophysical Research Letters,31, L23304. https://doi.org/10.1029/2004GL021146
Zhang, R., Delworth, T. L., Rosati, A., Anderson, W. G., Dixon, K. W., Lee, H.-C., & Zeng, F. (2011). Sensitivity of the North Atlantic Ocean circulation to an abrupt change in the Nordic Sea overflow in a high resolution global coupled climate model.Journal of Geophysical Research,116, C12024. https://doi.org/10.1029/2011JC007240
Zhang, R., & Vallis, G. K. (2007). The role of bottom vortex stretching on the path of the North Atlantic western boundary current and on the northern recirculation gyre.Journal of Physical Oceanography,37(8), 2053–2080. https://doi.org/10.1175/JPO3102.1