MEASUREMENTS AND SIMULATIONS OF SEEDED MICROBUNCHES WITH COLLECTIVE EFFECTS
K. Hacker*, R. Molo, S. Khan, DELTA, TU Dortmund,
S. Ackermann, J. Boedewadt, M. Dohlus, N. Ekanayake, T. Laarmann, H. Schlarb, DESY, Hamburg, Germany
L. L. Lazzarino, C. Lechner, Th. Maltezopoulos, T. Plath, J. Rossbach, Universitaet Hamburg, Germany
Abstract
Measurements of the longitudinal phase-space distri- bution of electron bunches seeded with an external laser were done in order to study the impact of collective effects on seeded microbunches in free-electron lasers.
When the collective effects of Coulomb forces in a drift space and coherent synchrotron radiation in a chicane are considered, velocity bunching of a seeded microbunch appears to be a viable alternative to compression with a magnetic chicane under high-gain harmonic generation seeding conditions. Measurements of these effects on seeded electron microbunches were performed with an RF deflecting structure and a dipole magnet which streak out the electron bunch for single-shot images of the longitudinal phase-space distribution. Particle tracking simulations in 3D predicted the compression dynamics of the seeded microbunches with collective effects.
INTRODUCTION
Seeding takes place when the electron bunch interacts with a laser pulse within an undulator magnet known as a modulator. The resulting sinusoidal energy modulation is transformed into a density modulation via longitudinal dispersion. For a seeded FEL using the High-Gain Harmonic Generation (HGHG) scheme, microbunch trains with the periodicity of the seed laser wavelength will radiate at a harmonic of the microbunch repetition rate when they are sent through an FEL radiator tuned to that harmonic; shorter microbunches will have higher harmonic content [1,2].
The longitudinal dispersion used to compress microbunches is typically provided through the energy- dependent path in a series of bending magnets which compose a magnetic chicane, but this will result in coherent synchrotron radiation (CSR) emitted by the tail of the bunch early in a bend catching up with the head of the bunch, producing an inhomogeneous energy loss along the bunch which is proportional to the peak current, bend radius, and bend length [3,4]. While typically of concern on the macrobunch scale due to nonlinear chirps which broaden the FEL spectrum, CSR is also of concern when it changes the energy, energy spread, or bunch length on the microbunch scale. Since the harmonic content of a seeded beam is given by the Fourier transform of the longitudinal current distribution, a change in the microbunch length has a direct impact on the high harmonic content. Here, we present simulations
and measurements of the effect of CSR on the longitudinal phase-space distributions of seeded electron microbunches compressed in a chicane and we contrast it with the effect of Coulomb forces on seeded electron microbunches which are primarily compressed through velocity bunching in a drift space with quadrupole focusing optics.
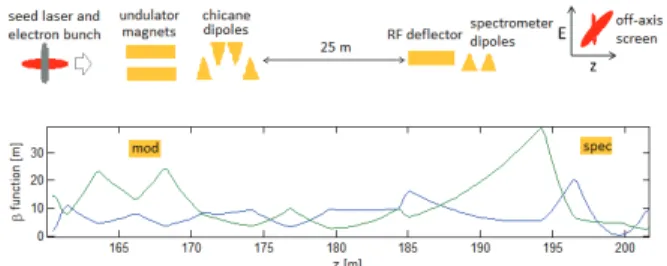
In [5], the concept that Coulomb forces and velocity bunching could be used to reduce the energy spread for soft X-ray HGHG applications was investigated due to the requirement that the HGHG seeded beam in a proposed seeding design would need to drift for 20 meters before entering the radiator. Here, a condensed presentation is given of measurements and 3D simulations [6] performed with conditions at the Free-electron Laser in Hamburg (FLASH). The investigation of these microbunch collec- tive effects was done with an RF deflector and dipole spectrometer which streak out a 700 MeV electron bunch for single-shot measurements of the particle distribution in longitudinal phase-space (Fig. 1). Quantitative agree- ment with simulations was observed within the error bars of the measurements and original physical interpretations are used to explain new effects discovered in the meas- urement method.
Figure 1: Layout of experimental setup. A seed laser is used to modulate the energy of the electron beam. The energy modulation is converted into density modulation through dispersion in a chicane, a drift, or in the dipoles of the spectrometer. The longitudinal phase space dist- ribution is measured on an off-axis screen after the RF deflector and spectrometer.
MEASUREMENTS
Longitudinal phase space distribution measurements done at the Free-electron Laser in Hamburg (FLASH) are compared to particle tracking simulations for different compression settings of the chicane at the entrance to a 25-m long stretch of beamline with a beta-function which varies from 3 to 23 m and an average beam radius of
*kirsten.hacker@desy.de
Germany
WEP031 Proceedings of FEL2015, Daejeon, Korea
ISBN 978-3-95450-134-2 650
Copyright©2015CC-BY-3.0andbytherespectiveauthors
Seeded FELs
135 ȝm (rms). The measurements were conducted with an RF deflector [7-9] which streaks out the longitudinal dimension of the electron bunch in the vertical direction.
A dipole magnet horizontally deflects the electrons depending on their energies. The screen is rotated by 90 degrees, so that the vertical direction is the energy axis and the horizontal direction is the longitudinal axis.
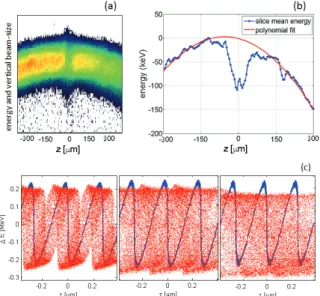
In Fig. 2, we show a measurement of an uncompressed electron bunch with a region which has been seeded with a 60 fs (FWHM) pulse of 266 nm light. The chicane at the entrance to the drift was off. Due to CSR from in the first few centimeters of the spectrometer dipole, the average energy of the seeded region has been reduced relative to that of the surrounding particles.
Figure 2: Measurement of seeded electron beam streaked out horizontally in time and vertically in energy (a) and measured average energy of longitudinal slices of the electron beam (b). In (b), the average energy of the seeded slices is lowered by 90 keV for a 56 A initial peak current and (700 300) keV of energy modulation with a 266 nm ١ seed duration of (100 50) fs (FWHM). A CSRtrack ١ simulation of a microbunched beam with a 7 keV slice energy spread prior to 400 keV (peak-to-peak) energy modulation is shown in (c) as it travels through the first 3 centimeters of the spectrometer. Prior to bunching, the peak current is 56 A and afterwards, it is 300 A. The blue, sinusoidal pattern is the particle distribution at the entrance to the bend. The red pattern shows that after 10 mm, the mean energy of the seeded portion has dropped by 15 keV, after 20 mm it has dropped by 25 keV, and above 30 mm, it has dropped by 50 keV.
In a measurement of the effect of the LSC wake on a beam seeded with 800 nm (Fig. 3), the longitudinal dispersion of the chicane directly after the modulator was scanned from zero up past Ș = 250 ȝm in order to measure the macroscopic effect of uncompressed (a), under- compressed (b), fully-compressed (c), and overcompres- sed (d)-(e) microbunches. Simulations of microbunches with an initial energy modulation of 1.3 MeV (rms) (f)-(j) are shown below each measurement (a)-(e). They corres-
pond to conditions at the center of the seeded region of the measurements and were done in 3D with periodic boundary conditions [10]. Simulations of microbunches at a distance of ı from the center of the seeded region used an initial energy modulation of 0.65 MeV (rms) and they are plotted in (k)-(o).
The explanation of each macrobunch measurement (Fig. 3 top row) relies on controlled LSC impedances on the microbunch scale (bottom rows). For Ș = 20 ȝm, shown in column (a), the initial energy modulation profile was weakly affected by the LSC impedance because of the low peak current of the microbunches at the entrance to the drift space. In (b), where Ș = 50 ȝm, the micro- bunches are slightly undercompressed at the entrance to the drift space and the energy modulation for the majority of the particles is strongly reduced via the LSC impedance, despite the fact that a small fraction of extremely off-energy particles cause the rms energy spread to increase (g).
When the longitudinal dispersion is increased to 100 ȝm in (c), regions of increased and decreased energy spread are observed along the seeded portion, correlating with the peak current of the individual microbunches at the entrance to the drift. The central electrons of the seeded portion of (c) have an energy spread increase, as in (h), and the directly adjacent electrons have an energy spread reduction, as in (g). The behavior of the tails will be described later. As the central microbunches are folded over with 200 and 250 ȝm of dispersion, the wings of the seeded portion show an energy spread increase as they become fully (d) and overcompressed (e). The behavior of the tails is likely due to a distortion of the tails of the seed laser pulse, however, a peak current dependent transverse effect of CSR has not been fully ruled out.
Simulations of the RF deflector measurements were done using particle distributions transported with transfer matrices [11,12] in order to generate the color code which was used to interpret the slice energy spreads of the seeded regions of Fig. 3(a)-(e). The warmer colors correspond to decreased phase space density, a parameter which is inversely correlated with slice energy spread.
The vertical dimensions of beam slices shown in the measurements roughly correspond to the slice energy spread of the beam at a given longitudinal position, however an absolute measurement of the slice energy spread from this data is affected by many factors, and for that reason, we employ a self-consistency analysis of relative changes dependent upon microbunch compres- sion and peak current at the entrance to the drift.
The energy modulation is not purely in the vertical direction, due to a combination of longitudinal and vertical dispersion in the horizontally deflecting spectrometer. When temporal smearing of sharp structures is present, the color code has a systematic error in a direction which is opposite to that of the surrounding structures. This error is indicated by the dashed lines in Fig. 3.
In order to produce the pattern observed in Fig. 3(a)-(e), the slice energy spread of the central region must evolve Proceedings of FEL2015, Daejeon, Korea WEP031
Seeded FELs
ISBN 978-3-95450-134-2 651 Copyright©2015CC-BY-3.0andbytherespectiveauthors
Figure 4: Simulation of the final rms energy spreads of seeded microbunches with initial energy modulations of 0.65 and 1.3 MeV (rms) corresponding to particles at ı and the peak of the seeded region in Fig. 3(a)-(e). Energy spread values derived from Fig. 3(a)-(e) are plotted as red and blue squares. The point labeled (i) corresponds to the expected energy modulation for measured laser and un- dulator parameters. Horizontal bars reflect the uncertainty in magnet hysteresis. The dashed lines extending upwards and downwards indicate measurement points which had a possible systematic error due to temporal smearing of sharp structures.
according to the upper curve of Fig. 4 while the surrounding regions at ı follow the lower curve. All data points at the peak of the seed and at a distance of ı from the peak follow the general pattern of the simulation and within the error bars of the laser and RF deflector measurements, the macroscopic changes in slice energy spread shown in Fig. 3(a)-(e) are in agreement with the simulated dynamics of the fine structures in Fig. 3(f)-(o).
The deviation of measurement point (e) from the model in Fig. 4 can be explained through laser heater concepts [13] which make use of the interaction of adjacent cycles which have unequal amplitudes. The explanation of the behavior of the tails for case (c) requires a non-Gaussian seed pulse with higher than expected energy modulation in the tails. Seeding experiments with drift spaces are required to further understand the implications for the preservation of fine structures as required for the HGHG microbunch compression in a drift or for LSC-EEHG concepts [14].
Figure 3: Measured longitudinal phase-space distribution of a seeded electron beam under the influence of LSC for uncompressed Ș = 20 ȝm (a), undercompressed, Ș = 50 ȝm (b), fully-compressed, Ș = 100 ȝm (c) and overcompressed Ș = 200-250 ȝm (d-e) microbunches. The color code corresponds to the number of electrons hitting the camera's pixels and is described in the text. Simulated longitudinal phase space distribution of microbunches after the 25 meter drift for the conditions described in (a)-(e) are below each measurement. Row (f)-(j) corresponds to the conditions at the center of the seeded region with an initial energy modulation of 1.3 MeV (rms) and an inital peak current of 300 A. Row (k)- (o) corresponds to the conditions at a distance of ı from the center of the seed with an inital energy modulation of 0.65 MeV (rms). The beam energy was 700 MeV with an average radius of 135 ȝm in the drift space. The head of the bunch is to the left and the peak current drops from 300 A to 250 A along the seeded portion. The emittance in the simulations is 1 mm mrad and the slice energy spread was 70 keV (rms).
WEP031 Proceedings of FEL2015, Daejeon, Korea
ISBN 978-3-95450-134-2 652
Copyright©2015CC-BY-3.0andbytherespectiveauthors
Seeded FELs
CONCLUSION
Simulations and measurements suggest that for beams with loose focusing and limited peak current, velocity bunching can produce a seeded microbunch with a sma- ller energy spread compared to the method of compres- sion with a magnetic chicane. In support of this concept, RF deflector measurements showed the expected reduc- tion of the slice energy spread of seeded microbunches after velocity bunching and the expected reduction of the average energy of seeded microbunches under the influence of CSR. The dependence of these reductions on longitudinal dispersion and peak current were in agreement with simulation. Concerns over the impact of microbunching instability coming from upstream of the seeding section did not manifest in the data but are not ruled out.
ACKNOWLEDGEMENTS
The authors would like to thank FLASH and the M- Division staff at DESY for their support. This work was funded by the Helmholtz Association Accelerator Re- search and Development program, the Federal Ministry of Education and Research of Germany under contract No.
05K10PE1, 05K10PE3, 05K13GU4, and 05K13PE3, and the German Research Foundation program graduate school 1355.
REFERENCES
[1] L.H. Yu, Phys. Rev. A 44,5178 (1991).
[2] E. Allaria et al., Nature Photonics, 6, 699-704 (2012).
[3] Ya.S. Derbenev, J. Rossbach, E.L. Saldin, V.D.
Shiltsev, DESY FEL Report No. TESLA-FEL 95-05, 1995.
[4] E.L. Saldin, E.A. Schneidmiller, M.V. Yurkov, DESY FEL Report No. TESLA-FEL 97-08, 1997.
[5] K. Hacker et al., DESY FEL Report No. TELSA- FEL 2013-01.
[6] K. Hacker et al., submitted for publication Oct. 2014.
[7] O. Altenmueller, R. Larsen, G. Loew, Rev. Sci.
Instrum. 35, 438 (1964).
[8] P. Emma, J. Frisch, P. Krejcik, SLAC Report No.
LCLS-TN-00-12, (2000).
[9] C. Behrens, Ch. Gerth, and I. Zagorodnov, Proc. FEL Conf., WEPC45, Liverpool, United Kingdom, 2009.
[10] M. Dohlus, Ch. Henning, Periodic Poisson Solver for Particle Tracking, DESY 15-071.
[11] K.L. Brown, SLAC Report-75, (1982).
[12] K. Bongardt, CERN report No: LA-8668-MS, (1981).
[13] Z. Huang, M. Borland, P. Emma, J. Wu, C. Limborg, G. Stupakov, J. Welch, Phys. Rev. ST Accel.
Beams 7, 074401 (2004).
[14] K. Hacker, Phys. Rev. ST Accel. Beams (2013).
Proceedings of FEL2015, Daejeon, Korea WEP031
Seeded FELs
ISBN 978-3-95450-134-2 653 Copyright©2015CC-BY-3.0andbytherespectiveauthors