Britain’s visible minorities: a demographic overview
Roger Ballard
1 Ethnic questions in the Census
Although questions about the current size – as well as the likely future growth – of the minority components of the population tend to stir up strong public reactions, providing accurate answers to what might seem to be some straightforward questions is still an extremely challenging task. Whilst the starting point for any kind of demographic analysis is the comprehensive population count made in the Census, it was not until 1991 that a specifically formulated question was included in the UK exercise: prior to that all estimates had to rely on the results of the Country of Birth question. This was intrinsically problematic, however. Quite apart from the fact that such figures included a significant (but unknown) number of people of wholly indigenous ancestry had been born overseas, country of birth statistics can only identify the first generation of true immigrants: the UK-born children of migrant parentage are necessarily overlooked. To be sure this deficiency could be partially remedied by collating the figures for all those living in households headed by a person born in specific locations overseas – as was done after the 1981 Census – but the more a second and then a third generation emerge into adulthood, the more inadequate this procedure becomes.
Yet although the inclusion of an explicit question about ethnic affiliation in the 1991 Census was undoubtedly a welcome advance, there were a number of severe deficiencies in the format of the question which was actually deployed. For example:
• Since the question offered no an explicit indication as to whether ‘ethnic group’ should be understood as being a consequence of differences in biological descent, of community affiliation or of birthplace, it could be – and was – interpreted in different ways by different groups of respondents.
• Whilst the question provided a range of non-European groups with an opportunity to identify themselves in ethno-national terms, it encouraged virtually everyone else (and especially members of the indigenous majority) to identify themselves racially as White; and even when respondents sought to offer a less racist form self-definition (although remarkably few did so), they were invariably reclassified as white during the coding process.
• As a result of these procedures many smaller minority groups, such as the Arabs, the Yemenis,
and the Greek and Turkish Cypriots, let alone members of Britain’s many invisible minority
communities, such as the Jews, the Irish Catholics and the Poles have been disappeared from statistical sight. As a result they are rarely, if ever, referred to in discussions of ethnic plurality..
• Last but not whilst ethno-national labels such as Indian, Pakistani, Chinese and Black African may appear to be sensible and useful identifiers as far as outside observers are concerned, they are by no means necessarily congruent with the minority communities’ internal realities. Hence each of these categories – now reinforced through their routine use in the census and all commentaries built upon it – conceals more than it reveals. Data-collection exercises which are unable to resolve the differences between such substantial communities as the Gujarati Hindus and the Punjabi Sikhs, or between the Punjabi and Kashmiri Pakistanis, can only be regarded as deficient.
Even so, something is better than nothing, and the results of the 1991 Census, together with the results of many other surveys and data-gathering exercises which have deployed the same set of ethnic categories as those used in the Census, means that we are now in a position to construct a far more detailed – as well as a far more accurate – picture of the major components of the visible minority presence in Britain than we could do before.
1.1 Measuring pluralism: the construction of an ethnic question
1Although there was very real prospect that an ethnic question might be included in the 1981 Census, difficulties in formulating a question which would be acceptable to Afro-Caribbean respondents, reinforced by a last minute Prime Ministerial intervention by Margaret Thatcher led to its exclusion from the Census schedule. However following a strongly favourable report by the Home Affairs Select Committee the consensus began to shift, and there was little opposition to its inclusion in the 1991 exercise.
Yet although the decision to make a formal note of the ethnic affiliation of every citizen was a quite unprecedented development, since it not only entailed a formal acknowledgement that Britain is – and is likely to remain – an plural society, but also that ethnic diversity is an issue which can and should routinely be taken into account in the formulation of public policy, remarkably little analytical attention was given to the wording of the question which was actually posed. Hence before considering the results of the exercise threw it is worth considering just how the question itself was actually constructed, and hence what it can and cannot tell us.
1
A fuller discussion of the issues explored in this section can be found in Ballard (1997).
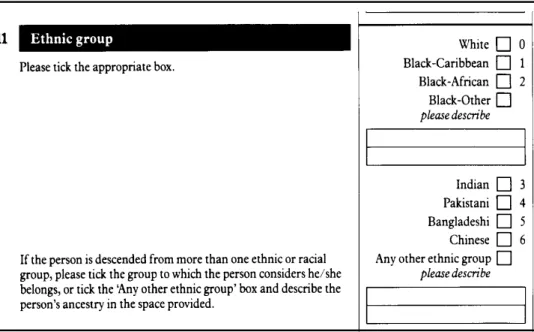
Figure 1 The “Ethnic Group” question in the 1991 Census
Although the question actually posed in the Census offered no specific indication as to how the term
“Ethnic Group” should be understood, the format nevertheless proved acceptable to the population at large: no less than 98.6% of respondents ticked one or other of the labelled boxes, and only 1.4%
took advantage of the write-in option, making the coding of the results a very straightforward task.
Yet despite the ease with which the question ‘worked’ in administrative terms, it does not necessarily follow that the bodies of people associated with each of the labels which the census authorities constructed necessarily constitute form ethnic groups in any very meaningful sociological sense.
So, for example, whilst no less than 94% of those who ticked a labelled box did so in such a way as
to identify themselves White, a moment’s reflection reveals that White is a racial, not an ethnic
category. This is far from mere wordplay. Not only did this procedure write indigenous British
pluralism out of the agenda by removing the possibility of the Welsh, the Scots and the Irish – let
alone the English! – to identify themselves as such, but it also provided members of many other
more or less invisible minorities such as the Jews, the Greek and Turkish Cypriots, and the Arabs
with what they may well have regarded as a welcome opportunity not to associate themselves with
any of the racially excluded minorities, and instead to identify themselves as White (Ballard and
Kalra, 1994). From this perspective the label White can best be understood as a carefully
constructed umbrella under which everyone who does not consider themselves to belong to any of
the other labelled categories can, and indeed should, take shelter. The underlying logic of the whole
exercise then becomes all too clear. To the extent that all the other labels are associated with one
form or another of non-Europeanness, the category White stands as its logical inverse. If so the otherwise puzzling acceptability of White as identifier by the vast majority of the population begins to make greater sense: it provided an opportunity an opportunity for members the dominant majority to identify themselves as not non-white.
But if that is so, why were the other five more specifically ethnic labels included in the question?
The answer is obvious enough. Whilst obsessive concern with the social significance of skin colour serves to explain the contorted modes of thinking just outlined, those who have found themselves marginalised as a result of exposure to this kind of racist myopia have refused – sensibly enough – to buy into this mode of thinking on their own account. Hence members of Britain’s Indian, Pakistani, Bangladeshi and Chinese communities – whether immigrant or British-born – have insisted that their national origins should be the basis of their ethnic self-identification. By contrast the Black-Caribbean, Black-African and Black-Other labels which the census has brought into routine use introduce further complexities, since they combine skin-based and ethnic identifiers.
Two very different issues are at stake here. The first is relatively simple: the label Black African provides a convenient means for people of indigenous African descent to distinguish themselves from East African Asians – the vast majority of whom currently prefer to identify themselves ethnically as Indian. However the Black Caribbean case has presented some much deeper challenges. Whilst most of the older generation of migrants are happy enough to identify themselves as Caribbean, many of their British-born children have been most reluctant to associate themselves with such an identifier, on the grounds that it suggested that they were not British; hence categories such as Black British and Black other were constructed to answer to their concerns. But however reasonable those concerns may be, the solution devised to deal with have been – at least from a statistical perspective – quite disastrous. Although those people whose ancestral roots lie in the Caribbean (and beyond that in Africa) undoubtedly form an ethnically distinctive community, the way in which the Ethnic Group question was formulated is such that a straightforward statistical read-out distributes its members into two quite separate population categories. Since this can easily lead to wholly misleading conclusions, the census figures for Black Caribbeans and Black Others have been combined under the label Afro-Caribbean in most Tables in this Chapter.
1.2 Britain as a plural society: a demographic overview
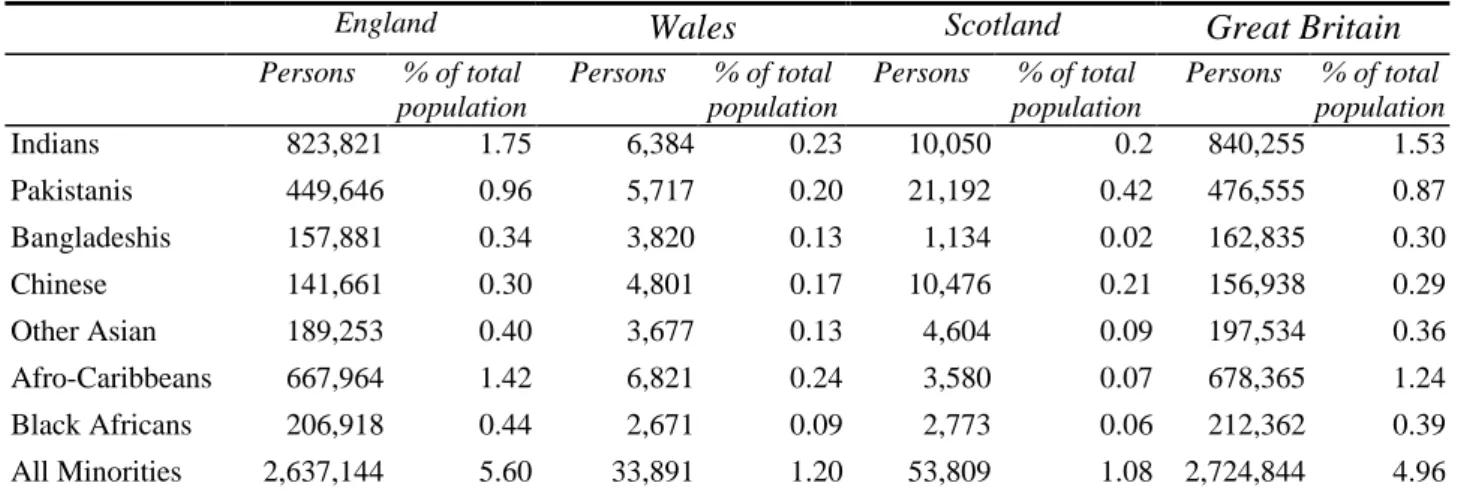
As Table 1 demonstrates, Britain’s non-White population is particularly heavily concentrated in
England, where 5.6% of the population as a whole identified themselves as belonging to one or
other of the visible minorities in 1991, whilst in both Wales and Scotland that figure barely
exceeded 1%. It is also worth remembering that within England itself there are further spatial imbalances, with the result that the minority population is still very heavily concentrated in those areas where its members found employment when they first arrived: in the London region (where nearly 50% of the visible minority population is now concentrated), in the industrial cities of the east and west Midlands, in centres of steel manufacturing such as Sheffield and Scunthorpe, and in all the textile towns in the Pennine region. In such contexts, and especially in the local areas within each city where members of the new minorities have clustered together, their proportionate presence in the population is very much higher.
England Wales Scotland Great Britain
Persons % of total population
Persons % of total population
Persons % of total population
Persons % of total population
Indians 823,821 1.75 6,384 0.23 10,050 0.2 840,255 1.53
Pakistanis 449,646 0.96 5,717 0.20 21,192 0.42 476,555 0.87
Bangladeshis 157,881 0.34 3,820 0.13 1,134 0.02 162,835 0.30
Chinese 141,661 0.30 4,801 0.17 10,476 0.21 156,938 0.29
Other Asian 189,253 0.40 3,677 0.13 4,604 0.09 197,534 0.36
Afro-Caribbeans 667,964 1.42 6,821 0.24 3,580 0.07 678,365 1.24
Black Africans 206,918 0.44 2,671 0.09 2,773 0.06 212,362 0.39
All Minorities 2,637,144 5.60 33,891 1.20 53,809 1.08 2,724,844 4.96
Table 1 Regional distribution of the visible minority populations in Great Britain Source: 1991 Census, Ethnic Group and Country of Birth, Table 6.
It is always worth remembering that whilst large scale surveys such as the census can throw up a
richly illuminating picture of the social and demographic characteristics of a given population
group, that picture is by definition a snapshot in time, for the underlying social reality may well be
changing rapidly. This is most certainly so in the case of Britain’s visible minority populations, for
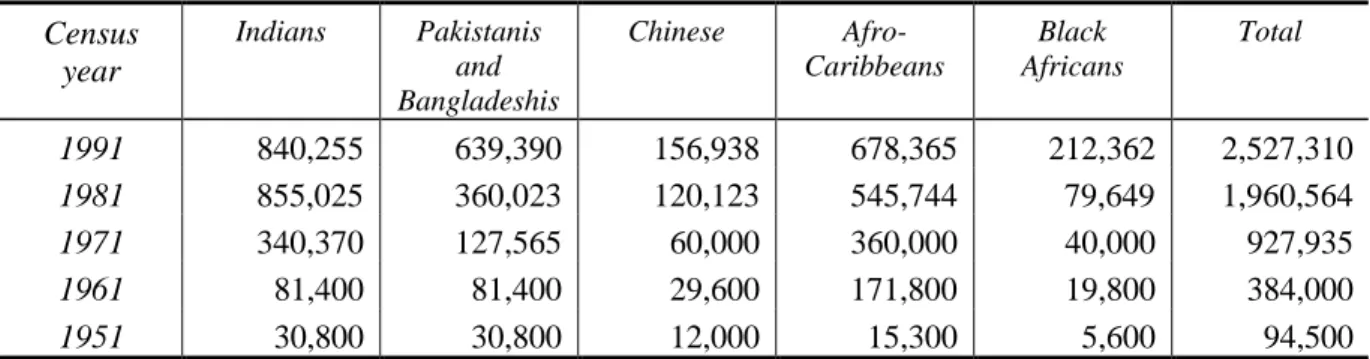
as Table 2 shows, this section of the population has been growing extremely rapidly ever since mass
migration began in the aftermath of the second world war. Moreover the figures in Table 3 suggest
that there is every reason to expect that even in the unlikely event of further immigration from the
non-European world being brought to an absolute halt, this pattern of growth will sustained for
many decades to come, given that the scale of the minority presence in the very youngest age cohort
of 0 – 4 year olds is almost double the mean level for the population at large. With this in mind it is
worth subjecting what we know about the migratory and the demographic characteristics of each
section of the visible minority population to close scrutiny to establish their likely pattern of future
growth.
Census year
Indians Pakistanis and Bangladeshis
Chinese Afro- Caribbeans
Black Africans
Total
1991 840,255 639,390 156,938 678,365 212,362 2,527,310 1981 855,025 360,023 120,123 545,744 79,649 1,960,564 1971 340,370 127,565 60,000 360,000 40,000 927,935 1961 81,400 81,400 29,600 171,800 19,800 384,000 1951 30,800 30,800 12,000 15,300 5,600 94,500 Table 2 Estimated size of the major components of Britain’s visible minority populations:
1951 – 1991
Sources: 1991 Census Ethnic Croup Tables, 1981 Census Country of Birth of Household Head Tables, 1971 Census Country of Birth Tables, and EJB Rose (1969) Table 10.1
All ages Aged 0 - 4
Persons % of total population
Persons % of total population Whites 51,873,794 94.51 3,298,674 90.79
Indians 840,255 1.53 74,042 2.04
Pakistanis 476,555 0.87 62,576 1.72
Bangladeshis 162,835 0.30 24,526 0.68
Chinese 197,534 0.36 15,842 0.44
Other Asian 156,938 0.29 11,129 0.31 Afro-Caribbeans 678,365 1.24 73,964 2.04 Black Africans 212,362 0.39 25,115 0.69 All Minorities 2,724,844 4.96 287194 7.9
Table 3 Ethnic diversity in Britain: the relative size of each group in the 0 – 4 year old age cohort as compared with the population at large.
Source: 1991 Census : Ethnic group and Country of Birth Volume, Table 6.
1.3 Population growth amongst the visible minorities: a case by case exploration
In considering the likely trajectory of population growth amongst Britain’s minority populations,
two main factors need to be borne in mind: firstly the relative balance of immigration and
emigration, and secondly that between births and deaths. However the factors which give rise to
such outcomes are not only extremely complex, but also tend to be community-specific: hence a
detailed knowledge of the history, of the socio-geographical trajectories, and above all of the
dynamics of fertility and family-building within each community is vital to the successful
completion of such an exercise. Moreover once such information is available, it not only throws a
great deal of light on the demographic characteristics of each section of the minority population, but
also provides a good indication as to its likely pattern of growth in the immediate future.
1.3.1 The Pakistanis
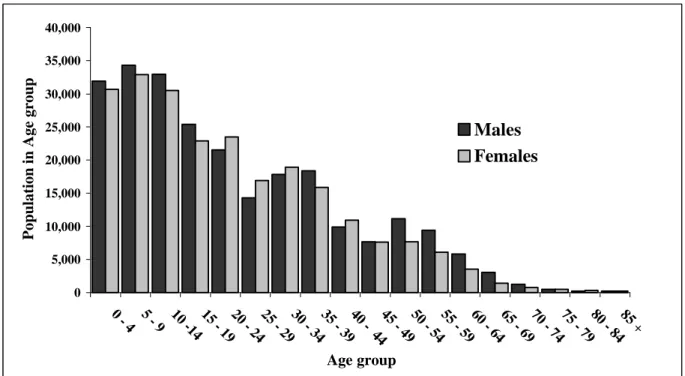
With this in mind it is worth subjecting the distribution of Britain’s Pakistani population across the age spectrum to close scrutiny, since it not only provides a clear indication of the way in which each group’s migration history, together its members’ equally distinctive patterns of fertility and marriage choice, have interacted to precipitate a specific demographic outcome, but also shows how the impact of these specificities is likely to be felt for many years to come.
Figure 2: Distribution of Britain’s Pakistani population by age and sex Source: 1991 Census: Ethnic group and Country of Birth Volume, Table 6.
As is dramatically evident from Figure 2, Britain’s Pakistani population is very sharply skewed across the age spectrum: hence whilst it still only contains a minute number of elderly people, the number of young people under the age of 15 is disproportionately large. Moreover close inspection of the figures also reveals a distinct “wave”, most particularly amongst men, with clear peaks at 15- year intervals, the first amongst the 50 – 59 age cohort, the second amongst the 30 – 39 age cohort, and the third amongst children aged between 5 and 14. Whilst the data itself can provide no clues as to the origins of these outcomes – since Census figures are by definition a freeze-frame snapshot of complex on-going processes – these patterns can easily be explained given some knowledge of this population’s migratory history. Mass migration from Pakistan took off almost exponentially in the early 1960s, and although the 1962 Immigration Act was designed to curb this inflow by excluding all those who did not have jobs to go to, established Pakistani migrants, many of whom worked in the still labour-hungry textile mills in the Pennine region, proved particularly adept at obtaining employment vouchers on behalf of kinsmen back home. Hence – paradoxically enough – the inflow
0 5,000 10,000 15,000 20,000 25,000 30,000 35,000 40,000
0 - 4 5 - 9 10 -14 15 - 1920 - 2425 - 29 30 - 3435 - 3940 - 4445 - 4950 - 5455 - 59 60 - 6465 - 6970 - 74 75 - 7980 - 8485 +
Age group
Population in Age group
Males
Females
from Pakistan actually increased in the immediate aftermath of the introduction of the new rules, although it then dropped very sharply when the issue of such vouchers was halted in 1965.
Most of the men who came to work in Britain in this early period were young adults aged between twenty and thirty; three decades on they were aged between fifty and sixty. However legislative changes introduced during the late 1960s effectively excluded a slightly younger age cohort: hence come 1991, we find a sharp dip in the number of men in their forties. However that dip did not last for long, since there is a substantially larger peak amongst men in their thirties. This also has a relatively straightforward explanation. Whilst Immigration legislation placed ever tighter constraints on the entry of additional adult males, men who were already settled in Britain had an unchallengeable right – as Commonwealth citizens – to reunite their families. Hence the peak amongst men (and women) aged between 30 and 39 is largely composed of the Pakistani-born offspring of the original wave of migrant workers, but who were brought to Britain in a process of family reunion before they reached adulthood. A further point worth noting is that the peak amongst 30-39 year olds is roughly twice as large as that amongst those aged 50-59. This is readily explicable in terms of high levels of fertility (4+ children per mother) both in Pakistan itself, and amongst Pakistani settlers in Britain. The reduced numbers amongst those aged between 25 and 29, as well the even larger size of the three youngest cohorts can also be explained on a similar basis.
Over and above these largely historical factors, an important additional dynamic has recently begun to emerge: the frequency with which members of the younger – and by now overwhelmingly British-born – generation of Pakistanis are continuing to find spouses from amongst their kin back home. Not only has, this option has been much more strongly sustained amongst Pakistani Muslims than by any other group of South Asian settlers in Britain, largely as a result of their strong preference for arranging marriages between cousins (Ballard 1990), but recent research in Bradford suggests that 57% of young Bradford Pakistanis married partners from overseas(Simpson 1997).
In the light of all this it is quite clear that Britain’s Pakistani population will continue to follow its
current pattern of very rapid growth for many years to come. Even if its members’ fertility rate was
to fall to near replacement rate tomorrow, and even if no further immigration occurred, the levelling
out the present age skew would ensure that in the long run numbers would eventually stabilise at
approximately double its present level. But since the mean fertility rate amongst British Pakistanis
is still closer to 4.0 than the replacement level of 2.0, and given that the recruitment of such a large
number of spouses (of both sexes) from overseas will substantially increase the number of mothers
available to give birth, there is every prospect that Britain’s Pakistani population will more than double its present size before too long.
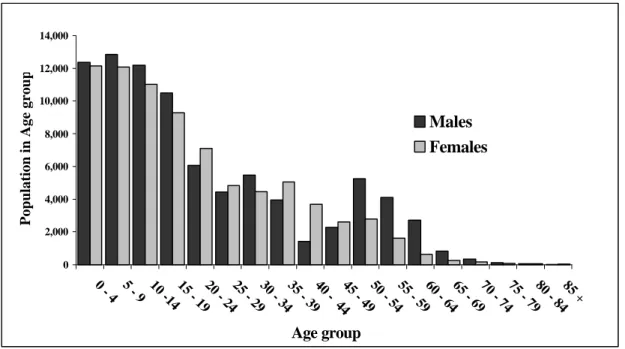
1.3.2 The Bangladeshis
At least at first sight the demographic profile of the Bangladeshi population (Figure 3) is very similar to that of the Pakistanis: once again there is a clear “wave” effect, particularly amongst men, and even though the peak amongst men in the 30-39 year old age cohort may somewhat attenuated, the reverse is the case amongst the very youngest age cohorts. Once again these differences fall into place in the light of the Bangladeshi’s migration history. Although they initially responded to changes in immigration legislation in much the same way as the Pakistanis, and hence made extensive use of the voucher system, they differed in so far as they delayed reuniting their families in Britain for very much longer. But although that process did not get into full swing until the early eighties, and even today is still far from being wholly complete, the Bangladeshis – although Muslims too – are much less strongly committed to cousin marriage than are the Pakistanis. Hence even though the parents of young British Bangladeshis are still keen to seek out well-connected spouses for their offspring from back home, there are strong indications that the frequency of such matches is set to drop sharply, such that young British Bangladeshis will increasingly tend to marry each other.
Figure 3: The distribution of Britain’s Bangladeshi population by age and sex Source: 1991 Census: Ethnic group and Country of Birth Volume, Table 6.
Nevertheless even if it is the case that the arrival of additional spouses from overseas proves to be less marked in the Bangladeshi than the Pakistani case, the sheer weight of numbers in the 0 – 14
0 2,000 4,000 6,000 8,000 10,000 12,000 14,000
0 - 4 5 - 9 10 -14 15 - 1920 - 2425 - 2930 - 3435 - 3940 - 4445 - 4950 - 5455 - 5960 - 6465 - 6970 - 7475 - 7980 - 8485 +
Age group
Population in Age group
Males
Females
age cohorts means that it would be wholly unreasonable to expect that this section of population eventually to stabilise at anything less than double its present level, and in all probability substantially more.
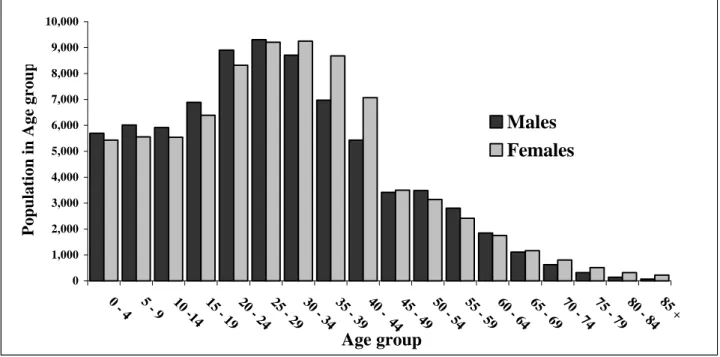
1.3.3 The Indians
By contrast with the Pakistanis and Bangladeshis, Britain’s Indian population is clearly a great deal closer to equilibrium, since its age cohorts are all roughly equal in size right up to that composed of 35-39 year olds, even though there is a comparatively steep drop thereafter. Once again a knowledge of immigration history enables us to put this into perspective. Firstly the initial phase of mass male migration took place in the late nineteen fifties and early nineteen sixties: hence the relative paucity of people who had reached retirement age in 1991, although numbers have clearly grown rapidly since then; secondly the Indians moved far more quickly towards reuniting their families in Britain than did their Pakistani and Bangladeshi peers; and thirdly there is clear evidence that whilst the fertility rate of Indian settlers was initially almost as high as that amongst the Pakistanis and Bangladeshis, it has since declined to a level which is not much greater than that found amongst the indigenous population.
Figure 4: Distribution of Britain’s Indian population by age and sex Source 1991 Census: Ethnic group and Country of Birth Volume, Table 6.
But although this goes a long way towards explaining the pattern displayed in Figure 4, it is by no means the whole story, especially if one compares the figures for Britain’s Indian population which can be derived from the 1981 Census with those thrown up in 1991, which suggests that Britain’s Indian population has marginally decreased in size over the decade. There are, of course, some
0 5,000 10,000 15,000 20,000 25,000 30,000 35,000 40,000 45,000
0 - 4 5 - 9 10 -14 15 - 19 20 - 24 25 - 29 30 - 34 35 - 39 40 - 4445 - 49 50 - 54 55 - 59 60 - 64 65 - 69 70 - 74 75 - 79 80 - 84 85 +
Age group
Population in Age group
Males
Females
problems with the figures themselves, since the estimate for 1981 is based on the sum of all those persons living in a household which was headed by a person born either in India, or in East Africa, but nevertheless a careful comparison of the age and gender related figures from the two censuses suggests that around 150,000 people whom one might expect to find were missing by 1991. This suggests that during the 1980’s the number of emigrants was substantially greater than the number of immigrants in this section of the population.
Once again a qualitative knowledge of developments within the community offers an explanation as to how that might be. Although in-migration – particularly of spouses – from India continued to occur during the period (and the census figures show that the deficiency in numbers is least salient amongst those in their late 20s and early 30s), this was more than matched by a parallel process of out-migration, not so much back to India itself, but rather onwards to the United States and Canada.
The majority of such migrants were young adults, usually with advanced educational and professional qualifications, but who had grown frustrated by the forces of racial exclusionism they so routinely encountered in Britain; as word began to circulate that those constraints were far less intense on the other side of the Atlantic, and ever increasing number of young British Indians appear – given the results of the 1991 Census – to have taken the opportunity to move on yet further to take advantage of the better opportunities elsewhere.
1.3.4 The Chinese
At first sight the figures for Britain’s Chinese population appears to be extremely bizarre, for whilst
the right-hand portion of the population distribution shown in Table 5 follows the pattern which we
have now come to expect, with a peak amongst men in their fifties, a pause, and then a family-
reunion precipitated pattern of rapid growth; however this is followed by what appears to be a
marked deficiency of young people of school age. How is this to be explained? What this appears to
reflect is not so much a growing tendency of young British Chinese to send their children back to
Hong-Kong for their education – a plausible explanation for which there is no evidence – but rather
that a radical process of demographic transition is taking place. Thus just like members of many
other overseas Chinese communities – as in Singapore, for example – Britain’s young and rapidly
upwardly mobile Chinese professionals (see Chapter **) are delaying having children, and in any
event are planning to build much smaller families than did their parents. Hence they are producing
children at a much lower than replacement level. With that in mind, let alone the fact that the
Chinese seem just as likely as their Indian peers to be plotting their future careers within the context
of a global labour market, there is a real prospect that Britain’s Chinese population will shrink
rather than grow in the years to come.
Figure 5: Distribution of Britain’s Chinese population by age and sex Source 1991 Census: Ethnic group and Country of Birth Volume, Table 6.
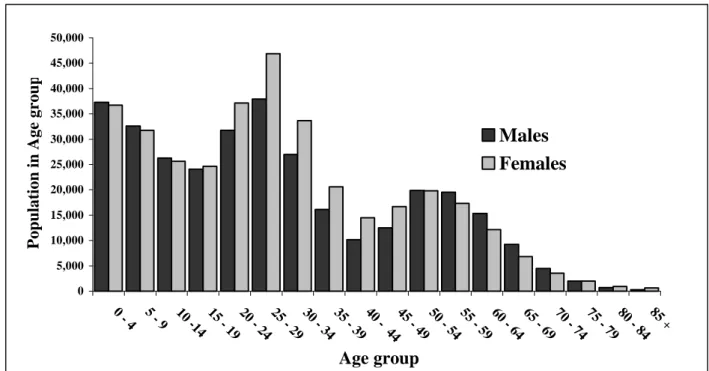
1.3.5 The Afro-Caribbeans
Making sense of the data on Britain’s Afro-Caribbean population presents some even greater challenges, not least because in this case even the construction of the data itself – let alone its interpretation – is an extremely tricky business. Firstly there was, by common agreement, a substantial under-count of young Afro-Caribbean men in the 1991 Census, as difference in the size of the male and female age cohorts amongst young adults in Figure 6 clearly confirms; secondly the way in which the ‘Ethnic Group’ question was asked and answered was such that by no means everyone of Afro-Caribbean ancestry necessarily ticked the Black-Caribbean box – or had that box ticked for them by whoever filled up the Census form. In 1991 many people of Afro-Caribbean descent appear to have taken the far from unreasonable view that the “Ethnic Group” question was asking about birthplace, rather than ancestry or ethnic affiliation. Hence Caribbean-born parents very frequently identified their British-born children as Black-British, whilst ticking the Black- Caribbean box to identify themselves; as a result as many as half of all school age and pre-school age children of Afro-Caribbean descent were classified as Black-Other, rather then Black- Caribbean, in the published results of the 1991 Census. Hence even though the Black Other category undoubtedly includes a small but significant number of people who are not of Afro- Caribbean descent, the distortions produced by the omission of so many children of Afro-Caribbean parentage from the published figures for ‘Black Caribbeans’ is so great that data for the two nominally separate ethnic categories have been combined to produce the figures in Table 6.
0 1,000 2,000 3,000 4,000 5,000 6,000 7,000 8,000 9,000 10,000
0 - 4 5 - 9 10 -14 15 - 19 20 - 24 25 - 29 30 - 34 35 - 39 40 - 44 45 - 49 50 - 54 55 - 59 60 - 64 65 - 69 70 - 74 75 - 79 80 - 84 85 +
Age group
Population in Age group
Males
Females
Although it can certainly be argued that this procedure is arbitrary and therefore misleading, it nevertheless appears to be a great deal more sensible to make an effort to bring together data on persons who actually belong to a single identifiable community, rather than to follow a categorical procedure which has equally arbitrarily keep them apart.
2Figure 6: Distribution of Britain’s Afro-Caribbean population by age and sex Source 1991 Census: Ethnic group and Country of Birth Volume, Table 6.
But having carried out that exercise, what do the data tell us? The patterns revealed in Figure 6 suggest that the demographic characteristics of Britain’s Afro-Caribbean population has in many respects been even more starkly determined by the impact of immigration controls than any of the other communities we have so far considered. Hence the now-familiar bulge of people aged between fifty and sixty, together with a considerable tail stretching on into retirement age, can be read off as being composed of the people who made their way to Britain as young adults within a rather more extended time period between the arrival of the Empire Windrush in 1948 and the imposition of immigration controls in 1962. But if Afro-Caribbeans were rather less successful in playing the voucher system to their advantage than were migrants from South Asia, they also soon set about reuniting their very substantial families, so producing a peak of people aged between twenty and thirty five when the Census was taken in 1991. Numbers then dip amongst teenage generation, matching the dip in the 35-45 year olds, but with a large number of young women mothers having just come “on-stream” in child-bearing terms when the census was taken, there was
2
For a fuller set of arguments about these issues, Ballard and Kalra (1994) and Modood (1997).
0 5,000 10,000 15,000 20,000 25,000 30,000 35,000 40,000 45,000 50,000
0 - 4 5 - 9 10 -14 15 - 19 20 - 24 25 - 29 30 - 34 35 - 39 40 - 44 45 - 49 50 - 54 55 - 59 60 - 64 65 - 69 70 - 74 75 - 79 80 - 84 85 +
Age group
Population in Age group
Males
Females
a substantial rise in the very youngest age cohort. Set against this a comparison between the figures shown in Figure 6 and those that can be derived from the 1981 Census suggests – as with the Indians – that there has also been a significant loss of population further up the age scale, and that this is particularly marked amongst those who have reached retirement age. This is certainly congruent with suggestions that a significant number of elderly people are taking the opportunity to retire to the Caribbean once they have qualified for a pension.
Making any kind of prediction of the likely future growth of Britain’s Afro-Caribbean population is a hazardous task, not least in the light of the doubts and inadequacies built into the data itself.
Nevertheless it seems that unless other factors – such as re-emigration, for example – were to intervene, Britain’s Afro-Caribbean population will continue to grow steadily in size in the years to come, although a great deal less dramatically than in the case of the Pakistanis and Bangladeshis.
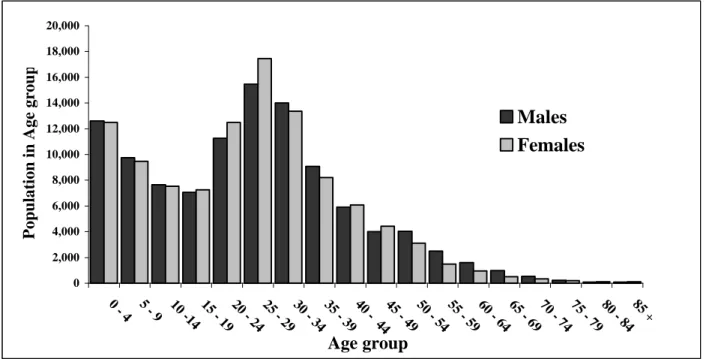
1.3.6 The Black Africans
However neat and convenient an ethnic identifier the term “Black African” may seem to be, the actual ethnic affiliations of those who fall within its purview are in fact a great deal more diverse than in the case of any of other identifiers we have so far considered. In historical terms the African presence in Britain is of long-standing, rooted as it is in the settlements established Nigerian and Somali ex-seamen in ports such as London, Liverpool, Cardiff and South Shields from as far back as the closing years of the nineteenth century. These settlements were subsequently overlaid by the arrival of a further group of settlers who were not so much labour migrants – as in the case of almost all the groups which we have considered so far – but well educated young men and women from Nigeria, Sierra Leone and Ghana who made their way to Britain in search of higher educational qualifications.
The salience of this latter group amongst Britain’s Black African population is very evident from
the patterns revealed in Figure 7, with a sharp peak of persons aged between twenty five and thirty
five in 1991, and many of whom were still engaged in their studies at the time. However there are
clear indications of a growth in numbers here too. Once they have gained the qualifications they
seek, it is only reasonable to expect that they will turn their attention to child-rearing: precisely the
pattern which Figure 7 reveals. It is also safe to predict that Britain’s Black African population will
grow substantially in the years to come, although it is still far to early to make any clear predictions
as to just how rapid that patter of growth will be.
Figure 7: Distribution of Britain’s Black African population by age and sex Source 1991 Census: Ethnic group and Country of Birth Volume, Table 6.
1.4 Levels of in- and out-marriage amongst the minorities
Although the minority communities which the Census enables us to identify have so far been treated as if they were wholly autonomous, and hence as if no inter-ethnic marriages take place, such a picture is clearly inadequate: ethnic exogamy may be relatively rare, but it clearly does take place. Moreover given that the Census is organised on a household rather than an individual basis, it also allows us to explore such matters – and even to examine the extent to which such unions are grounded either in formal marriage, or in mere cohabitation. In this context this second distinction has been ignored, and so Table 4 sets out the proportion of women in each ethnic group who have established domestic partnerships with men drawn from each of the other groups, whilst Table 5 explores the same situation from a male point of view.
In so far as it was once assumed that in any well-established multi-racial society, an ever increasing number of cross-boundary would – and indeed should – take place, Tables 5 and 6 are most illuminating, above all because of the very high levels of within-group endogamy which they reveal: in no group does that figure fall below 69%, whilst over 96% of both Pakistani and Bangladeshi women’s partners are drawn from within their own group. Perhaps not surprisingly women invariably have rather higher levels of within-group endogamy than do men – with the sole
0 2,000 4,000 6,000 8,000 10,000 12,000 14,000 16,000 18,000 20,000