http://dx.doi.org/10.5852/ejt.2017.283 www.europeanjournaloftaxonomy.eu 2017 · Philippe H. et al.
This work is licensed under a Creative Commons Attribution 3.0 License.
D N A L i b r a r y o f L i f e , o p i n i o n p a p e r
urn:lsid:zoobank.org:pub:4F1838FA-DD9D-402F-8D57-D5D38715D6E3
Pitfalls in supermatrix phylogenomics
Hervé PHILIPPE 1,*, Damien M. de VIENNE 2, Vincent RANWEZ 3, Béatrice ROURE 4, Denis BAURAIN 5 & Frédéric DELSUC 6
1,4 Centre de Théorisation et de Modélisation de la Biodiversité, Station d’Ecologie Théorique et Expérimentale, UMR CNRS 5321, 09200 Moulis, France.
1 Département de Biochimie, Centre Robert-Cedergren, Université de Montréal, Montréal, H3C 3J7 Québec, Canada.
2 Laboratoire de Biométrie et Biologie Evolutive, CNRS, UMR 5558, Université Lyon 1, 69622 Villeurbanne, France.
3 SupAgro, UMR AGAP, 34398 Montpellier, France.
5 InBioS-PhytoSYSTEMS – Eukaryotic Phylogenomics, Université de Liège, Liège, Belgium.
6 Institut des Sciences de l’Evolution, UMR 5554, CNRS, IRD, EPHE, Université de Montpellier, Montpellier, France.
* Corresponding author: herve.philippe@sete.cnrs.fr
2 Email: damien.de-vienne@univ-lyon1.fr
3 Email: vincent.ranwez@supagro.fr
4 Email: bea.roure@gmail.com
5 Email: denis.baurain@ulg.ac.be
6 Email: frederic.delsuc@univ-montp2.fr
1 urn:lsid:zoobank.org:author:9A29F58C-D3E2-44DA-9E38-7270E08B4264
2 urn:lsid:zoobank.org:author:1CF9E4F6-FC15-4E19-BF23-DE2B132DF2B1
3 urn:lsid:zoobank.org:author:48C8B062-E3E6-4D25-A12E-5F104BC071E3
4urn:lsid:zoobank.org:author:DB8ADB04-D982-4A20-B559-C026C040962E
5 urn:lsid:zoobank.org:author:A6B5C24F-EA7B-4928-A89C-385054A02383
6 urn:lsid:zoobank.org:author:95D3FBA1-CFD3-481D-8F38-A45BC3D7A7AD
Abstract. In the mid-2000s, molecular phylogenetics turned into phylogenomics, a development that improved the resolution of phylogenetic trees through a dramatic reduction in stochastic error. While some then predicted “the end of incongruence”, it soon appeared that analysing large amounts of sequence data without an adequate model of sequence evolution amplifi es systematic error and leads to phylogenetic artefacts. With the increasing fl ood of (sometimes low-quality) genomic data resulting from the rise of high-throughput sequencing, a new type of error has emerged. Termed here “data errors”, it lumps together several kinds of issues affecting the construction of phylogenomic supermatrices (e.g., sequencing and annotation errors, contaminant sequences). While easy to deal with at a single-gene scale, such errors become very diffi cult to avoid at the genomic scale, both because hand curating thousands of sequences is prohibitively time-consuming and because the suitable automated bioinformatics tools are still in their infancy. In this paper, we fi rst review the pitfalls affecting the construction of supermatrices
and the strategies to limit their adverse effects on phylogenomic inference. Then, after discussing the relative non-issue of missing data in supermatrices, we briefl y present the approaches commonly used to reduce systematic error.
Keywords. Phylogenomics, supermatrix, systematic error, data quality, incongruence.
Philippe H., de Vienne D.M., Ranwez V., Roure B., Baurain D. & Delsuc F. 2017. Pitfalls in supermatrix phylogenomics. European Journal of Taxonomy 283: 1–25. http://dx.doi.org/10.5852/ejt.2017.283
From phylogenetics to phylogenomics
The last two decades have seen signifi cant changes taking place in the practice of phylogenetic inference from molecular data. These changes have mostly been triggered by the ever-increasing size of the datasets being assembled and analysed in the form of supermatrices of concatenated genes (Driskell et al. 2004).
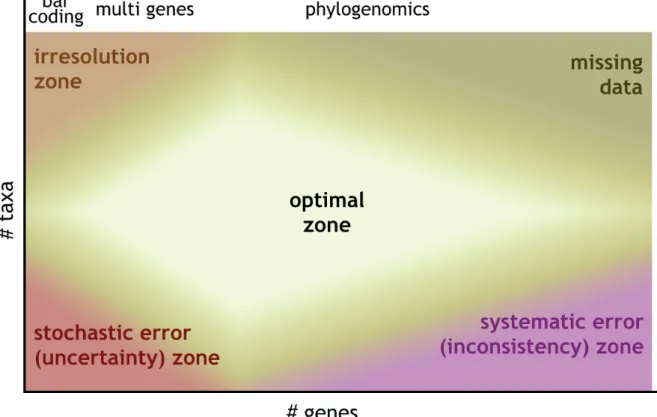
The evolution of the size and shape of these datasets, thanks to new technological advances in DNA amplifi cation and sequencing, has been associated with different phases in the fi eld of phylogenetic inference (Fig. 1). In the early days of molecular phylogenetics based on PCR amplifi cation and manual Sanger sequencing of a handful of genes for a limited number of taxa, the fi eld laid somewhat in the
“uncertainty zone” dominated by stochastic error, even if some naïve over-interpretations did occur.
Then, the development of automated Sanger sequencing typically led to a few standard genes (e.g., SSU rRNA, elongation factors, RNA polymerases) being sequenced for a large number of taxa, projecting the fi eld into the “irresolution zone” with only limited information available to resolve a large number of nodes. Yet, at that time the focus was not on resolving large-scale phylogenetic relationships, rather than on identifying species or strains by molecular means, which eventually gave rise to the fi eld of DNA barcoding (Hebert et al. 2003). The fi rst genome sequences from model organisms reverted the situation, with few taxa being sequenced for their entire set of genes causing a sort of “inconsistency zone” in which large multigene alignments combined with poor taxon sampling led to a number of phylogenetic reconstruction artefacts due to the prevalence of systematic error. Finally, the development of genomics and transcriptomics (and more recently of high-throughput or next-generation sequencing technologies) allowed the fi eld to enter an “optimal zone” by offering the opportunity to assemble phylogenomic datasets representing a good compromise between taxon and gene sampling and typically constituted by hundreds of genes for tens of taxa. However, the tempting up-scaling along these two axes resulted in an “overfl ow zone”, where missing data steadily increase and computing requirements explode at all stages of the analysis (Fig. 1).
In the mid-2000s, multigene phylogenetics therefore turned into phylogenomics (Delsuc et al. 2005;
Philippe et al. 2005a). As with the beginnings of molecular phylogenetics, the early days of phylogenomics (i.e., the use of genome-scale data to infer phylogenetic relationships) started with a wave of optimism.
It was fi rst claimed that genomic data would allow “resolving incongruence in molecular phylogenies”
(Rokas et al. 2003), with some bidding even higher and promising “ending incongruence” (Gee 2003).
As a consequence, the number of newly sequenced nucleotides was given in the abstract of articles published in high-profi le journals as a simple metric of quality (Dunn et al. 2008). The assumption underlying this optimism was that the use of a large amount of characters would eliminate stochastic error, which had been plaguing morphology-based and single-gene phylogenies for too long. This view was clearly valid and numerous subsequent studies have yielded phylogenies with much better statistical support (e.g., Delsuc et al. 2006; Hampl et al. 2009; Jarvis et al. 2014). However, a few discordant voices soon advocated caution (Phillips et al. 2004; Soltis et al. 2004; Jeffroy et al. 2006). First, genuine topological incongruence, i.e., statistically supported contradictions, is in fact extremely rare when phylogenies are inferred from a limited set of characters, since stochastic error dominates in this case (this does not mean that weakly supported incongruences are not real, in particular these created by
incomplete lineage sorting, and deserve consideration, see below). Second, systematic error naturally becomes more apparent at the genomic scale, simply, as a typical example of statistical inconsistency, in which the inference method converges towards an incorrect solution as more and more data are analysed. As a result, phylogenomics rather was “the beginning of incongruence” among studies based on different datasets and (especially) inference methods (Jeffroy et al. 2006).
Despite the fact that most articles do not study the same phylogenetic questions, incongruence appears to be common in phylogenomics. For instance, the fi rst group of animals to branch out is proposed to be either Ctenophora (Dunn et al. 2008), Bilateria (Schierwater et al. 2009) or Porifera (Philippe et al. 2009); acoels are included within Lophotrochozoa (Dunn et al. 2008), as sister to all the remaining Bilateria (Hejnol et al. 2009) or within Deuterostomia (Philippe et al. 2011a); the sister-group of land plants is Coleochaete (Finet et al. 2010) or Zygnematales (Wodniok et al. 2011); scaphopods are sister to Bivalvia + Gastropoda (Kocot et al. 2011), Gastropoda (Smith et al. 2011) or Bivalvia (unpublished).
The marked decrease in stochastic error is insuffi cient to avoid the generation of incompatible
Fig. 1. Evolution of phylogenetic reconstruction over time. Different zones can be delimited based on the number of genes (X axis) and number of taxa (Y axis) composing the supermatrix at hand.
Generally speaking, the (upper) left part of the map has more to do with identifying species (as in barcoding studies), while the right part of the map corresponds to multigene and phylogenomic datasets assembled for recovering large-scale phylogenetic relationships. Each of these zones suffers from its own combination of issues (stochastic error, systematic error, data errors, computational requirements and missing data). Interestingly, the “optimal zone” in phylogenomics is not the one corresponding to the highest number of genes and taxa, because this computationally “intractable zone” is also the one where data errors and missing data are the most abundant. The latter aspect is due to the continuous shrinking of the number of orthologous genes when considering increasingly more species, owing to gene loss, gene duplication and gene transfer events.
phylogenies and should have been accompanied, as expected by some, by a decrease in systematic error obtained through efforts in improving inference methods. Unfortunately, it appears that genome-scale analyses also lead to the amplifi cation of data errors, i.e., errors that occurred during the construction of the datasets (Philippe et al. 2011b; Laurin-Lemay et al. 2012). This is due to the fact that the fl ood of genomic data (often of decreasing quality) has become intractable for manual controls, while few bioinformatics tools have yet been adapted to the complexity of the genomic scale.
In this paper, we discuss major pitfalls of phylogenomics and ways to limit their impact on phylogenetic inference. First, we review the approaches, existing and to be developed, to assembling a phylogenomic dataset that is as free as possible of data errors, briefl y reviewing the potential issue of missing data along the way. Second, we describe effi cient methods to reduce systematic error.
Construction of a phylogenomic dataset
Effects of data errors
Single-gene and small multigene datasets could easily be curated thoroughly by hand, allowing researchers to remove almost all major errors before analysis and publication. The few remaining errors were often due to contaminations in the case of organisms that were diffi cult to make axenic (Pawlowski et al. 1996; Bourlat et al. 2003). Of course, due to the limitations of ancient sequencing technologies, sequencing errors were frequent and sequence quality was quite variable in these early datasets. High- throughput sequencing has greatly improved sequence quality, mainly through the large coverage of each nucleotide, but has simultaneously fl ooded researchers with an amount of data that is diffi cult, if not impossible, to handle by hand. While numerous custom scripts have been independently written to manage this deluge of data, there is currently no agreement in the community regarding the quality controls that should be implemented in phylogenomic dataset construction. More problematically, the practice of phylogenetic research has continued at the genomic scale with more or less the same approaches as those used at the single-gene and small multigene scales.
In order to illustrate data errors and their consequences for phylogenomic inference, we will explore three example datasets (Dunn et al. 2008; Schierwater et al. 2009; Finet et al. 2010) that were carefully verifi ed after their original publication (Philippe et al. 2011b; Laurin-Lemay et al. 2012). The most frequent errors observed in the protein-coding genes of these datasets are frameshifts and contaminant sequences. Frameshifts are primarily due to sequencing errors (especially for transcriptomic data) and annotation errors (especially for genomic data). Sequence contamination occurred at the sampling step (i.e., parasites or symbionts thriving inside, or in close association with, the organisms of interest) or at the laboratory or sequencing steps (cross-contamination). Accordingly, many contaminants belong to evolutionary lineages that contain many parasites (e.g., Apicomplexa, Microsporidia, Platyhelminthes), are widely distributed (e.g., Fungi or Ciliophora), or are extensively studied (e.g., Mammalia or Magnoliophyta). Less frequent errors correspond to the use of an erroneous genetic code for translation, the inclusion of paralogous (or even non-homologous) genes. For instance, more than 4000 amino acids were incorrect and more than 30 sequences were contaminants in the supermatrix of Dunn et al. (2008);
101 sequences were contaminants in the supermatrix of Finet et al. (2010).
One might be tempted to argue that these errors have a negligible impact on tree reconstruction. Given the large size of phylogenomic alignments, non-phylogenetic signal should be overwhelmed by the wealth of genuine phylogenetic signal. To test this hypothesis, we introduced contaminant sequences into a large supermatrix (30 517 positions and 48 species) and observed that phylogenetic inference is indeed relatively robust to such errors (unpublished results): when contamination was below 4%, at most 4 partitions were incorrect (on average ~2 for 3%). As expected, all clades with a relatively long ancestral branch were accurately recovered. This demonstrates that obtaining a phylogenomic tree in
good global agreement with previous knowledge does not imply that the underlying dataset is error- free. In contrast, clades with a short ancestral branch appear to be very sensitive to computationally introduced contaminations, whereas such clades are the very target of phylogenomics, smaller-scale approaches having insuffi cient statistical power to resolve them. These simulations are nevertheless conservative, because we spiked contaminant sequences at random, which is usually not the case in practice. For instance, 55 out of 101 were cross-contaminations in the study of Finet et al. (2010), with 29 sequences from the coleochaetalean Chaetosphaeridium actually coming from the zygnematalean Penium (Laurin-Lemay et al. 2012). These biased contaminations explain why two well-established clades (Coleochaetales and Zygnematales) were not recovered as monophyletic in the original study, in spite of relatively long ancestral branches in the true species tree. In the case of Dunn et al. (2008), the impact of contamination has not been directly studied, but a supermatrix with the same set of genes and species was assembled not only to fi x data errors in the former, but also to complete it with new sequences (cutting down missing data from 55.5% to 35.6%). Moreover, we used less permissive Gblocks parameters, reducing positions from 21 152 to 18 463 (Philippe et al. 2011b). Despite the use of the same genes, the same species and the same evolutionary model, trees inferred from the original and revised datasets differed by a Robinson-Foulds distance of 36, i.e., 18 clades among 74 were different. The distance was increased if a better fi tting model (the CAT model instead of the WAG model) was used: 24 bipartitions among 74 (i.e., a Robinson-Foulds distance of 48) were different between trees inferred based on original (Dunn et al. 2008) and revised (Philippe et al. 2011b) datasets.
For instance, acoels moved from within Lophotrochozoa to sister of Deuterostomia, Ctenophora moved from sister to all the remaining animals to sister to all but Porifera, or Myzostoma moved from sister of Gnathostomulida + Acoela to within Annelida, all these changes being of great biological signifi cance.
A large amount of data is therefore clearly insuffi cient to reconstruct the correct phylogeny, and data errors, as well as missing data and systematic error (see below), must be minimized as much as possible.
Data quality control
No standard for the quality control of a phylogenomic supermatrix has been established yet. Instead, only preliminary attempts for reporting data have been made (Leebens-Mack et al. 2006). Obviously, manual and semi-automated controls that are in use for single-gene phylogenetics can still be applied, though they are very time-consuming (e.g., several weeks of tedious work in the case of our two previous studies, Philippe et al. 2011b and Laurin-Lemay et al. 2012) and subjective (i.e., not easily reproducible nor easily assessable by referees). It is therefore of prime importance to develop bioinformatics tools to assemble high-quality datasets and necessary that the phylogenetics community establishes a standard for the quality of a supermatrix for phylogenetic analysis. Note that errors can be very complex to track down, and even to defi ne. For example, a gene horizontally transferred from a parasite to its host could easily (but erroneously) be viewed as a contaminant, and thus removed from the dataset; yet this would be the right thing to do only when the inference method assumes orthology, since such a xenologous gene might also provide valuable information (Huang & Gogarten 2006). Similarly, the known case of a frameshift in the MurF gene of Buchnera, which is rescued by polymerase infi delity (Tamas et al. 2008), looks very much like a sequencing error in the genomic sequence. While these exceptions certainly do exist, they are rare and can likely be safely ignored in the context of supermatrix construction.
Obvious ways of reducing data errors are to improve the sequencing technology, the genome assembly method, the gene annotation protocol and the identifi cation of orthologous genes. These improvements, which are not specifi c to phylogenomics, are the object of active research and will not be discussed here. We will instead focus on the few tools that allow controlling the quality of a supermatrix after its assembly but before its use in phylogenetic tree reconstruction. The underlying assumption of these quality controls is that outliers (in terms of sequence similarity or phylogenetic position) are most often incorrect. Granted, a very fast-evolving sequence is diffi cult to tell apart from a genuine outlier and might be discarded erroneously by such approaches. However, this unavoidable property is not
really problematic for phylogenomic inference, since removal of fast-evolving characters/species is commonly carried out to reduce tree-reconstruction artefacts (e.g., Brinkmann & Philippe 1999; Pisani 2004; Brinkmann et al. 2005).
Reducing alignment errors
In order to infer a phylogeny from amino-acid sequences, one has to chain up several analyses, fi rst sequencing, assembling and identifying coding regions (annotation), then clustering orthologous sequences and, for each cluster, producing a multiple sequence alignment that will eventually be part of the phylogenomic supermatrix. Since each step can introduce errors, the careful analysis of individual gene alignments is key to detecting and correcting those issues that would otherwise hamper the phylogenetic inference based on the fi nal supermatrix. A crucial step is therefore to identify the homologous amino-acid residues (or nucleotides) at every position of the sequences.
The importance of a correct alignment in phylogenetic inference has long been pointed out (Morrison
& Ellis 1997; Ogden & Rosenberg 2006; Talavera & Castresana 2007; Wong et al. 2008) and numerous efforts have been made to improve multiple sequence alignment software (Higgins et al. 1992;
Notredame et al. 2000; Edgar 2004; Katoh et al. 2005; Loytynoja & Goldman 2005). Yet, due to the lack of a tractable model of sequence evolution in the presence of insertion and deletion events (indels), the criteria optimized by alignment software are mostly ad hoc and based on the simplistic assumptions that homologous characters should be similar and that indels are rare events. Automatic alignment programs have thus long been used as effi cient tools to obtain a fi rst draft of the alignment to then be manually curated by expert biologists. Even if human curation greatly cripples reproducibility, this step may be strongly encouraged as a “way of introducing some biological (as opposed to bioinformatics) insight into the resulting alignment” (Morrison 2006). Reviewing the literature, Morrison (2009) reported that manual curation is a common practice, with 78% of sequence alignment procedures described in 1280 papers published in 2007 involving human intervention.
The landmark work on automatic alignment fi ltering is the famous Gblocks program (Castresana 2000), which (although based on a basic strategy) allows removal of the less reliable parts of an alignment and hence improving phylogenetic inference (Talavera & Castresana 2007). Gblocks fi rst considers each site independently; depending on the presence of gaps and on the percentage of identical residues, sites are partitioned in the three following categories: “non conserved”, “conserved” or “highly conserved”.
Then reliable blocks of sites are defi ned by taking into account the degree of conservation of sites inside and around those blocks. The fact that Gblocks considers the neighbourhood of a site, when deciding whether to keep it or not, is a major reason for its effi ciency.
By default, the original Gblocks program removed all sites containing gaps. This is generally too strict, especially when dealing with numerous sequences, and a threshold on the percentage of allowed gaps is preferable. Similarly, the percentage of identical residues is a crude measure of site conservation. More recent alignment fi ltering methods, such as trimAl (Capella-Gutierrez et al. 2009) or BMGE (Criscuolo &
Gribaldo 2010), refi ne this measure of site conservation through the use of, e.g., PAM or BLOSUM matrices (Dayhoff et al. 1978; Henikoff & Henikoff 1992). Moreover, unlike Gblocks, these two fi ltering software programs do not require the user to provide fi xed threshold values for determining sites to be trimmed. Instead, BMGE uses statistical tests to select the residues to keep while trimAl dynamically adapts its thresholds based on the distribution of gaps and residue similarities observed in the alignment.
Another strategy to assert alignment reliability is to consider their stability. Indeed, for a given set of sequences, there are often numerous (nearly) equally optimal alignments. The simple Head or Tail method that consists in aligning sequences from right to left in addition to from left to right (Landan &
Graur 2007) and its variants (Landan & Graur 2008) are designed to measure the stability of residue
pairing among such equally optimal alignments. Other authors considered a broader view of alignment stability, trying to estimate stability by comparing alignments obtained with different parameter values (e.g., gap opening cost), different guide trees and even different alignment programs. Among others, SOAP (Loytynoja & Milinkovitch 2001), T-Coffee (Poirot et al. 2003), MUMSA (Lassmann &
Sonnhammer 2007), trimA1 (Capella-Gutierrez et al. 2009) or GUIDANCE (Penn et al. 2010) propose to fi lter alignments based on stability criteria. Since they require realigning the same set of sequences several times, these approaches are time consuming. Moreover, their results strongly depend on the sampling of methods and parameters used to generate the alternative alignments.
Another option is to consider, for a given method and a given set of parameters, the stability of residue pairing among the sub-optimal alternative solutions. In this strategy, implemented in FSA (Bradley et al.
2009), PSAR (Kim & Ma 2011) and ZORRO (Wu et al. 2012), alternative alignments used to measure residue-pairing stability are obtained by a probabilistic sampling based on an approximation of the alignment posterior distribution (i.e., the better the alignment, the higher its probability of appearing in the sampling). This approach has the advantage of relying on a well-defi ned probabilistic framework, to allow for an effi cient implementation (since alternative alignments are not built from scratch) and to provide fi ltered alignments leading to better phylogenies (Wu et al. 2012).
Most of the above-mentioned methods attribute an elementary score to each residue pairing of the alignment, which can be turned into an elementary score per residue (e.g., using the average score of residue pairings containing a given residue). By considering the score of all residues of a given site, they can attribute a site score as done by Gblocks, but they can also consider the score of all residues in a given sequence. This is particularly useful to identify rogue sequences, e.g., resulting from contaminations or erroneous homology predictions, before any further analysis. This can even be extended, as done for instance in BMGE, GUIDANCE and FSA, to mask portions of sequences, which is particularly useful to detect annotation errors or frameshifts in coding sequences. The method StatSigMA (Prakash &
Tompa 2005) uses an extension of the BLAST statistics (Altschul & Lipman 1990) to detect such non- orthologous portions of sequences (Prakash & Tompa 2005). Alternatively, Philippe et al. (unpublished) introduced HMMCleaner, a program that tackles the same problem by fi rst building a Hidden Markov Model profi le of the alignment, and then measuring the score of the different sequence regions along this profi le. The focus of those last two methods is clearly on evaluating a per (portion of) sequence quality rather than a per site quality as done by ZORRO or PSAR, for instance.
Although the rationale of removing part of the alignments because of potential errors is clear, it is also obvious that positions possibly hosting a correct phylogenetic signal are removed as well. Hence, a recent study (Tan et al. 2015) suggests that commonly used software for automated fi ltering alignments decreases single-gene phylogeny accuracy, in contradiction with a previous study (Wu et al. 2012).
Although more work is needed to solve this point, the fi ltering is easier to justify in supermatrix phylogenomics, since the increase of stochastic error observed in single-gene phylogeny is naturally overcome when numerous genes are concatenated.
Finally, when dealing with protein-coding nucleotide sequences, it is highly recommended to align them based on their amino acid translations. Three main reasons can be pointed out for doing so (Morrison 2006): amino acid sequences are less variable and thus easier to align (due to the degeneracy of the genetic code), they are defi ned in a larger character-state space (which reduces the probability of random matches), and inserted gaps will preserve the reading frame (which is biologically more realistic). The alignment of protein-coding sequences is therefore often performed in three steps: 1) the nucleotide sequences are fi rst translated into amino acids, 2) the amino-acid sequences are then aligned and 3) the resulting protein alignment is used for deriving the codon alignment by reporting inferred gaps.
This strategy is implemented in transAlign (Bininda-Emonds 2005), TranslatorX (Abascal et al. 2010),
and Seaview 4 (Gouy et al. 2010), for example. The main limitation of this approach is the inability to handle unexpected frameshifting indels (either real or due to sequencing errors) that result in (partially) incorrect translations. Affected sequences hence look like highly divergent protein sequences and, in the best case, are removed by alignment fi ltering methods. The MACSE program handles such situations by simultaneously considering the nucleotide sequences and their amino-acid translations and by explicitly taking into account frameshift events during the alignment process (Ranwez et al. 2011). This provides an automatic solution to detect undocumented frameshifts in public database sequences and high- throughput sequencing contigs. MACSE also allows aligning protein-coding gene datasets containing non-functional sequences (pseudogenes) without disrupting the underlying codon structure (Fig. 2).
Sequences can thus be retained rather than removed from the alignment, provided that sites containing frameshifts are a posteriori fi ltered out. In addition, the accuracy of the alignments can be evaluated using protein structure (when available) as performed by TCS (Chang et al. 2014).
Reducing orthology prediction errors
Although errors due to the inclusion of non-orthologous sequences in phylogenomics can have drastic consequences on the fi nal results (Philippe et al. 2011b; Laurin-Lemay et al. 2012), a hunt for such dubious sequences is rarely performed in phylogenomics and, when it is, fastidious manual approaches are most often used. An obvious type of non-orthology error that can be detected and corrected for is biological (or in silico) sequence contamination. BLAST similarity searches provide an easy way to detect contaminant sequences, as long as the reference database is taxonomically rich. Hence, a much better hit on a sequence from a different clade than on a sequence from the expected clade (e.g., ciliate for a mollusc sequence) is an excellent indicator that the query sequence is “fi shy”. However, especially when the difference between the two E-values is not that large, a confi rmation through a phylogenetic tree is recommended (Philippe et al. 2009; Philippe et al. 2011b; Laurin-Lemay et al. 2012), owing to the limited power of BLAST (Koski & Golding 2001). Disentangling in silico, laboratory and biological contamination may be diffi cult, especially when the biology of the organism at hand is poorly known.
Yet, when contaminant sequences belong to organisms also found in the laboratory having generated the data (e.g., Escherichia coli or cross-contamination among the organisms of the study) or to clades rich in parasitic or symbiotic forms (e.g., microsporidia, fungi or dinofl agellates), laboratory or biological contamination, respectively, is the most straightforward interpretation.
Fig. 2. Example of a frameshift-aware alignment produced by MACSE. Trpc2(-like) sequences of bats were aligned at the nucleotide level (A) and amino acid level (B), unravelling several frameshifts (indicated by “!”) and stop codons (indicated by “*”) in the pseudogenes. Hence, MACSE automatically provided an alignment that would otherwise require a lot of tedious manual work. It can also be used to replace these frameshifts and stop codons by standard codons (e.g., “NNN” or “---”) in order to obtain an alignment suitable for further analysis with standard tools (e.g., PhyloBayes or PAML).
Cases of biological contamination are sometimes anticipated and addressed accordingly. For instance, Kocot et al. (2011) analysed sequences from the order Neomeniomorpha (the group containing solenogasters, small worm-like shell-less molluscs). The two neomenioid species included in the study feed on cnidarians and are known to harbour DNA from their cnidarian prey (Okusu & Giribet 2003;
Kocot et al. 2011). To avoid contamination of the neomenioids by cnidarian sequences, the authors performed a BLAST search for every neomenioid sequence against the complete sets of proteins of a gastropod (Lottia) and of a cnidarian (Nematostella). If a sequence had a better hit against Nemastostella than against Lottia, it was considered as a contaminant and discarded. Though sound in its principle, this approach is expected to be limited due to the use of a single cnidarian proteome. Indeed, using multiple cnidarian species, we detected several cnidarian contaminants in the published dataset using a semi- automatic approach (data not shown).
Contamination is not always as simple to detect as in the ideal case of a very distantly related contaminant organism. Further, the BLAST approach has some serious limitations. First, it requires knowledge of the phylogeny, which is often the question that needs to be answered in phylogenomic studies. Second, if contamination occurs between closely related species and/or if taxon sampling is too sparse, the BLAST approach is unlikely to detect contaminants. Finally, the absence of a BLAST hit on the genome used as a proxy for the contaminant organism does not ensure the inexistence of a closely related sequence.
Instead, it can simply mean that the sequence is missing from the reference genome. Nevertheless, exactly as NCBI automatically removes vector sequences, this type of approach should be made systematic in phylogenomics, for it requires only limited resources (computing and human time) and becomes more and more powerful with the increasing taxonomic diversity of correctly annotated genomes. Scientifi c journals should thus enforce this simple quality control, just as Molecular Biology and Evolution once decided to require authors to report statistical support for publishing a phylogeny.
Contamination is not the only source of non-orthology, paralogy being a common underhand source of issues, given the high frequency of gene/genome duplication, gene conversion and gene loss. Instead of looking for unexpected BLAST hits, it is thus preferable to build and check individual gene trees for unexpected bipartitions (i.e., aberrant placement of some species). Again, this approach was also used by Kocot et al. (2011). To this end, they inferred a maximum likelihood tree for each individual gene and
“manually evaluated [...] any remaining cnidarian contamination in the neomenioid datasets”. These were neomenioid sequences that were forming a clade with Nematostella or were part of a polytomy that included Nematostella. Their protocol was nonetheless focused on a single type of errors and more systematic strategies are certainly needed.
One example of such an approach was developed to check the orthology in a supermatrix used to reconstruct deep animal relationships (Philippe et al. 2009). For each gene tree, the presence of every bipartition with a bootstrap support value ≥ 70% was compared to the bipartition list of the tree obtained by concatenating all the genes (this tree is considered as a good approximation of the true, unknown, species tree). The authors found that the number of confl icting bipartitions was small and that incongruences almost always represented only minor rearrangements in the tree (often nearest neighbour interchanges). Consequently, they concluded that paralogy was not playing a signifi cantly negative role in their analysis. While this approach is reasonable for checking that a dataset is suffi ciently free of non- orthology errors, it is seriously limited by stochastic error. Indeed, in single-gene phylogenies, most of the nodes are poorly supported and, if the support threshold is reduced (e.g., down to 50%), too many nodes confl ict with the tree inferred from the supermatrix, whatever the actual quality of the dataset.
Moreover, a manual, time-consuming step is needed to interpret each automatically detected confl ict to determine whether it is due to a stochastic (e.g., partial sequence) or systematic (e.g., long-branch attraction (LBA)) error, or caused by contamination or undetected hidden paralogy.
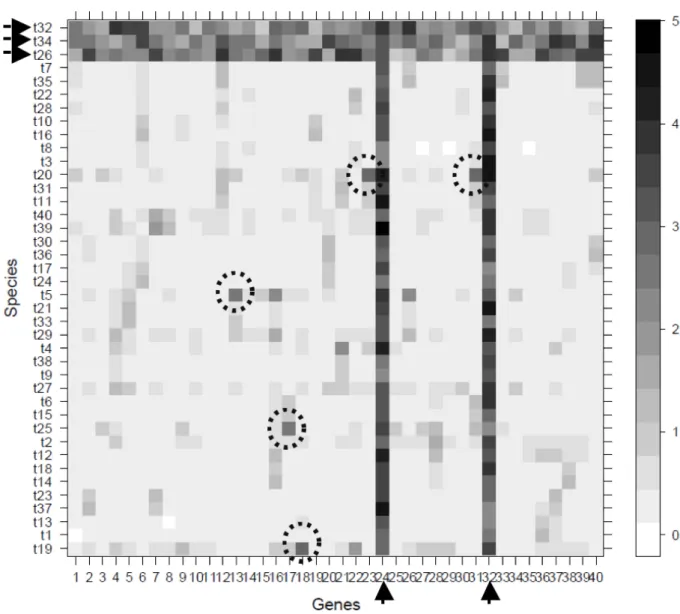
An automatic approach for detecting outlier sequences in a phylogenomic dataset, named Phylo-MCOA (de Vienne et al. 2012) has been developed. It is based on a multivariate approach known as Multiple CO-inertia Analysis (MCOA) (Chessel & Hanafi 1996). It takes as input a set of gene trees, converts all these trees into pairwise distance matrices (using either nodal or patristic distances between species) and compares all these matrices simultaneously. What is relevant here is the output given by the program and the possibilities it offers for detection and potential removal of problematic sequences. After MCOA has been applied to all pairwise distance matrices, the user is returned (1) a reference position of each species in a Euclidean space, and (2) the position of each of these species in each individual gene tree in this same space. A so-called 2WR-matrix is then constructed by computing, for every species, the distance separating its position in each gene tree to its reference position. This matrix contains as many rows as the number of species and as many columns as the number of genes. A cell with a high value in this matrix represents a species whose position (or branch length) in a given gene tree is not concordant with its position in all other trees. An example of such a matrix for a hypothetical dataset of 40 genes and 40 species is presented in Fig. 3.
Phylo-MCOA distinguishes two types of outliers, the “complete” outliers and the “cell-by-cell” outliers.
Complete outliers (black arrows in Fig. 3) represent either species that have a position that is very variable with respect to other species “for all the genes” or genes for which “all the species” have a position that is not concordant with the other species in the other genes. This is clearly the case for two genes (g24 and g32) and three species (t23, t34 and t32) in the example matrix of Fig. 3. Phylo-MCOA provides a simple outlier detection method to identify these complete outliers (see de Vienne et al. 2012 for details). Cell-by-cell outliers (dashed circles in Fig. 3) are specifi c species in specifi c genes whose position is not concordant with their position in the other gene trees. They can only be identifi ed with confi dence in the 2WR-matrix after complete outliers have been removed and the analysis performed anew.
The fi nal output of Phylo-MCOA is a list of all complete outlier species, all complete outlier genes and all cell-by-cell outliers. These detected outliers may represent either problematic sequences due to contamination, frameshift events, incorrect annotations, erroneous chimerical sequences, wrong orthology assessment, or indicate interesting biological processes such as horizontal gene transfer, gene conversion, incomplete lineage sorting or hybridization. When the goal of the analysis is, as discussed here, to ensure having a dataset containing only orthologous sequences, one should focus on these detected outlier sequences to remove them.
As an example, Phylo-MCOA was used on the phylogenomic dataset of Schierwater et al. (2009) known to contain problematic sequences that were manually identifi ed by Philippe et al. (2011b). By comparing the tree obtained after removing all the outliers identifi ed by Phylo-MCOA and the original tree of Schierwater et al. (2009), it appeared that (1) the strong bootstrap support for the monophyly of diploblasts was reduced (from 100% to 63%), as expected from the fact that it is certainly not a monophyletic group, and (2) the monophyly of Porifera disappeared (from 100% in the original tree), in agreement with the very low bootstrap support (36%) obtained by Philippe et al. (2011b) on the same dataset after replacing the incorrect sequences they detected by better ones. Even though the automatic approach performed with Phylo-MCOA and the manual approach conducted by Philippe et al. (2011b) only partly identifi ed the same problematic sequences, the application of this tool to a complex dataset demonstrated its potential. Nevertheless, there is certainly room for improvement and for the development of new tools dedicated to this important task. A fi rst step is to be achieved soon with the development of an online version of Phylo-MCOA that will facilitate its use and parameterization (unpublished).
Evaluating the impact of missing data
Assembling a large and complete dataset with hundreds of orthologous genes and tens to hundreds of species remains a challenge, since a gene may have not yet been sequenced, might have been lost in a lineage, or could have been replaced by a xenologous copy through lateral gene transfer. As a result, many supermatrices were published with a high amount of missing data (e.g., 55%, 74%, 79% and 81%
for Dunn et al. (2008), Kocot et al. (2011), Smith et al. (2011) and Hejnol et al. (2009), respectively).
The impact of missing data on the accuracy of phylogenomic inference has received a lot of attention, but studies focused on this issue have reached two opposite conclusions: (1) the effect of the incompleteness is deleterious and sparse supermatrices must be avoided (Huelsenbeck 1991; Lemmon et al. 2009) and
Fig. 3. Typical output of Phylo-MCOA. A matrix containing as many rows as the number of species and as many columns as the number of genes was computed, in which complete (black arrows) and cell-by- cell (dashed circles) outliers can easily be detected. Cells with a high value (dark grey) represent species whose position in a given gene is not concordant with their position in all the other genes. It is thus a measure of distance to the common signal present in the data.
(2) missing data are not problematic per se as long as a suffi cient number of characters are known for each taxon (Wiens 2003; Philippe et al. 2004; Wiens & Morrill 2011).
Because the impact of missing data has mainly been studied on medium-sized datasets and/or on simulated sequences, these conclusions are not easily transposable to phylogenomic datasets. The central question is whether the lack of data has detrimental effects beyond those of the associated reduction in information, i.e., a decrease of the resolution level when the amount of missing data increases. Lemmon et al. (2009) suggested that “ambiguous characters [or missing data] produce misleading estimates of phylogeny through interaction with two other factors: Bayesian priors and model misspecifi cation”. Their experiments using four species were nevertheless based on the incorrect assumption that “ambiguous sites provided no topological information because only 2 of the 4 characters had unambiguous states”.
This assumption is not true within a probabilistic framework, as every ambiguous site, even with a single known character state over hundreds of species, provides information to estimate model parameters, such as stationary frequencies (Roure et al. 2013). Hence, the major topological changes observed by Lemmon et al. (2009) are easily explained under the following theoretical framework: when more and more characters with known, but always different, states in two closely related species are added to the alignment (their fi g. 7), these two species are more and more distantly related in the inferred phylogeny simply because the ambiguous sites provide a very strong signal in favour of a very long evolutionary path separating them (sum of branch lengths). In contrast, adding unbiased ambiguous sites does not modify the outcome of the phylogenetic inference (Roure et al. 2013). Since the distribution and nature of missing data are usually not biased, this supports the idea that missing data are not deleterious per se (Wiens & Morrill 2011). However, missing data and model violations (or misspecifi cation) do interact.
As a reminder, model violations lead to an incorrect interpretation of the multiple substitutions occurring at a given position, potentially yielding tree reconstruction artefacts. Because using a rich taxon sampling facilitates the detection of multiple substitutions, it also helps reduce the impact of potential model violations. Unfortunately, missing data reduce the number of taxa effectively present at a given position, so that the resulting decreased power in detecting multiple substitutions may increase the impact of model violations (Roure et al. 2013). For instance, if a fast-evolving species is completely represented in the supermatrix but its close relatives are very incomplete, the detection of multiple substitutions along this long branch becomes ineffi cient, thus favouring potential long-branch attraction (LBA) artefacts.
To test whether missing data can generate such misleading effects in phylogenomics, Roure et al.
(2013) assembled an almost complete supermatrix (39 animals, 126 genes for 29 715 amino acids) and progressively increased the proportion of missing genes (20% to 80%) in some species (8 or 27), by introducing missing data following the patchy patterns observed in real transcriptomic-based datasets while controlling for information loss and decrease in taxon sampling. This empirical study demonstrated that a patchy distribution of missing data has an effect similar to the complete removal of species, but is much more detrimental than the complete removal of genes. Missing data indeed exacerbate systematic error leading to LBA artefacts by reducing the ability to detect multiple substitutions, as evidenced by tree length decreasing when the fraction of patchy missing data increases (Roure et al. 2013). In this respect, it is worth noting that algorithmic approaches have been proposed to extract a subset of the original dataset (by removing genes and/or species) in order to reduce the proportion of missing data while preserving as much information as possible (Sanderson et al. 2003; Dutheil & Figuet 2015).
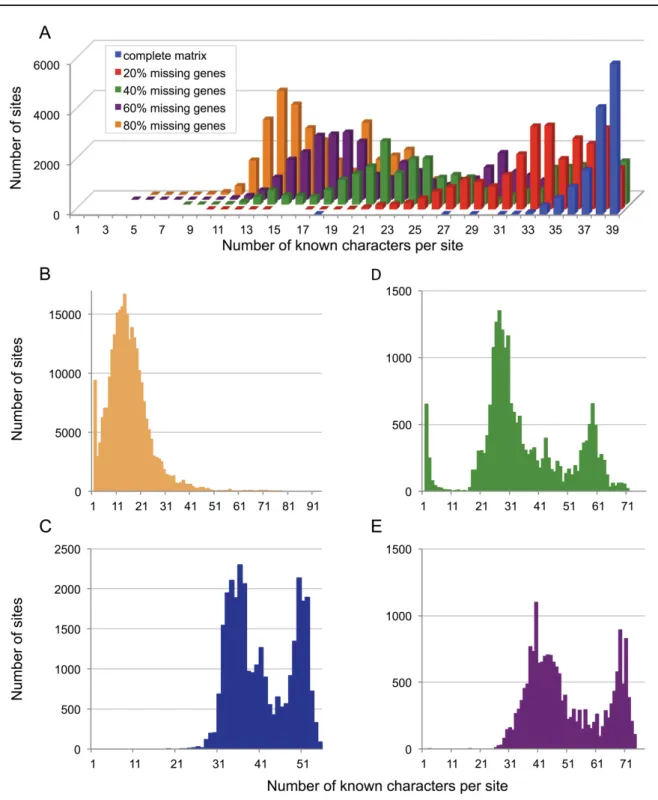
The concept of “effective number of species”, i.e., the real number of known character states at a typical position, is useful to understand the effect of missing data (Fig. 4) and to assist in deciding when to stop adding increasingly incomplete genes to a supermatrix. Though it is fundamentally a property of each column of the alignment, it can be considered globally by computing the product of the number of taxa by the frequency of unambiguous data (e.g., 94 × 0.19 = 18 for the Hejnol et al. (2009) dataset). A low effective number of species provides an intuitive explanation for the exacerbation of systematic error
Fig. 4. Distribution of missing data in phylogenomic datasets. The raw dimensions of a supermatrix (in numbers of genes and taxa) should always be accompanied by an estimate of its level (and ideally distribution) of missing data (A). Indeed, some datasets were advertised as very large when published but required a lot of useless computing power due to a large proportion of missing data (B). More importantly, such datasets are more exposed to data errors, systematic error and phylogenetic artefacts, as their effective number of species is actually quite low for the largest part of their width. In other cases, a targeted completion (in the outgroups) was enough to improve the phylogenetic accuracy (D–E). In contrast, datasets assembled with the optimal phylogenomic zone in mind combine a suffi cient number of genes and taxa while featuring a low proportion of missing data (C). These are the most appropriate datasets to produce accurate phylogenetic relationships.
by missing data in a given dataset. The answer to the question “should we add a highly incomplete gene to a phylogenomic supermatrix?” is therefore rather no. It may be better to use a narrower, but almost complete dataset, than a wider and very incomplete one.
In contrast, the answer to the question “should we add a very incomplete species to a phylogenomic supermatrix?” is more complex. In agreement with previous studies (Philippe et al. 2005b; Wiens 2005), we have shown that including incomplete species, especially slow-evolving ones, helped us to reduce the effects of systematic error (Roure et al. 2013). Yet, increasing the completeness of some species, in particular in outgroups, also reduced LBA artefacts. Therefore, the inclusion of incomplete taxa should not be prohibited, but the level of completeness of all species should be clearly indicated on the inferred phylogeny because it provides key information for identifying potential problems. For instance, when missing data are concentrated in one clade, the effects are more deleterious, questioning the reliability of the relationships within the clade, but virtually not affecting the rest of the tree. It is worth noting that the addition of incomplete species increases the computational time to a larger degree than the addition of complete species (Roure et al. 2013). As a result, the decision to include incomplete species is a matter of balance between the improvement of phylogenetic accuracy and the inevitable increase in computational time. An open question is how the creation of chimerical sequences for incomplete, but closely related, species may help in solving this dilemma. Finally, Streicher et al. (2016) have recently shown that, in the case of ultraconserved elements of lizards, the optimal strategy depended on the approach. When dealing with supermatrices analysed by maximum likelihood, it was better to maximize the number of species while keeping the total amount of missing data below 50%, whereas for species trees inferred by neighbour joining, it was better to include all the markers but for a limited number of species. More empirical studies are therefore needed to establish consensual guidelines for fi nding the best level of missing data in phylogenomic inference.
The last important lesson from empirical studies of missing data in phylogenomics is that the method used to infer the tree has a greater impact than the level of missing data itself (Roure et al. 2013; Hosner et al.
2016), especially when the latter is limited (between 20% and 40%). First, the alternative methods that have been suggested as being less sensitive to missing data, such as super-tree, maximum parsimony and gene-partitioning models, turned out to be more sensitive to missing data (albeit not signifi cantly for the latter). Second, the choice of the model of sequence evolution (e.g., the site-homogeneous WAG + F + Γ4 model versus the site-heterogeneous CAT + Γ4 mixture model) had a much larger impact than the level of missing data. In this particular case, the tree inferred from a dataset with 27 species having 80% of missing data using CAT + Γ4 was closer to the best phylogenetic estimate than the tree inferred from the complete dataset using WAG + F + Γ4, especially for the position of the fast-evolving taxa (Roure et al.
2013).
Limiting systematic error
Once the issue of data errors in the supermatrix assembly is overcome, systematic error is the main, if not the sole, limitation to the power of phylogenomics. Felsenstein (1978) described the LBA artefact almost 40 years ago, demonstrating that maximum parsimony could converge towards an incorrect solution with additional characters. Although the number of characters used in phylogenomics (typically from tens of thousands up to a few million) is far from infi nite (i.e., the convergence of a method), the issue of statistical inconsistency is important and should not be neglected. The approaches used to eschew inconsistency have been reviewed several times (e.g., Olsen 1987; Felsenstein 1988; Sanderson &
Shaffer 2002; Soltis et al. 2004; Philippe et al. 2005a, 2011b) and will only be succinctly discussed here.
Systematic error occurs when inference methods do not correctly handle multiple substitutions. In a probabilistic framework, systematic error stems from violations of the model of sequence evolution,
which is designed in essence to predict the substitution history. It is generally considered that the problem is an underestimation of the true number of substitutions (related to the well-known issue of saturation), but it is quite possible that an incorrect design of the evolutionary model yields an overestimation (Olsen 1987). Three complementary approaches allow improving the correct estimation of multiple substitutions: (1) a rich taxon sampling, (2) realistic models of sequence evolution, and (3) removal of the most deviant data.
A rich taxon sampling provides direct information to infer multiple substitutions, by breaking up branches into smaller pieces (Hendy & Penny 1989). From our experience, this strategy is the most effi cient to resolve diffi cult phylogenetic questions, in particular for positioning fast-evolving lineages. For instance, the phylogenetic position of the very fast-evolving acoels is either sister to all the remaining bilaterians (Baguna & Riutort 2004), potentially resulting from an LBA with the distant diploblast outgroup, or sister to the fast-evolving platyhelminthes (Dunn et al. 2008), potentially resulting from another LBA.
The inclusion of sequences from Xenoturbella, the likely sister-group of acoels, reduced the misleading signal for these two artefactual positions, but not enough to yield a resolved phylogeny (Philippe et al.
2007). It was only the addition of sequences from several acoels, and also from their closest relatives, nematodermatids, that allowed positioning of this very fast-evolving lineage (Philippe et al. 2011a), probably because nematodermatids evolve more slowly than the latter. Even the best-fi tting evolutionary model currently available is unable to accurately position acoels in the absence of Xenoturbella and nematodermatids. Two recent phylogenomic studies which focused on these organisms (Cannon et al.
2016; Rouse et al. 2016) illustrate that a larger number of genes (212 and 1178 in these studies vs 68 and 197 in older studies) exacerbates systematic error: when outgroups and fast-evolving acoelomorphs are included, Xenacoelomorpha (Xenoturbella + Acoelomorpha) emerge far from Ambulacraria, as sister of all other bilaterians, but when excluded, Xenoturbella is robustly sister of Ambulacraria in both studies (unpublished results), two obviously incompatible results.
While very useful, the strategy of enriching the taxon sampling is limited in two different ways. The fi rst one is inescapable: the history of speciation and extinction that has generated the Tree of Life has led to many taxon-poor clades (e.g., coelacanth or Amborella), and ancient DNA techniques are of very little help in fi lling in the gaps because they are restricted to recently extinct taxa. The second limitation is governed by time and money, given that the search for the optimal phylogenetic tree is an NP-hard problem. In this respect, the development of more effi cient heuristics (e.g., Guindon & Gascuel 2003;
Stamatakis & Ott 2008) and of more effi cient computers only partially alleviates the problem. The number of species included in a phylogenomic analysis will thus always remain a compromise between the resources available and the length of time one accepts to devote to it.
The improvement of models of sequence evolution should strive for increased realism, not necessarily increased complexity (Steel 2005). The use of inference-based comparison instead of data-based comparison in posterior predictive assessment, albeit very time-consuming, is the best way to evaluate any given improvement, since one assesses the ability of a model to correctly infer the topology, rather than to correctly simulate data (Brown 2014). Ideally, improvements should be focused on a better detection of the multiple substitutions that are the most likely to induce topological errors. This is the reason why the major examples of progress in the reduction of phylogenetic (LBA) artefacts were obtained by including a more effi cient detection of convergent substitutions (homoplasy): (1) the fi rst probabilistic model, which included branch lengths and allowed the inference of more convergences along long branches (Felsenstein 1981), (2) the modelling of the heterogeneity of the substitution rate among character states (e.g., the GTR model; Lanave et al. 1984), which allowed the inference of more convergences for nucleotides of the same biochemical class or amino acids with similar properties, (3) the modelling of the rate variation across sites (Yang 1993), which allowed the inference of more convergences at the fastest sites without inferring too many multiple substitutions at the slowest sites,
(4) non-stationary models accounting for the variation of nucleotide/amino-acid composition over time (Galtier & Gouy 1998; Foster 2004), which allowed the inference of more convergences due to a similar bias among unrelated species, and (5) the modelling of the non-homogeneity of the substitution process across sites (mixture models such as CAT; Lartillot & Philippe 2004; Pagel & Meade 2004) by locally decreasing the effective size of the alphabet, which allowed the inference of more convergences due to functional constraints (e.g., only a charged amino acid is acceptable). Numerous other evolutionary model refi nements have been made to take into account, for instance, the genetic code (through codon models), the secondary structure of RNAs, heterotachy or gene-specifi c rate and/or composition (e.g., Goldman & Yang 1994; Yang 1996; Savill et al. 2001; Huelsenbeck 2002). However, they all had little effect on the accuracy of phylogenetic inference, either because they do not allow the detection of the most problematic convergences or because the rest of the model is over-simplistic. For instance, taking into account the non-stationarity of the amino-acid composition is much more effi cient when the heterogeneity of the substitution process across sites is also handled by the model (Blanquart & Lartillot 2008).
Future improvements will therefore be obtained by combining most, or even all, of these biologically reasonable properties into a single model, or by discovering which type of convergences are the most deleterious in order to specifi cally model them. Clearly, the fi rst approach will be limited by computational burden and a risk of over-parameterization. In contrast, it is unclear whether it is better to continue improving the current strategies based on a “static” supermatrix, or to further develop methods that simultaneously perform alignment and phylogenetic inference of a supermatrix (Hein 1990; Liu et al. 2012) or to develop methods that simultaneously infer single-gene trees and the species tree using reconciliation (to handle incomplete lineage sorting, duplication or horizontal gene transfer; reviewed in Szollosi et al. 2015). Careful (empirical) studies comparing the advantages of these different approaches are needed. In the very long run, a dream method that would simultaneously infer alignment, single- gene tree and the species tree using a realistic (complex) model for each of these three steps would probably be the most accurate, but perhaps not the most desirable because of its inevitable ecological footprint (see Philippe 2011).
The last widely used strategy to avoid systematic error consists in data removal. The underlying assumption, inspired by the parsimony approach (Kluge & Farris 1969), is that fastest-evolving sites and species should be removed because they are the most prone to homoplasy. It is therefore common practice in phylogenomics to discard fast-evolving sites and fast-evolving species, especially when slowly evolving close relatives are available. It is worth noting, however, that this is diffi cult to justify in a probabilistic framework, since the model is supposed to account for such rate variations through branch lengths or site-specifi c rates, respectively. In a probabilistic framework, the biggest issue is not the fast- evolving objects per se, but the objects that most signifi cantly violate the model of sequence evolution (Philippe & Roure 2011). For instance, a slowly evolving species, but with a marked compositional bias, will be more diffi cult to position than a fast-evolving but compositionally homogeneous species when using a model that assumes stationarity. Similarly, a very slowly evolving site that independently, but unexpectedly according to the model, changes twice into the same character state (e.g., from aspartic acid to tryptophan) may be very detrimental to phylogenetic inference.
Recent studies have demonstrated that removing sites that violate the model of sequence evolution can overcome tree reconstruction artefacts in cases where removing fast-evolving sites alone cannot. As an illustration, Roure & Philippe (2011) obtained a sister-group relationship between cnidarians and poriferans in a phylogeny of animals based on proteins encoded in the mitochondrial genome using the CAT + Γ4 model. Suspecting an LBA artefact between the fast-evolving bilaterians and the outgroup, they identifi ed heteropecillous positions, defi ned as positions with changing substitution profi les over time. Interestingly, the progressive removal of these positions violating the assumption of homogeneity
of the CAT mixture model (Lartillot & Philippe 2004) led to a single topological change: the recovery of the more classical sister-group relationship between cnidarians and bilaterians. Similarly, the gamma- proteobacterial endosymbionts of insects have an AT-rich genome and tend to be artifi cially clustered in trees based on nucleotide sequences Husník et al. (2011). By progressively removing the positions that were the most compositionally biased (i.e., a position only containing A and T, or G and C, is unbiased), Husník et al. (2011) were able to overcome this composition-based artefact and to recover a tree identical to the one obtained from amino-acid sequences. Finally, recent studies of genome datasets in mammals (Romiguier et al. 2013) and birds (Jarvis et al. 2014) have revealed that AT-rich genes hold a much clearer phylogenetic signal than GC-rich genes, which are subjects to GC-biased gene- conversion (Eyre-Walker 1993) episodes possibly leading to an increased heterogeneity in both base composition and evolutionary rate among taxa.
Developing methods to detect and remove the sites and the species that violate the model of sequence evolution most signifi cantly is a promising avenue of research. Posterior predictive tests as implemented in programs such as PhyloBayes 3 (Lartillot et al. 2013) and PHYCAS (Lewis et al. 2015) allow evaluation of model fi t to the data or part of the data. Sun et al. (2016) have recently used this kind of approach to identify sites in a whole chloroplast dataset that did not fi t the model of sequence evolution.
They showed that removing those sites from the analysis signifi cantly improved phylogenetic inference of green algae relationships. Even if data removal is intellectually less satisfying than developing a
“perfect” model of evolution fully accounting for the complexity of the data, this kind of approach could be similarly effi cient and certainly requires less computational resources, since these reduced datasets can be analysed with simpler models.
Conclusions
With the democratization of high-throughput sequencing, acquiring new genome data has ceased to be the limiting factor in phylogenomics, except maybe for organisms that are diffi cult to sample from the environment. In contrast, phylogeneticists are now faced with a rise in data errors, which stems from a fl ood of increasingly bogus genomic data that has become intractable by hand. However, with more effort from the community, notably by investing thinking and time in the development of adequate bioinformatics tools, the issue of data errors should be solved in the next few years.
Given the size of current and upcoming phylogenomic datasets (thousands of genes for hundreds — and soon thousands — of species), computational requirements are emerging as the new limiting factor. As multiple possible improvements are theoretically able to limit systematic error (and artefacts) during phylogenetic inference, we will need both simulation and empirical studies to design the best compromise between using many species with a simple model and using few species with a complex model. Similarly, more work is required to determine the set of properties that the ideal model of sequence of evolution should combine. In that respect, a sound strategy is to focus on model components that allow for a better detection of convergent multiple substitutions, without chasing biological realism.
Even if 1000s of genes may seem large for a biologist, it remains a modest sample size for a statistician.
Therefore, we should be ready to accept that the shortest branches of the Tree of Life may never be resolved. In that respect, it is somewhat paradoxical that the modern scientifi c tools developed to yield an accurate reconstruction of the tree of life are also very likely to contribute to the destruction of the species once thriving at its tips (see Philippe 2011 for a more complete discussion).
Acknowledgments
This work has benefi ted from support by the TULIP Laboratory of Excellence (ANR-10-LABX-41) to HP and from an “Investissements d’Avenir” grant managed by Agence Nationale de la Recherche
(CEBA, ref. ANR-10-LABX-25-01) to FD. This is contribution ISEM 2016-015 of the Institut des Sciences de l’Evolution de Montpellier.
References
Abascal F. , Zardoya R. & Telford M.J. 2010. TranslatorX: multiple alignment of nucleotide sequences guided by amino acid translations. Nucleic Acids Research 38: W7–13. http://dx.doi.org/10.1093/nar/
gkq291
Altschul S. F. & Lipman D.J. 1990. Protein database searches for multiple alignments. Proceedings of the National Academy of Sciences 87: 5509–5513. http://dx.doi.org/10.1073/pnas.87.14.5509
Baguna J. & Riutort M. 2004. The dawn of bilaterian animals: the case of acoelomorph fl atworms.
BioEssays 26: 1046–1057. http://dx.doi.org/10.1002/bies.20113
Bininda-Emond s O.R. 2005. transAlign: using amino acids to facilitate the multiple alignment of protein- coding DNA sequences. BMC Bioinformatics 6: e156. http://dx.doi.org/10.1186/1471-2105-6-156 Blanquart S. & Lartillot N. 2008. A site- and time-heterogeneous model of amino acid replacement.
Molecular Biology and Evolution 25: 842–858. http://dx.doi.org/10.1093/molbev/msn018
Bourlat S.J., Nielsen C., Lockyer A.E., Littlewood D.T. & Telford M.J. 2003. Xenoturbella is a deuterostome that eats molluscs. Nature 424: 925–928. http://dx.doi.org/10.1038/nature01851
Bradley R.K., R oberts A., Smoot M., Juvekar S., Do J., Dewey C., Holmes I. & Pachter L. 2009. Fast statistical alignment. PLoS Computational Biology 5: e1000392. http://dx.doi.org/10.1371/journal.
pcbi.1000392
Brinkmann H. & P hilippe H. 1999. Archaea sister group of Bacteria? Indications from tree reconstruction artifacts in ancient phylogenies. Molecular Biology and Evolution 16: 817–825.
Brinkmann H., G iezen M., Zhou Y., Raucourt G.P. & Philippe H. 2005. An empirical assessment of long-branch attraction artefacts in deep eukaryotic phylogenomics. Systematic Biology 54: 743–757.
http://dx.doi.org/10.1080/10635150500234609
Brown J.M. 2014. Detection of implausible phylogenetic inferences using posterior predictive assessment of model fi t. Systematic Biology 63: 334–348. http://dx.doi.org/10.1093/sysbio/syu002
Cannon J.T., Vellu tini B.C., Smith 3rd J., Ronquist F., Jondelius U. & Hejnol A. 2016. Xenacoelomorpha is the sister group to Nephrozoa. Nature 530: 89–93. http://dx.doi.org/10.1038/nature16520
Capella-Gutierrez S ., Silla-Martinez J.M. & Gabaldon T. 2009. trimAl: a tool for automated alignment trimming in large-scale phylogenetic analyses. Bioinformatics 25: 1972–1973. http://dx.doi.org/10.1093/
bioinformatics/btp348
Castresana J. 2000. Selection of conserved blocks from multiple alignments for their use in phylogenetic analysis. Molecular Biology and Evolution 17: 540–552.
Chang J.M., Di Tommas o P. & Notredame C. 2014. TCS: a new multiple sequence alignment reliability measure to estimate alignment accuracy and improve phylogenetic tree reconstruction. Molecular Biology and Evolution 31: 1625–1637. http://dx.doi.org/10.1093/molbev/msu117
Chessel D. & Hanafi M. 1996. Analyses de la co-inertie de K nuages de points. Revue de Statistique Appliquée 44 (2): 35–60.
Criscuolo A. & Gribaldo S. 2010. BMGE (Block Mapping and Gathering with Entropy): a new software for selection of phylogenetic informative regions from multiple sequence alignments. BMC Evolutionary Biology 10: e210. http://dx.doi.org/10.1186/1471-2148-10-210
Dayhoff M.O., Schwartz R .M. & Orcutt B.C. 1978. A model of evolutionary change in proteins. In:
Dayhoff M.O. (ed.) Atlas of Protein Sequences and Structure: 345–352. National Biomedical Research Foundation, Washington DC.
Delsuc F., Brinkmann H. & P hilippe H. 2005. Phylogenomics and the reconstruction of the tree of life.
Nature Reviews Genetics 6: 361–375. http://dx.doi.org/10.1038/nrg1603
Delsuc F., Brinkmann H., C hourrout D. & Philippe H. 2006. Tunicates and not cephalochordates are the closest living relatives of vertebrates. Nature 439: 965–968. http://dx.doi.org/10.1038/nature04336 Driskell A.C., Ane C., Burleigh J.G., McMahon M.M., O'Meara B.C. & Sanderson M.H. 2004. Prospects for building the Tree of Life from large sequence databases. Science 306: 1172–1174. http://dx.doi.
org/10.1126/science.1102036
Dunn C.W., Hejnol A., Matus D.Q., Pang K., Browne W.E., Smith S.A., Seaver E., Rouse G.W., Obst M., Edgecombe G.D., Sørensen M.V., Haddock S.H., Schmidt-Rhaesa A., Okusu A., Kristensen R.M., Wheeler W.C., Martindale M.Q. & Giribet G. 2008. Broad phylogenomic sampling improves resolution of the animal tree of life. Nature 452: 745–749. http://dx.doi.org/10.1038/nature06614
Dutheil J.Y. & Figuet E. 2015 . Optimization of sequence alignments according to the number of sequences vs. number of sites trade-off. BMC Bioinformatics 16: e190. http://dx.doi.org/10.1186/
s12859-015-0619-8
Edgar R.C. 2004. MUSCLE: a mu ltiple sequence alignment method with reduced time and space complexity. BMC Bioinformatics 5: e113. http://dx.doi.org/10.1186/1471-2105-5-113
Eyre-Walker A. 1993. Recombin ation and mammalian genome evolution. Proceedings of the the Royal Society B 252: 237–243. http://dx.doi.org/10.1098/rspb.1993.0071
Felsenstein J. 1978. Cases in which parsimony or compatibility methods will be positively misleading.
Systematic Zoology 27: 401–410. http://dx.doi.org/10.2307/2412923
Felsenstein J. 1981. Evolutiona ry trees from DNA sequences: a maximum likelihood approach. Journal of Molecular Evolution 17: 368–376.
Felsenstein J. 1988. Phylogenies from molecular sequences: inference and reliability. Annual Review of Genetics 22: 521–565. http://dx.doi.org/10.1146/annurev.ge.22.120188.002513
Finet C., Timme R.E., Delwiche C. F. & Marletaz F. 2010. Multigene phylogeny of the green lineage reveals the origin and diversifi cation of land plants. Current Biology 20: 2217–2222. http://dx.doi.
org/10.1016/j.cub.2010.11.035
Foster P.G. 2004. Modeling composi tional heterogeneity. Systematic Biology 53: 485–495. http://dx.doi.
org/10.1080/10635150490445779
Galtier N. & Gouy M. 1998. Inferrin g pattern and process: maximum-likelihood implementation of a nonhomogeneous model of DNA sequence evolution for phylogenetic analysis. Molecular Biology and Evolution 15: 871–879.
Gee H. 2003. Evolution: ending incon gruence. Nature 425: 782. http://dx.doi.org/10.1038/425782a Goldman N. & Yang Z. 1994. A codon-b ased model of nucleotide substitution for protein-coding DNA sequences. Molecular Biology and Evolution 11: 725–736.
Gouy M., Guindon S. & Gascuel O. 2010 . SeaView version 4: A multiplatform graphical user interface for sequence alignment and phylogenetic tree building. Molecular Biology and Evolution 27: 221–224.
http://dx.doi.org/10.1093/molbev/msp259