206 OXFAM BRIEFING PAPER 9 SEPTEMBER 2015
While some people forge ahead, others are left behind by society. Brussels, April 2015, in the area of the Stock Exchange Building (2015).
Photo: Ximena Echague/Oxfam
A EUROPE FOR THE MANY, NOT THE FEW
Time to reverse the course of inequality and poverty in Europe
EMBARGOED UNTIL 00:01 HRS GMT 9 SEPTEMBER 2015
Europe is facing unacceptable levels of poverty and inequality. Instead of putting people first, policy decision making is increasingly influenced by wealthy elites who bend the rules to their advantage, worsening poverty and economic inequality, while steadily and significantly eroding democratic institutions. Austerity measures and unfair tax systems across Europe are skewed in favour of powerful vested interests. It is time to reverse the course of poverty and inequality in Europe, putting people first.
FORWARD
[Forward will be added to final paper]
SUMMARY
In 2015, people across Europe are suffering unacceptable levels of poverty and inequality. European countries may pride themselves on being stable democracies that look after their citizens, but the EU faces levels of poverty and exclusion, which most people would consider unacceptable in the 21st century. Within the prosperous nations of the European Union (EU), 123 million people are at risk of poverty or social exclusion, representing almost a quarter of the population, while almost 50 million people live with severe material deprivation, without enough money to heat their homes or cope with unforeseen expenses.
Box 1. AROPE (at risk of poverty or social exclusion): A measure of poverty in the EU
Poverty is measured in the EU using the AROPE indicator. AROPE refers to the situation where people are either at risk of poverty,1 severely materially deprived2 or living in a household with very low work intensity.3 The AROPE rate is the share of the total population which is at risk of poverty or social exclusion. It is a relative measure that depends on the specific living conditions of each country.
Source: Eurostat4
A large number of EU countries have seen increasing numbers of people falling below the poverty line in recent years. Between 2009 and 2013 an additional 7.5 million people, across 27 EU countries, were classified as living with severe material deprivation, with 19 countries registering an increased level. In many countries unemployment remains very high, even as many of those lucky enough to have work see their incomes stagnate or fall to poverty-wage levels. Women, young people and migrants are the groups most likely to be poor.
Poverty in the EU is not an issue of scarcity, but a problem of how resources – income and wealth – are shared. Credit Suisse estimates that the richest one percent of Europeans (including non-EU countries) hold almost a third of the region’s wealth, while the bottom 40 percent of the population share less than one percent of Europe’s total net wealth.
In other words: the richest seven million people in Europe have the same amount of wealth as the poorest 662 million people (including non-EU countries).
Several dynamics are driving up levels of inequality and poverty in the EU.
First, wealthy individuals, corporations and interest groups have captured the political decision-making processes, skewing them to favour their own interests at the expense of those they are meant to serve. This leads to greater levels of economic inequality, as tax systems and government policies are made to benefit the few over the many. As wealth continues to accumulate at the top, the ability of these elites to disproportionally influence the rules further exacerbates inequality. This vicious cycle of
wealth concentration, abuse of power and neglect of citizens has
detrimental impacts on economic growth, social stability and democracy, as well as on marginalization and poverty.
Second, austerity programmes, implemented in some EU countries, have placed the burden of reducing the public deficit squarely on the shoulders of the poor and vulnerable, and are having a severe impact on European societies. These programmes include policies that increase regressive taxation, cut public spending, privatize public services, shrink wages and undermine working conditions.
And third, in many EU countries unfair tax systems are failing to correct income inequalities and, worse, are actually contributing to a widening inequality gap. These tax systems are consistently biased towards more heavily taxing labour and consumption than capital, allowing high
earners, wealthy individuals and the most profitable companies to largely escape from their tax obligations, and placing the burden of effort on common citizens. At the same time, one estimate puts the cost of tax avoidance and evasion in the EU at €1 trillion a year in lost revenue (see note 157 for details), enough to double the total public health investment across EU countries.
Yet economic inequality and poverty are not inevitable. Oxfam’s experience of working in Latin America, sub-Saharan Africa and South- East Asia during previous financial crises has taught us that there are alternatives. There are deliberate policy interventions and political commitments that Europe can take now to break the cycle of poverty, inequality and political capture that fuels democratic bankruptcy.
Increased social spending, improved public service provision, decent work and wages, and progressive tax systems can all help to create a fairer society.
In 2010, the EU’s 2020 strategy established the Platform Against Poverty and Social Exclusion, aiming to lift 20 million people out of poverty in the EU, but since then poverty rates have only increased.
It is time for Europe to regain its role as a global leader promoting a progressive agenda that delivers for everyone, not just for a wealthy, powerful minority. Europe remains one of the world’s wealthiest regions, so a lack of finance can be no excuse. What is required now is for leaders to show that they have the political will to finally put an end to poverty and extreme inequality in Europe.
RECOMMENDATIONS
The EU and its member states must urgently tackle four major policy areas, in order to secure greater levels of equality and development for their citizens.
The following recommendations are guiding principles, which have great relevance across the EU, but which will need to be adapted for different institutional and national contexts.
EU institutions and member states must:
1. Strengthen institutional democracy
• Support citizens to engage more meaningfully in democratic processes, in particular budgeting and resource allocation;
• Work hard to ensure that policy-making processes become less permeable to vested interests and more democratic, through
mandatory public lobby registries, stronger rules on conflict of interest and balanced compositions of expert groups;
• Ensure that good-quality information on administrative and budget processes are made public, free and easily accessible.
2. Re-invest in public services
• Guarantee free, public, universal education and healthcare for all, in order for governments to fulfil their human rights obligations to their citizens;
• Prioritize gender budgeting and systematically analyze proposed economic policies for their impact on girls and women. Allocate funding in ways that promotes gender equality including redistributing care responsibilities;
• Develop social protection systems that respond to the needs of the most vulnerable, protect low-income households, and provide social services aimed at children and young people.
3. Guarantee decent work and wages
• Ensure that employment is connected with social protection systems, including the implementation of a social protection floor;
• Address the gender pay gap and agree action plans to reduce gender inequality in compensation and seniority;
• Recognise the contribution of unpaid care work, and help reduce the burden of unpaid care work disproportionately borne by women, by providing child and elderly care and paid family and medical leave, flexible working hours, and paid parental leave.
4. Tax justice
• Increase cooperation to fight tax dodging and harmful tax competition, and adopt a comprehensive transparency reporting framework for large companies operating in Europe so that revenue collection agencies can ensure they pay taxes where the real economic activities occur;
• Pay greater attention to the impact of EU tax policies on developing countries and support them to increase their tax revenues
progressively;
• Support the equal participation of developing countries on international tax discussions and decision making.
• Promote progressive national tax systems across Europe.
1 INTRODUCTION
Europe will not be made all at once, or according to a single plan.
It will be built through concrete achievements which first create a de facto solidarity.
Robert Schuman5 Europe6 has often seen itself as a place where the social contract – the agreement between individuals and the state regarding freedoms, rights and obligations – balances economic growth with social development. A place where public services aim to ensure that everyone has access to free high-quality education and healthcare. A place where the rights of workers, particularly of women, are respected and supported, and where society cares for the weakest and poorest; where the market has been harnessed to benefit society, rather than the other way round. It has been an inspiration to other regional integration projects, like Mercosur,
ASEAN, the Andean Community and the African Union.
Yet, today, the number of people living in poverty and excluded from society across the European Union (EU) is growing, and the living and working conditions for many citizens are deteriorating. In contrast, those groups in positions of power and wealth have remained immune from these pressures. The gap between the rich and the poor within the EU is widening, threatening to reverse the gains made in the global fight against poverty in the last two decades. The rise in economic inequality also represents a serious blow to efforts to achieve gender equality in the EU.
Increases in extreme economic inequality – the gap between the richest 10 percent and the rest of the population – both globally and in Europe, are fuelled and sustained by a process of political capture, where powerful elites representing wealthy interest groups or business sectors are able to influence policy making in their favour, in a way that people without access to these resources cannot compete with. This downward spiral of wealth concentration and power damages social cohesion, reduces equality of opportunity and social mobility, and erodes
democratic governance.7 By falling into this dynamic, European policy makers are failing the EU’s social contract.
Oxfam’s global Even It Up campaign is highlighting the role that growing inequality and wealth concentration play in exacerbating poverty. Europe needs to tackle poverty and inequality. It is time to rebalance voice and power in policy decision making within Europe, putting people first.
Governments in Europe must reverse the trend, make human rights central and demonstrate how proper regulation can both boost sustainable growth and enhance social welfare. In doing so it can
become, again, an inspiration for other countries and regions around the world.
2 UNACCEPTABLE
LEVELS OF POVERTY AND INEQUALITY IN THE EU
What many tend to forget is that poverty and social exclusion, being the direct result of inequality, undermine the very fundamentals of our society. As history has already shown us, this threatens the existence of our democratic system.
Martin Schulz, President of the European Parliament8 From a global perspective, the EU is a union of rich countries. These 28 countries have an average gross domestic product (GDP) per capita of
€26,600.9 Across the continent European countries pride themselves on being stable democracies that look after their citizens. However, within these same prosperous nations, almost one in four people is at risk of poverty or social exclusion,10 equivalent to more than 123 million people.11 In 2014, a UNICEF report found that more than 30 percent of children in Romania, Italy, Spain, Lithuania and Latvia live below the relative poverty line, as do more than 40 percent of children in Greece.12 Almost 50 million people in EU countries live with severe material deprivation, without enough money to heat their homes or cope with unforeseen expenses.13
Unemployment levels in many EU countries remain high: more than 15 percent in Greece, Spain, Croatia, Portugal and Cyprus in 2013.14 In Greece, the country with Europe’s highest unemployment rate, the lack of jobs has affected women most, with a female unemployment rate of 31 percent versus 25 percent for men. Even people who do have jobs struggle to provide for their families, as real wages have fallen sharply.
Data for 2013 found that nine percent of working households – more than 8.5 million people – are at risk of poverty despite being in work.15 In many countries in the EU, workers are earning less in real terms than before the global financial crisis began in 2008.16 An International Monetary Fund (IMF) study finds that Spain and Greece in particular have seen workers’ share of national income fall further behind in the years since the crisis.17
Box 2. Low wages and precarious work
Patricia is 47 years old and lives in London. She used to work at a housing benefit office, until giving up her position a decade ago to care for her father who suffered from dementia. After her father died, she tried to get back into employment by working at a local school. But the school can only offer her very few hours so she earns less than £200 a month. Patricia first used a food bank in October 2014 because of her low income.
I ended up at the food bank because all my debts got on top of me, and I couldn’t find any way out. My wages were so low, and there was no overtime. I had debt collectors knocking on my door. How could I not have money for food when I’m working – I couldn’t understand it. Sometimes I feel so sick. When I get paid I can eat for the first two weeks. And then I’m out of money.
Source: Church Action on Poverty, Oxfam GB and the Trussell Trust (2014)18
Poverty in the EU is soaring
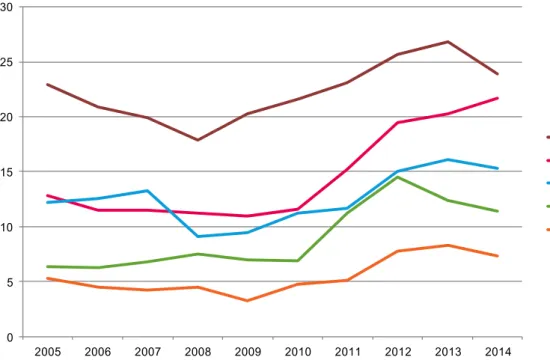
The most worrying news is that a large number of EU countries have seen an increasing number of people falling below national poverty lines in recent years.19 Between 2009 and 2013 an additional 7.5 million people were classified as living with severe material deprivation across 27 EU countries.20 In 19 EU countries the proportion of people living with severe material deprivation has increased. Figure 1 shows the five countries in which the proportion of people living with severe material deprivation has increased by five percent or more between 2009 and 2013. Only Poland and Romania saw their poverty rates decline by more than one percent over this period, falling by 3.1 and 3.7 percent respectively.
Figure 1: Proportion of people with severe material deprivation in the five EU countries where this proportion increased by five percent or more between 2009 and 2013
0 5 10 15 20 25 30
2005 2006 2007 2008 2009 2010 2011 2012 2013 2014
Hungary Greece Cyprus Italy UK
Source: Eurostat data, http://ec.europa.eu/eurostat/data/database
Single-parent households and households with dependent children are at the highest risk of poverty. The number of children (aged under 18) living in poverty within the EU grew by one million between 2009 and 2013.21 In 2013, nearly 28 percent of children in the EU were living in poverty, equivalent to more than 26 million children.22
Box 3. Hungry children in schools
For the average primary school teacher in Europe it is obvious what poverty looks like and what the consequences are. Recent studies in the UK and the Netherlands brought to light that they see an increasing number of children who come to school without having eaten breakfast, who have not washed and have worn-out clothes.
In the UK, three-quarters of school headteachers surveyed reported that they were frequently or occasionally providing food to pupils – in addition to free school meals – with 38 percent doing so frequently. Almost half (46 percent) have provided children with basic items of clothing, such as underwear; 24 percent have provided laundry facilities and 15 percent were providing shower facilities. UK head teachers feel that poverty is having an effect not only on the number of pupils arriving at school hungry, but also on their concentration, mental health and self-esteem.23
A Dutch schoolteacher reported:24
‘Kids regularly approach me and say “I am really hungry”. They have not eaten and they don’t carry any food with them. They have to stay over without food. They wear a thin coat in the winter and too large shoes.
There’s dirt under their nails and they have bad breath.’
The report drew this reaction from the Dutch Ombudsman:25
One in nine children live below the poverty line in the Netherlands. This amounts to 380,000 children – three in every school class of 30 children on average. Those children are often ashamed of their situation and end up becoming isolated (for example, they do not invite other school kids to their homes).
Author: Esmé Berkhout, Policy advisor, tax justice and inequality, Oxfam Novib
Specific groups are more likely to be poor, while others are much more likely to be rich
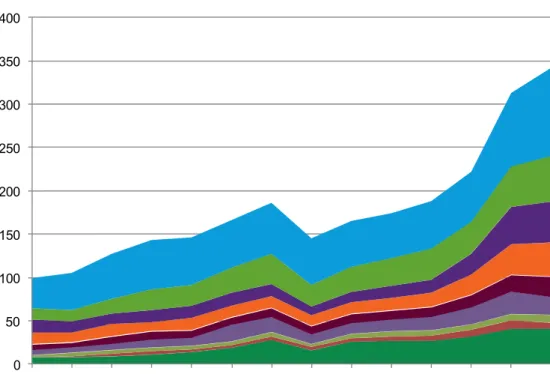
Not everyone in Europe lives in poverty and not everyone’s fortunes have been declining in recent years. Europe is home to some of the richest people, most profitable businesses and most valuable assets in the world – and many are prospering. The luxury goods sector in Europe increased by 28 percent between 2010 and 2013.26 Europe is now home to 342 billionaires, with a combined wealth of almost $1.5 trillion.27 In Spain, where more than three million people were living in severe deprivation in 2014, there are 21 billionaires with a combined wealth of $116bn.28
Figure 2: Number of billionaires in EU countries (2002–15)
Source: Deborah Hardoon, Senior researcher, Oxfam GB. D. Hardoon (2015), http://policy-
practice.oxfam.org.uk/publications/background-data-for-oxfam-briefing-a-europe-for-the-many-not-the- few-exploring-575925, based on Forbes data from annual rich list, http://www.forbes.com/billionaires/
Some groups of people in society are much more likely to be on the richer end of the income distribution scale than others. For example, 85 percent of billionaires in Europe are male – women are much less likely to be in this elite club. At the same time, women are disproportionately represented among the number of people at risk of poverty in the EU, with six million more women having incomes below 60 percent of the median than men. Women earn less than men for equivalent work;
across the EU there is an average wage gap of 16 percent.29 The
variation across EU countries is substantial, with a pay gap as high as 30 percent in Estonia and as low as three percent in Slovenia. Although in some countries the gender wage gap has reduced since 2010, this has more to do with the erosion of men’s wages, than any move towards gender equality.30 More women than men are in precarious and part-time work, which will have consequences for their health and well-being,31 while women pensioners in Europe are on average 39 percent worse off than men.32 Women also undertake an excessive share of unpaid domestic duties, spending double the number of hours that men do on these responsibilities.33 Younger mothers and mothers with young children are the least-employed parent groups, and this is exacerbated for single mothers. Across Europe, 10 percent of families have a lone parent, but only one percent of these are single fathers with the
remaining nine percent as single mothers.34 These families are at a much higher risk of poverty. In the EU, the poverty risk for children living in lone-parent households is almost twice as high as the average poverty risk for all children together (34 percent against 19 percent).35
Young people in the EU are now also struggling more than previous generations, particularly since the global financial crisis. Whereas previously the over-65s represented the majority of the EU’s low income
0 50 100 150 200 250 300 350 400
2002 2003 2004 2005 2006 2007 2008 2009 2010 2011 2012 2013 2014 2015
Germany United Kingdom France
Italy Sweden Spain Netherlands Austria
Other EU country
groups, by 2014 this group had been overtaken at the bottom of the income distribution scale by those aged 18 to 29.36 There are now more young people that are on low-pay or are unemployed than pensioners at the bottom of the income distribution scale.37 This same group is
increasingly likely to be living in poverty: in 2013, nearly 32 percent of young people in the EU were living in poverty, more than 13.1 million young citizens, almost half a million more than in 2010.38The average age of the 342 EU billionaires is 61.39
Migrants are more at risk of poverty
40Migrants tend to face a higher risk of poverty than other groups. While the at-risk-of-poverty rate of the population born in the country of residence varies from 10 to 23 percent across the EU, the rate for migrants, defined as those born outside the EU, exceeds 40 percent in Belgium, Spain, Cyprus, Greece and Finland.41 On average in the 28 EU nations, children with parents born overseas are almost twice as likely to be at risk of poverty (35 percent compared to 18 percent) in France, Denmark, Austria, Slovenia, Finland and Sweden.42 Social mobility is much harder to achieve among migrant populations and discrimination exacerbates income and wealth inequalities.
Among women, 33 percent of migrant women live at risk of poverty versus 16 percent of women living in their home countries.43 A European- wide survey found that 23 percent of people from ethnic minority or immigrant groups reported discrimination, compared with 12 percent in the rest of the population.44 This discrimination is associated with lower incomes – 46 percent of the people who experienced discrimination came from the lowest income quartile and were twice as likely to be unemployed (24 percent) than those who did not experience
discrimination (12 percent). Migrant women (especially those that are undocumented) also face additional discrimination through higher levels of violence, a lack of access to healthcare systems and a lack of
protection in the labour market.
Migrants are often relegated to the bottom of society. There is a widespread public belief among European citizens that migrants
contribute less in taxes than they receive in health and welfare services in their host countries.45 This misleading perception suggests that
migrants are a burden on public budgets and are supported by the higher taxes paid by native-born citizens. On the contrary, a comparative
international study of the net fiscal impact of migration,46 which includes a broad range of Organisation for Economic Co-operation and
Development (OECD) countries,47 shows that in most countries (except in those with a large share of older migrants), migrants contribute more in taxes and social contributions than they receive in individual benefits.
This is the case, for instance, in Italy, Greece, Spain and Portugal. In 2012, the taxes paid by migrants in Italy were higher than the benefits they received through public expenditure on health, education, social protection and housing. Their net contribution to the national budget was
€3.9bn,48 or around 0.2 percent of Italian GDP.49
According to OECD, where migrants make a lower or negative fiscal contribution, this is not because they are more dependent on public expenditure or welfare payments, but rather because migrants are often concentrated among the lowest-paid workers, which means they
contribute less in taxes and national insurance than higher-paid workers.50 Employment and wage levels are the most important determinants of migrants’ net fiscal contribution.51
This is highly relevant given the EU’s need for additional workers.52 Policy makers need to extend their focus beyond simply managing immigration flows and fighting against irregular migration to include a much greater focus on how to ensure the most effective social and professional integration of migrants.53 Reducing inequality and promoting integration policies to close the gap between migrants and native
populations can be highly cost-effective. Efforts to design and implement fair integration policies should be seen as an investment rather than a cost for EU countries.
Inequality: An uneven share of resources
Poverty in EU countries is not a problem of scarcity. Rather, it concerns how these resources are shared and how a small minority of people disproportionately gain a level of income and wealth well beyond their need, while others are excluded and struggle to pay their bills.
Calculating the ratio of income of the richest 10 percent of people against the poorest 40 percent, using the Palma measure of income inequality, gives an idea of the extent to which income is disproportionately skewed towards the richest in a country. Bulgaria and Latvia have the highest levels of inequality in the EU, with the income of the top 10 percent 1.4 times higher than that of the bottom 40 percent. In Slovenia and
Slovakia, the two countries with the lowest Palma ratio, the income of the top 10 percent is 0.8 times the income of the bottom 40 percent.
Countries with higher income inequality also tend to have a higher proportion of people living in poverty; those with more egalitarian distributions of income see far fewer people suffering from severe material deprivation.
Figure 3: Correlation of Palma measure of inequality, after taxes and transfers, against the proportion of people living with severe material deprivation
Source: Deborah Hardoon, Senior researcher, Oxfam GB. D. Hardoon (2015), http://policy- practice.oxfam.org.uk/publications/background-data-for-oxfam-briefing-a-europe-for-the-many-not- the-few-exploring-575925, based on Eurostat data54
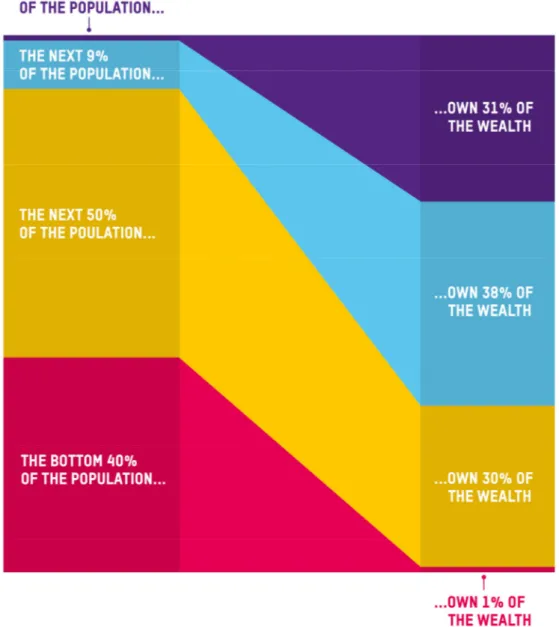
Wealth is even more unequally distributed in Europe than income. Credit Suisse estimates that the richest one percent of Europeans possess almost a third of the region’s wealth.55 The rest is split between the others in the top 10 percent of the region and half the population of the region between the fourth and ninth deciles. There is barely any wealth left over – less than one percent of the total net wealth in Europe – for the bottom 40 percent of the population. The richest seven million people in Europe now have the same amount of wealth as the poorest 662 million (including non-EU countries).56 In the Czech Republic, Sweden, Denmark and Cyprus, the top 10 percent in each country possess more than two-thirds of their nation’s wealth, compared with nearer one-third in Slovakia and Slovenia.
Slovakia
SIovenia
Sweden
Czech Rep
Netherlands
Finland Belgium
Austria Denmark
Malta Hungary
Germany Ireland
UK Croatia
Luxembourg Poland
France
Italy Estonia
Cyprus
Spain Romania
Portugal Greece
Lithuania Latvia
Bulgaria
0 5 10 15 20 25 30 35 40 45
0.7 0.8 0.9 1 1.1 1.2 1.3 1.4 1.5
Percentage of the population in material deprivation
Palma ratio – Income top 10% : Income bottom 40%
Figure 4: Percentage distribution of wealth in Europe
Source: Deborah Hardoon, Senior researcher, Oxfam GB. D. Hardoon (2015), http://policy- practice.oxfam.org.uk/publications/background-data-for-oxfam-briefing-a-europe-for-the-many-not- the-few-exploring-575925, based on data from Credit Suisse
The most vulnerable face the greatest costs
Even before the crisis, EU countries had structural problems of unequal distribution of economic gains. According to data from the OECD, which includes 20 EU countries, between 2007 and 2010, the poorest 10 percent of the population tended to lose out more, or gain less, than the richest 10 percent of people, in terms of changes to their disposable income.57
In the wake of the global financial crisis, as jobs and resources have become scarcer in many European countries, it is even more important that income be shared in a way that prevents the most vulnerable people from falling further into poverty and deprivation. In recognition of the extent to which poverty is affecting so many citizens, in 2010 the EU established the Platform against Poverty and Social Exclusion as part of its European 2020 Strategy, in order to help lift 20 million people out of
poverty in the EU.58 However, since then poverty rates have only
increased further, while at the same time, those at the top maintain their privileged positions. Top executives across the EU continue to reward themselves pay increases above the rate of inflation,59 while real wages for other workers continue to fall. In some countries extremes of wealth and poverty have grown in parallel, increasing the gap between the richest and poorest sections of society. In Germany, for example, between 2005 and 2013, the proportion of people at risk of poverty increased from 12 to 16 percent, while the total net wealth held by billionaires increased from $214bn to $296bn during the same period.
Box 4. Social inclusion and the Europe 2020 strategy
The Europe 2020 strategy60 was introduced with good intentions: to improve the social situation across the EU. The strategy’s headline targets included bringing 20 million Europeans out of poverty and social exclusion.
However, one of the main obstacles to pushing ahead with the strategy is the EU’s lack of coordination between economic and social policies, with the former taking precedence over the latter. This is leading to a
dismantling of social rights, which undermine well-developed social models in the EU and push people further away from the European project. To address this situation, it is essential that a balanced socio-economic mix with a rights-based approach across all policies be implemented to safeguard and promote fundamental rights. While this will help reach the strategy’s headline targets, we would welcome the addition of a target on inequality to complement – not replace – the target on poverty and social exclusion, which would serve to reinforce the inclusive growth objective of Europe 2020.
Author: Pierre Baussand, Director of the European Social Platform
The increase in poverty rates in Europe between 2009 and 2013 was caused not only by the financial crisis but, in many countries, by the effects of the austerity policies which followed.61 In Greece, about half of the total increase in poverty62 in 2010 and 2011 can be attributed to the effects of austerity policies (such as cuts in public services).63 In Spain, stimulus policies adopted in 2008 and 2009 had an important poverty- reducing effect in 2010, but in 2011, austerity measures imposed by the Troika64 accounted for almost 65 percent of the total increase in
poverty.65
The redistributive effect of fiscal policies
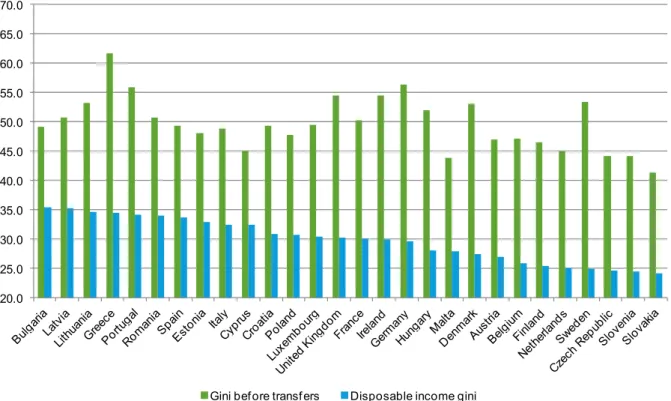
Governments have many policy tools at their disposal to reduce the unequal distribution of income and wealth to ensure that no citizens are left behind, that the poorest sections of society do not suffer most, and that women are not discriminated against, particularly during times of slow or negative economic growth. Taxes from the income, wealth and profits of those who are prospering can help to feed a welfare system that provides health, education and social protection for all. In many European countries, the tax and transfer system has done a lot to make the distribution of income fairer. Countries such as Germany, Denmark and Sweden see their Gini coefficient66 fall dramatically, after taking into
account redistribution through taxes and transfers. Other countries like Bulgaria and Spain see a much smaller change in their Gini coefficient before and after taxes and transfers, and remain some of the most unequal countries in the EU.67
Figure 5: Gini coefficients of EU countries, before and after taxes and transfers (2013)
Source: Deborah Hardoon, Senior researcher, Oxfam GB. D. Hardoon (2015), http://policy- practice.oxfam.org.uk/publications/background-data-for-oxfam-briefing-a-europe-for-the-many-not- the-few-exploring-575925, based on data from Eurostat (2013)
The high levels of redistribution in countries like Germany and Sweden suggest that these governments used their fiscal tools effectively to attenuate income distribution, raising a lot of taxes from the rich and using this revenue to better fund schools, healthcare systems, care services and other policies and services that help those living in poverty.
But higher levels of public expenditure are not always correlated with high levels of redistribution. The relationship between the two is positive, but weak.68 Redistribution is not just a matter of how much money is raised in revenue and spent on public services, but also of how progressive those fiscal policies are. While Germany and Spain both achieved a reduction of their income inequality through taxes and
transfers of 27 Gini points, Spain’s government expenditure at 59 percent of GDP is 15 percent higher than Germany’s at 44 percent of GDP.69
20.0 25.0 30.0 35.0 40.0 45.0 50.0 55.0 60.0 65.0 70.0
Gini before transfers Disposable income gini
Box 5. Denmark: An equitable model threatened by inequality
Politically, socially, culturally and economically, Denmark is one of the most equal countries in the world. Its Gini coefficient after taxes and transfers is 27.5, below the average in the EU.70 The impact of taxes and transfers on Denmark’s Gini coefficient is considerable. Denmark is consistently ranked among the top countries in measurements of well-being,71 and social mobility is high. This is the result of a properly functioning social security net, a flexible labour market (known as the ‘flexicurity model’) and access to high-quality free healthcare and education (including higher education) for all Danes. Danish society is characterized by social cohesion and a generally high degree of trust among its citizens in social and political institutions.72 Most Danes accept the need to pay a relatively high
percentage in income tax as they experience the benefits provided by the state.
However, such a broad spectrum welfare system does not come free of charge. Denmark has the highest tax-to-GDP ratio in the OECD.73 Yet, despite their size and scope, Denmark’s ‘generous welfare services’ are only the ninth most expensive welfare option in the OECD. In comparison, the UK, Germany and the US are all in the top five – despite the US not having a free, universal healthcare system.74
The Danish model has come under increasing pressure in recent years.
Inequality in Denmark is rising and has been for the past 20 years. There is a growing gap between the richest and poorest – the top 20 percent earn nearly four times as much as the bottom 20 percent, a considerably smaller gap compared to other countries in the EU, but still greater than in the past.75 In particular, the growing income gap between wage earners and CEOs is cause for concern. Between 2003 and 2012, the average wage of a Danish CEO increased by 23.3 percent. Over the same time period, workers (both skilled and unskilled) received wage increases of only 0.5 percent.76 This increasing inequality, alongside decreasing levels of social mobility, is leading to a greater geographical divide between rich and poor people and threatens to undermine the historically high degree of social cohesion in Denmark.77 If put under much further pressure, the credibility and trustworthiness of the system to work for the many rather than the few could be jeopardized.
Author: IBIS, Denmark
POVERTY AND INEQUALITY ARE BAD FOR ALL
Left unchecked, high levels of inequality risk causing many more people to fall into poverty in Europe, trapping more in unemployment or low wages and precarious work. Oxfam’s Even It Up report also highlighted multiple other pernicious consequences of high and rising inequalities within countries around the world.78 From slowing down growth prospects to eroding the social fabric of societies and exacerbating health and education inequalities, inequality must be tackled now, for the good of all, but especially the poorest citizens.
Box 6. Extreme inequality is bad for growth and the economy
There is now strong evidence to refute the old wisdom of a trade-off between growth and equality. It is now known that the health and strength of an economy depends on equitable growth. For instance, in 2014 research from the IMF concluded that countries with high inequality experience shortened growth spells.79 A further IMF paper in 2015 expanded on this to state that the income distribution itself matters for growth as well; if the income share of the rich increases, then GDP growth actually declines over the medium term, suggesting that the benefits do not trickle down. In contrast, an increase in the income share of the poor is associated with higher GDP growth.80
A high level of inequality can hurt the economy by keeping down demand among consumers, as stagnant wages among workers leave little
discretionary income for spending. Being dependent on the spending patterns of rich people to prop up an economy is not only unjust, it also introduces volatility and has been cited as a cause of Europe’s prolonged recession.81
Given the poverty-reducing potential of growth, this is highly relevant for pro-poor policy agendas in developing countries. However, inequality equally threatens growth in high-income countries too.
The OECD found, when looking back over the past 30 years, that income inequality has had a significant negative impact on growth.82 The OECD analysis, which includes 20 EU countries, found that in Italy and the UK, the cumulative growth rate would have been 6 to 9 percentage points higher had income disparities not widened. In Sweden, Finland and Norway, the increase in inequality, in each case from initially low levels, was also found to have held back growth. On the other hand, in Spain, France and Ireland relatively lower levels of inequality prior to the financial crisis helped to shore up their GDPs. A more recent OECD study
underlined the positive impact of redistributive social policies on economic growth.83
Authors: Nick Galasso, PhD., Senior researcher, Oxfam America and Deborah Hardoon, Senior researcher, Oxfam GB
3 A VICIOUS CYCLE OF ECONOMIC
INEQUALITY AND
POLITICAL CAPTURE
It is economic power that determines political power, and governments become the political functionaries of economic power.
Jose Saramago, winner of the Nobel Prize for Literature84 Inequality and political capture – that is, the control of power and politics by an elite group – are profoundly interlinked. Concentrations of wealth provide economic elites with the power and access to lobby and dominate policy making spaces across Europe. This creates a vicious cycle where these elites influence policy making and regulations to benefit their interests, often resulting in policies that are detrimental to the interests of the many, which in turn makes inequality worse and
reinforces the power of elites still further.
Wealth accumulation is directly linked to the power to influence decision making, while those suffering from poverty, vulnerability and exclusion lack the capacity to demand fairer policies of redistribution, equal opportunities and empowerment. There is a risk that the dynamics of wealth concentration, political capture and increasing poverty – already common to many countries – will become institutionalized across Europe.
Powerful, unaccountable corporate lobbies
Although exact data on lobbying activities are hard to find due to the lack of transparency that prevails within this industry, available evidence suggests that such lobbying is a large and increasing problem,
particularly in certain sectors and policy areas, at both the country and the EU-wide level.85
The financial lobby in the EU is among the most powerful. In Brussels alone, it is estimated to have spent €120m in 2013.86 Between mid-2013 and the end of 2014, civil servants at the European Commission, the executive body of the EU, had on average more than one meeting every day with a financial sector lobbyist.87 The Corporate Europe Observatory estimates that the financial lobby outspent trade unions and civil society organizations by seven to one on matters of post-crisis EU regulation.
This has led to claims that regulations have been captured by the financial sector and that influence from other actors, including trade unions and civil society organizations, has been largely ineffective.88
Box 7. Political capture and the European financial transaction tax
The negotiations on the European financial transaction tax (FTT – a small tax on financial transactions) illustrate how efforts to create a fairer and more equal European economy are being resisted by the financial sector, which has used its considerable influence to capture the political debate around the FTT negotiations.
The high-risk strategies and speculative transactions of the financial sector played an important role in bringing about the financial crisis that swept across the continent and still affects millions of European citizens today.
The FTT would help to discourage future speculative transactions that are not linked to the real economy and that make the system more prone to systemic shocks or crises. The FTT would also raise new revenue, which could be used to offset domestic austerity measures and to support the global fight against poverty, inequality and climate change.
However, the FTT negotiations have been captured by the financial lobby.
Oxfam estimates that the financial lobby spends on average €73m every year to try to influence the European Commission over these negotiations.
This is a remarkable sum of money, 10 times more than that spent by civil society organizations working in the same field (€7m).89 Informally, a civil servant working on the FTT acknowledged to Oxfam that for every meeting request sent by a civil society organization, he receives 40 from the
financial sector.
The efforts of the financial lobby have ranged from directly asking the Commission to withdraw the proposal for an FTT, to commissioning reports warning about the ‘uncertainty’ and catastrophic impacts of the tax, but which consistently fail to look at the positive consequences of additional tax revenues.90 Until the FTT has been agreed it will not be possible to tell who will come out on top: European citizens91 or the financial elites trying to protect their own interests. More than a million citizens have asked European governments to agree on an ambitious FTT to fight poverty and climate change.92 The negotiations represent a case study about how far small but powerful groups are willing to go in order to capture political processes that have an impact on their interests.
Author: Javier Pereira, EU policy adviser, Oxfam EU Advocacy Office
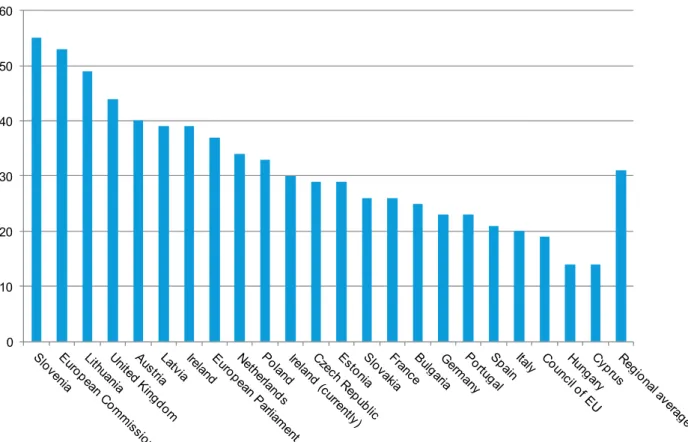
The cosy relationship between business and politics was identified as a particular corruption risk right across Europe in a 2012 Transparency International report analyzing the integrity of core institutions in countries within the EU.93 Looking across both European and national levels, a subsequent report published in March 2015 assessed EU countries on their transparency, integrity and equality of access for lobbying
regulations.94 This report found that Slovenia, while still falling short of an excellent score in all three dimensions, was the only country to be
classified as having ‘sufficient’ regulation.95
Figure 6: Scores for regulation of lobbying in EU countries and
institutions (combined un-weighted average of scores for transparency, integrity and equality of access of lobbying regulations: score 0–100, where 0 is weakest and 100 is strongest)
Source: Deborah Hardoon, Senior researcher, Oxfam GB. D. Hardoon (2015), http://policy- practice.oxfam.org.uk/publications/background-data-for-oxfam-briefing-a-europe-for-the-many-not- the-few-exploring-575925, based on data from Transparency International (2015)
Most of the monitoring and analysis of lobby expenditures is currently done by civil society organizations. The LobbyFacts.eu website for example provides interesting analysis of who is lobbying European institutions in Brussels; it shows that more than 60 percent of EU lobbyists represent corporate interests.96 While these civil society organizations are doing an essential public interest job, it should not prevent decision makers from regulating for greater lobbying
transparency and ensuring that there are sufficient monitoring tools to detect cases of conflict of interest.
Who is really making the rules?
The European Ombudsman97 has recently opened an investigation concerning the transparency of wider policy influencing at the European level on the Commission’s expert groups.98 The preliminary results of this work suggest that policy making is being influenced not only by direct lobbying, but through the creation of interest groups, often meeting legitimately and privately in Brussels, but whose ‘group-think’ and wide network of influence at every level of policy making becomes highly significant.99
Taxation policies are a very good example of a worrying trend of providing privileged space to certain interests. The composition of
0 10 20 30 40 50 60
European Commission expert groups on taxation reveal much about the corporate interests that are party to decision making at the EU level.
Box 8. European tax policies reflect corporate interests
Tax rules – and the continued existence of tax loopholes and competition between countries to attract profits – are of particular interest to large corporations involved in tax dodging schemes100 with a strong interest in maintaining the status quo. Therefore it is not surprising to see that they are massively and disproportionately represented in the European Commission’s expert groups.
Until 2012, approximately two percent of participants in European Commission expert groups on tax matters represented a public interest (such as trade unions, consumer groups and civil society organizations). By 2014, this had improved, but 82 percent of participants still represented a private or commercial interest.101 Oxfam is a member of two expert groups on tax matters: the European Commission Platform for Tax Good
Governance102 (since May 2013) and the expert group on automatic exchange of financial account information (AEFI) (since August 2014). In both groups, the private sector is disproportionately represented, including by accounting firms and financial institutions that have allegedly taken part in tax dodging schemes.
While there is a higher representation of non-government organizations (NGOs) and trade unions in the European Commission Platform for Tax Good Governance than in many other expert groups, the overall composition remains unbalanced in favour of corporate interests. Sixty percent of the 15 non-government members represent corporate interests compared to only 20 percent for NGOs and 14 percent for trade unions.
This goes against the European Commission’s commitment to the European Parliament that no expert group be dominated by corporate interests.103
After the Luxleaks scandal,104 Oxfam and others officially complained in a letter to the European Commission105 about the participation of
PricewaterhouseCoopers (PwC) in the work of the Platform on Tax Good Governance. This letter argued that there was a conflict of interest and that PwC could not contribute to monitoring the implementation of European tax legislation while at the same time facing allegations of helping multinational corporations to put in place aggressive tax dumping106 strategies to shift profits to Luxembourg in order to pay as little as one percent in corporate income tax. Similarly, questions have been raised regarding membership of the AEFI expert group, when members like HSBC – involved in the
Swissleaks tax dodging scandal107 – are also advising on implementing European legislation which would compel banks to share essential information with European tax authorities.108
Author: Catherine Olier, Tax Justice Policy advisor, Oxfam
The current joint lobby transparency register, a voluntary approach to EU lobbying requirements (with no sanctions for non-registration), is clearly failing to provide transparency on who is lobbying for what. In the EU, several major companies that are actively lobbying in Brussels are not registered; while underreporting and implausible entries in the register are common.109
POLITICAL CAPTURE LEADS TO INCREASING DISAFFECTION
This ‘culture of interests’ and the tendency to keep working with those who lobby regularly rather than seeking out new stakeholders has lead to social, environmental and economic policies that too often do not reflect the public interest and increase the democratic gap between EU
institutions and European citizens.110
Many citizens in Europe are aware of the dynamics of political capture that are central to their lives. A 2013 survey found that the majority of European citizens perceived their governments as dominated by the vested interests of a few.111 This was particularly so in countries suffering the worst repercussions of the global financial crisis: more than 80 percent of people living in Greece, 70 percent in Italy and 66 percent in Spain.112
Figure 7: Percentage of respondents who believe their government favours the interests of elites (2013)
Source: Transparency International (2013) ‘Global Corruption Barometer 2013’
http://www.transparency.org/gcb2013
As a result, many citizens feel increasingly disaffected towards their own governments, national and European institutions and the overall
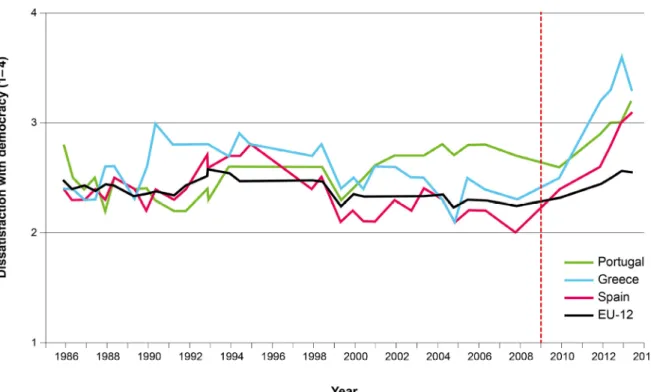
functioning of democracy. For example, Eurobarometer survey results between 1986 and 2013 indicate that a majority of citizens in the southern Mediterranean are dissatisfied with democracy (Figure 8).
Figure 8: Dissatisfaction with democracy in Greece, Portugal, Spain and the EU (1986–2013); values: 1=very satisfied to 4=very dissatisfied)113
Source: D. Muro and G. Vidal (2014), http://blogs.lse.ac.uk/europpblog/2014/03/13/persistent- unemployment-poses-a-substantive-threat-to-democracy-in-southern-european-
countries/#comments, data from Eurobarometer
The combination of political capture dynamics, unacceptable levels of poverty and inequality, and increasing disaffection across EU societies constitute a worrying threat to the proper functioning of democracies.
4 OTHER DRIVERS OF INEQUALITY AND
POVERTY IN EUROPE
Internal devaluation has resulted in high unemployment, falling household incomes and rising poverty – literally misery for tens of millions of people.
László Andor, former European Commissioner for Employment, Social Affairs and Inclusion114 The levels of equity in any society are strongly influenced by policies relating to wages, taxation and public spending. These policies should ensure the sustainability of public services as well as redress inequalities and promote equal opportunities for all. Three factors are key to this:
• Wages are a determinant of income levels;
• The tax system determines who will pay taxes, how much they will pay, the volume of public revenue collected and the degree to which wealth and income are redistributed;
• Social policies, as the main redistributive tool, determine the provision and coverage of those public services provided by the state.
Most of these policies are drafted, agreed and implemented at national levels by EU member states. But EU institutions play a crucial role in shaping their orientation. The reality is that policies adopted by EU member states have, in too many cases, reflected the interests of economic and financial elites rather than those of the majority of society, including the most vulnerable and poorest citizens. That is the case with the privatization of public services, like healthcare or education, which benefits the owners of private providers; or the liberalization of financial markets that enabled tax dodging by large multinational companies and wealthy private individuals; or the reduction of top marginal tax rates that benefit those with higher incomes and wealth. This pattern is even clearer with the policies adopted by some EU member states since 2008 in response to the financial crisis.
Box 9. EU institutions at the core of the austerity measures
As an informal but very powerful group, the Troika has been at the forefront of policy making for countries under economic stress.115
There are two mechanisms through which their policy influence is applied:
1. The Troika programmes imposed on Spain, Portugal, Ireland and Greece, exchange access to credit for severe cuts to certain areas, including public sector employment, extending privatization of public services and deregulating the labour market.
2. The Fiscal Compact116 has introduced, and in practical terms is implementing, austerity measures on a long-term basis into the governance mechanisms of the EU.117 It installs a maximum limit of 60 percent of debt with reference to national GDP, and prevents any new indebtedness beyond 0.5 percent of GDP per year. All governments that transgress these limits have to ask the European Commission and the European Council to approve their national budgets. Violations of the compact can be punished with financial sanctions. The agreement with the compact was established as a condition in order to get access to the European Stabilization Mechanism (ESM).
Both mechanisms offer access to credit lines – desperately needed in times of crisis – at a cost of tight national economic policy control at the European level.
These mechanisms are not safeguarding the needs of ordinary people. The fiscal compact (as a constitutional anchor for austerity policies inside the EU) and the Troika programmes (as funding mechanisms) are preventing governments from acting outside the framework of austerity while at the same time protecting private assets that could be at stake if policies that put people first were implemented instead.
Effectively, these EU mechanisms have ignored the social needs of millions of European citizens living in highly vulnerable situations at or below the poverty line.
Author: Jörg Nowak, Researcher on social inequality, Oxfam Germany
4.1 AUSTERITY MEASURES: A MEDICINE THAT KILLS
Austerity measures implemented across Europe – based on short-sighted, regressive taxes and deep spending cuts, particularly to public services, such as education, health and social security – have dismantled the mechanisms that reduce inequality and enable equitable growth. These measures are having a severe impact on European societies, at a time when many countries are already experiencing historic high levels of unemployment, and women are still suffering unequal access to opportunities in many countries.118
Education and training are important factors in determining an individual’s subsequent earning capacity and social mobility.119 Limiting access to education and vocational training – through fewer publicly funded options and fewer scholarships – can contribute to increased inequality. Income inequality depresses skills development among individuals whose parents
have low educational attainment. Children from poor households are more likely to reduce their education in terms of quantity (e.g. the number of years of schooling) and quality (i.e. their range of skill proficiency). The educational outcomes of individuals from richer backgrounds, however, are not affected by the levels of income inequality in a society.120
Austerity has exacerbated gender inequality in a number of dimensions.121 Reduced spending in the public sector means that women, who make up the majority of public sector workers, are more likely to lose their jobs or see a negative impact on their wages. Reduced public services, such as health, education and childcare, also increase the burden of care which falls to women. According to research conducted on the impact of austerity in Europe,122 after the financial crisis mothers of small children were less likely to be employed than before and more likely to attribute their lack of employment to cuts in care services.123 As public services and social protection measures, such as parental leave are cut, women are more likely to take up part-time work in order to manage their care responsibilities, which limits their earning potential.124
Cuts in public spending
In some countries, cuts in public services were agreed as part of the EU Troika programmes (for example, in Greece, Portugal and Spain). A recent study of seven European countries shows how spending cuts increase inequality even more than increases in taxes on
consumption.125 In 2010, spending on health in Europe recorded its first drop in decades. In Spain, public expenditure on health and education has dropped by 21 percent since 2010.126
For these countries, this has meant the loss of huge numbers of public sector jobs and vital public services. Significant personnel cuts in the public sector have been reported in Greece (down by 25 percent), Portugal (down by 10 percent) and Romania (also down by 10 percent).
In the UK, it is estimated that 710,000 public sector jobs will be lost by 2017 and it is estimated that around twice as many women as men will lose their jobs.127 In some countries, the cutbacks have focused on female-dominated sectors, such as education, health and social work.128 In addition, both Spain and Ireland have cut public sector wages, while in the UK and Portugal, they have largely been frozen.129
Moreover, European governments have significantly cut social security budgets. Greece, Latvia, Portugal and Romania all saw decreases of more than five percent in their 2011 budgets.130 As social security budgets have fallen, Europe’s poorest people have faced a loss of services and support. Some countries have reduced social security payments in real terms,131 making it harder for families to cope with unemployment and to meet the cost of living.
Privatization of public services
As part of their austerity measures, many countries have taken steps to privatize public services, with the aim of reducing government budget
deficits. Greece, Portugal, Spain and Ireland have faced significant pressure from international institutions to privatize public utilities, for example by selling off state-owned energy, water and public transport companies, as well as healthcare institutions.
Although there is scope to improve the effectiveness and efficiency of social policies and public services, this trend towards increased
privatization leads to a segmentation of opportunities, skewing benefits towards the wealthiest. Moreover, public money and critical resources, such as health workers, are diverted away from the public sector and towards for-profit services that serve a minority of people, further deepening inequality. A downward spiral of deteriorating quality in the public sector and increasing economic inequality can be set in motion when private healthcare and education132 benefit only those who can pay, rather than those most in need.133
Box 10. Time to end Ireland’s unequal two-tier healthcare
The inequalities in Ireland’s healthcare system have been well
documented. Ireland has what is often described as a two-tier system, where access to healthcare is based on financial resources and
geographical location rather than on need. Approximately 45 percent of the population has private health insurance, which offers access to private hospitals and specialist care, while roughly 39 percent of the population hold medical cards, offering limited free access to public health services.
There is concern that recent austerity measures have widened this divide.
Since 2008, the health budget in Ireland has been cut by 12 percent; the harshest cut to a health budget in Europe as a percentage of the national budget. At the same time, decreasing incomes and rising unemployment rates (10.1 percent as of February 2015) have forced many out of
expensive private health insurance schemes. The number of private health insurance holders decreased by 245,000 between 2008 and 2014.
With such a fragmented private-public healthcare system, there is wide support in Ireland from across the political spectrum and civil society for universal access to healthcare. However, there is little agreement on how to achieve this. It has been argued that introducing universal healthcare in Ireland will be too expensive and over-complicated. However, universal healthcare costs could be offset against the potential savings arising from prevention strategies. Additionally, a fairer tax regime would increase public revenues, which could then be used to increase public investment in health services and deliver free healthcare for all.
Attempts by the current Irish government to deliver universal access to health have employed a model of universal insurance through competing private health insurers, a complex and fragmented model. Ireland should instead include a right to essential healthcare in its constitution and initiate a whole government approach to health policy, prioritizing public financing and delivery of care to see health for all realized.
Author: Helena O’Donnell, Public Affairs and Communications, Oxfam Ireland134
Lower wages and poorer working conditions
Countries implementing austerity measures have also deregulated their labour markets, relaxing employment regulation and reducing the rights of workers. This has been done on the assumption that it will promote a private sector-led recovery that mitigates the losses from public sector cuts. Yet, importantly, increases in labour market ‘flexibility’ have not been accompanied by social protection measures that could have protected those suffering from income insecurity.135
This, together with the erosion of collective bargaining systems, is very likely to result in widening inequality and a continued drop in real wage values.136
Box 11. Europe: An arena of wage competition and weakened collective bargaining
Cutting public deficits has been one of the pillars of the economic strategy promoted at the European level; the other has been to squeeze wages so as to become more competitive. European policy makers have embraced the idea that, in the absence of currency devaluation, wages must be devalued.
Workers across the Eurozone have become contestants in a game where individual countries try to escape the financial crisis and reduce
unemployment by poaching jobs and economic activity from their neighbours. In this race to the bottom however, there can only be one
‘winner’ and that is the member state that cuts wages the most.
Minimum wages in Spain and Portugal were frozen in nominal terms for several years. In Greece, minimum wages were cut by 22 percent for adult workers and by 32 percent for younger workers. Public sector wages were the next target, as these were thought to have an important signalling effect on private sector wage deals.
The main focus, however, has been on systems of collective bargaining.
Policy makers have significantly weakened these in a variety of ways. Legal measures that supported collective bargaining and ensured wide coverage were withdrawn or dismantled. Company-based agreements were allowed to undermine the standards of sector-level agreements. In certain cases, the shift to company-based agreements was even promoted by giving non-union employee groups, in most cases set up by the employer, the possibility to undercut the agreement negotiated by representative trade unions.
These are not just measures ‘at the margin’. They are reforms that strike at the heart of the system of collective bargaining itself. The number of workers covered by collective bargaining has collapsed in those countries where the most far-reaching measures were taken. In Portugal, the number of workers covered by collective bargaining shrank from 1.7 million in 2008 to just 100,000 in 2014.
International comparisons show that high coverage rates for collective bargaining are closely associated with lower levels of inequality. Bargaining collectively allows for the wages of workers in the lower half of the wage distribution to be strengthened. Also, as researchers from the IMF have pointed out recently, ‘lower unionization is strongly associated with an increase in top income shares in advanced economies during the 1980–
2010 period.’137