Duplicated genes and their relevance in the process of speciation
I n a u g u r a l - D i s s e r t a t i o n
Zur
Erlangung des Doktorgrades
der Mathemathsch-Naturwissenschaftlichen Fakultät der Universität zu Köln
vorgelegt von
Till Bayer
aus Köln
Köln, 2009
Berichterstatter: Dr. Bettina Harr
Prof. Dr. Diethard Tautz
Tag der mündlichen Prüfung: 23.6.2008
Table of contents
Table of contents
Table of contents ... I Danksagung... III Declaration ... V Zusammenfassung... VI Abstract ... VIII
1 Introduction ... 2
1.1 The genetics of speciation ... 3
1.2 Gene duplication ... 6
1.3 Selection ... 9
1.4 Mouse model ... 12
1.5 Aims of this study ... 16
2 A screen of duplicated genes for positive selection ... 17
2.1 Introduction ... 17
2.2 Materials and Methods ... 17
2.2.1 Search for duplicated genes and associated microsatellite loci ... 17
2.2.2 Microsatellite analysis ... 18
2.3 Results ... 21
2.3.1 Properties of duplicated gene dataset ... 21
2.3.2 Microsatellite screen for selection ... 22
2.3.3 Screen for selective sweeps ... 25
2.3.4 Age of duplicates in correlation to lnRH ... 33
2.4 Discussion ... 36
2.4.1 Duplicate genes dataset ... 36
2.4.2 Microsatellite screen ... 38
2.4.3 Conclusions ... 41
3 Estimation of duplication age ... 43
3.1 Introduction ... 43
3.2 Materials and methods ... 43
3.2.1 Animal material ... 43
3.2.2 Selection of genes ... 43
3.2.3 PCR assay for absence or presence of genes ... 44
Table of contents
3.2.4 Analysis of PCR assay ... 45
3.3 Results ... 45
3.4 Discussion ... 49
4 Analysis of Dnahc8... 51
4.1 Introduction ... 51
4.2 Materials and Methods ... 51
4.2.1 Animal material ... 51
4.2.2 Sample preparation and Sequencing ... 52
4.2.3 RNA and cDNA preparation ... 52
4.2.4 Polymorphism analysis ... 54
4.2.5 Phylogenetic tree ... 55
4.2.6 Detection of positive selection ... 55
4.2.7 Quantitative real time PCR and analysis ... 57
4.3 Results ... 58
4.3.1 Phylogenetic tree ... 58
4.3.2 Nucleotide polymorphism ... 58
4.3.3 Divergence in functional regions ... 60
4.3.4 Tests for positive selection... 62
4.3.5 Expression ... 65
Discussion ... 68
4.3.6 No evidence for selection on Dnahc8 from population genetic data ... 68
4.3.7 Amino acid divergence in known functional regions of dnahc8 ... 69
4.3.8 Tests for positive selection based on nonsynonymous vs. synonymous substitution rates ... 70
4.3.9 Expression ... 70
4.3.10 Conclusions with respect to speciation ... 72
5 References ... 74
6 Supplement ... 82
6.1 Digital supplement ... 90
Erklärung... 91
Danksagung
Danksagung
Zunächst einmal möchte ich Bettina Harr danken, dafür dass sie mir die Möglichkeit gegeben hat in ihrere Gruppe zu arbeiten und zu promovieren. Dank geht auch an Diethard Tautz, nicht nur für die Erstellung des Zweitgutachtens.
Während meiner Arbeit in den AGs Harr und Tautz habe ich unter den Kollegen viele Freunde gefunden. Manuel Aranda hat mir schon in der Diplomarbeit grundlegende Labortechniken beigebracht. Er und Chris Voolstra, mit dem ich lange ein Labor geteilt habe und auf dessen hochoptimierte Protokolle ich zurückgreifen konnte, sind mir gute Freunde geworden. Es hat auch Spass gemacht mit Ruth Rottscheidt zusammen zu arbeiten, auf die ich mich im Laboralltag immer verlassen konnte.
Viel von dem was ich über Mikrosatelliten weiss habe ich im gemeinsamen Kampf gegen den MegaBACE von Arne Nolte gelernt. Sowohl im Labor wie auch ausserhalb habe ich immer gerne Zeit mit Henrique Souza, Kathryn Stemshorn, Fabian Staubach, Tobias Heinen, Meike Teschke und Suma Choorapoikayil verbracht, ob bei Diskussionen der Probleme der Molekularbiologie, oder beim Klettern, Skifahren, Badminton spielen und Kuchen essen.
Auch Jochen Wolf hat den Laboralltag mit seinen Kurzbesuchen in Köln immer aufgeheitert, und war immer für interessante Diskussionen zu haben.
Nach der Zeit des Zusammenschreibens in Plön bin ich vor allem zwei Kolleginnen zum Dank verpflichtet: Leslie Turner, fürs Korrekturlesen und dafür dass sie mich in die Feinheiten der PAML Analyse eingeweiht hat, und Anna Büntge, für Unterstützung moralischer, logistischer und kulinarischer Art.
Gemeinsam haben alle Kollegen und Freunde der AGs Harr, Tautz und Damen die
Zeit in der Genetik interessant, unterhaltsam, und erfolgreich gestaltet.
Danksagung
Last but not least danke ich auch meinen Eltern die mich vom ersten bis zum 19.
Semester meiner Unilaufbahn immer aufs Beste unterstützt haben, und meinem
Bruder Jan, der immer Interesse am Fortgang der Doktorarbeit gezeigt hat.
Declaration
Declaration
Bettina Harr developed the ideas for the projects presented here. All laboratory work and data analysis was performed by me, with some exceptions:
Chapter 1
Birgit Schmitz worked on a part of the microsatellite PCRs.
Chapter 3
Leslie Turner helped with the PAML analysis of Dnahc8.
Zusammenfassung
Zusammenfassung
Ein integraler Bestanteil der Evolution, die Entstehung von Arten, ist nicht im gleichen Mass verstanden wie andere Bereiche der Evolutionsbiologie. Da Speziation ein fundamentaler Prozess ist durch den die grosse Artenvielfalt der Erde ensteht, wäre es sehr wünschenswert ein besseres Verständnis dieses Prozesses zu gewinnen.
Um dies zu erreichen müssen die molekularen Grundlagen des Speziationsprozesses im Detail erforscht werden.
Diese Arbeit verfolgt zwei Ansätze um zum Verständnis des Speziazionsprozesses beizutragen: Ein Screen nach positiv selektierten, jungen Duplikaten, und eine tiefergehenede Analyse des potentiellen Speziationsgens Dnahc8.
Junge Duplikate können, wenn sie in nur einer von zwei divergierenden Population unter positiver Selektion stehen, durch schnelle evolutionäre Entwicklung eine Inkompatiblität zwischen den beiden enstehenden Spezies erzeugen. Um Kandidatengene mit dieser Eigenschaft zu finden wurde eine Suche nach Mikrosatelliten durchgeführt die Spuren eines Selektionsereignisses aufweisen, einem sogenannten ‚selective sweep’. Dazu wurden Mikrosatelliten in der Nähe der Gene typisiert und auf reduzierte Variabilität untersucht. Mittels einer für diese Frage entwickelten Methode, der lnRH Statistik, wurden selective sweep Loci im Vergleich zwischen Spezies oder Populationen identifiziert. Das Ergebnis des Screens sind 13 Kandidatenloci im (Sub)species Vergleich, und 15 im Vergleich zwischen den Populationen. Ein Vergleich zwischen den ermittelten lnRH Werten und der synonymen Substitutionsrate (K
S) zeigt dass die jüngsten der duplizierten Gene nicht unter positiver Selektion zu stehen scheinen.
Um zu testen ob das tatsächliche Duplikationsalter mit dem Alter welches auf der Basis der synonymen Subtitutionsraten angenommen wird korreliert, wurde für einen Teil der Duplikatpaare überprüft ob sie in verschiedenen Mausspezies vorhanden sind. In den meisten Fällen nimmt der K
SWert mit dem tatsächlichen Alter der Duplikation zu, drei Genpaare haben jedoch sehr geringe K
SWerte die nicht zu ihrem Alter passen. Genkonversion könnte ein Grund für dieses Ergebnis sein.
Es ist bekannt dass das Dnahc8 Gen Mus spretus und Mus mus domesticus
reproduktiv voneinander isoliert. Es kodiert für ein axonemales Dyein Protein das am
Zusammenfassung
Aufbau des Spermienflagellums beteiligt ist; demenstprechend haben hybride Tiere deformierte, immobilisiert Spermien. Für diese Arbeit wurde die gesamte kodierende Sequenz von Dnahc8 in sechs Mausspezies sequenziert, um die schon bekannte Sequenz aus M. m. domesticus zu ergänzen. Ausserdem wurden mehrere Exons für ein Populationssample von M. spretus, und das gesamte Gen von zehn M. m.
domesticus Tieren sequeziert. Die Daten wurden mit verschiedenen Tests auf positive Selektion untersucht: Eine Art von Test basiert auf Polymorphismus Daten, die zweite auf der grössten Wahrscheinlichkeit für kodonbasierte Modelle die verschiedene Arten von Selekion erlauben. Es wurden Hinweise gefunden dass der Selektionsdruck auf Dnahc8 in der M. m. domesticus Linie relaxiert ist, es konnte jedoch mit keiner Methode positive Selektion nachgewiesen werden.
Neben den Sequenzdaten wurde auch die Expression mittels quantitativer Echzeit
PCR in acht Geweben von sieben Mausarten gemessen. Starke Unterschiede in der
Expression zwischen M. spretus und M. m. domesticus wurden gefunden, Dnahc8
wird in M. spretus achtfach niedriger exprimiert. Zusammengenommen weisen diese
Resultate darauf hin dass der Grund für die Inkompatibilität in Hybriden eher in der
Genregulation zu suchen ist als in der Aminosäuresequenz.
Abstract
Abstract
An integral part of evolution, the formation of species, is less well understood than other areas of evolutionary biology. Speciation is a fundamental process that creates the great diversity of species in the world, and a deeper insight into its mechanisms is highly desirable. To achieve this goal, the molecular basis of speciation must be elucidated and characterized in detail.
This study uses two approaches to contribute to the understanding of the genetics of speciation: A screen for positively selected, young duplicated genes, and in depth analysis of a proposed ‘speciation gene’, Dnahc8.
Young duplicated genes may be positively selected in only one of two diverging populations, and through rapid change create an incompatibility between the two emerging species. To find candidates of this type a microsatellite screen for selective sweeps is conducted, in which microsatellite loci close to the genes in question are typed and assayed for reduced variability. Using a measure developed for this problem, the lnRH statistic, subspecies or populations are compared, and selective sweep loci identified. The screen results in thirteen candidate sweep loci in (sub)species comparisons, and fifteen between populations of the same species.
Furthermore, comparisons of lnRH values to synonymous substitution rates (K
S) of genes show that the youngest duplicated genes of the set do not seem to be evolving under positive selection.
To test whether the duplication time correlates with the divergence time estimated from the synonymous substitutions rate, a subset of duplicate pairs was tested for presence in different mouse species. For most duplicates, K
Sbetween copies increases with age, but three pairs have very low K
Svalues that do not correspond to their age.
Gene conversion is discussed as a possible explanation for this result.
The Dnahc8 gene is already known to cause reproductive isolation between Mus spretus and Mus mus domesticus. It encodes an axonemal dynein protein that is involved in sperm tail formation, and hybrid animals have deformed, immotile sperm.
Here, the entire coding sequence of Dnahc8 is determined of six mouse species in
addition to the M. m. domesticus sequence already known. In addition, several exons
are sequenced in a population sample of M. spretus and the full-length gene
Abstract
polymorphism data and codon-based maximum likelihood methods are performed
with this data. There is evidence that Dnahc8 may be evolving under relaxed
constraint in the lineage of M. m. domesticus. However, no significant evidence for
positive selection could be found using any method. In addition to the sequence data,
quantitative real time PCR is used to measure the level of expression in eight tissues
of seven mouse species. Large differences in expression pattern are identified between
M. spretus and M. m. domesticus: Dnahc8 expression is eight fold lower in M. spretus
testis compared to M. m. domesticus. Together these results suggest that the nature of
the incompatibility caused by Dnahc8 may lie in gene regulation rather than
differences in the amino acid sequence.
Introduction
1 Introduction
Most of the areas of the study of evolution have been developed to a great extent and in detail since Darwin laid the foundations for this research (Darwin 1859). This is not as true for one process in evolution that was and is a major mechanism in shaping the plant and animal world as we see it now: speciation. The character of the forces that drive one more or less homogenous group of organisms to split into two or more distinct groups have long been disputed, as the details of speciation events are not clear. As it is a very slow process, it can usually only be scrutinized in retrospect, and the very nature of species is often that they do not hybridize, making the usual genetic approaches to study molecular processes very difficult.
There are also some theoretical problems: Even the term species can be defined in many different ways: based on phylogeny, morphology or reproductive status (Coyne, Orr et al. 1988). The most used and accepted of these definitions is the biological species concept, which describes species as “groups of actually or potentially interbreeding natural populations which are reproductively isolated from other such groups” (Mayr 1942). This focus on reproductive isolation as the most important and useful defining aspect of species has turned out to be true especially in the advent of population genetics.
Reproductive isolation can be caused by either prezygotic or postzygotic effects. The former includes behavioral (e.g. mate recognition), mechanical (e.g. incompatible mating organs), and gametic (e.g. incompatibilities between egg and sperm) factors.
Postzygotic isolation includes hybrid inviability and hybrid sterility. While postzygotic isolation in plants is often caused by polyploidy (Masterson 1994), in animals genic effects seem to play an more important role (Coyne and Orr 1998).
Thus far, research on the genetics of speciation has focused on postzygotic isolation.
While many advances have been made, there are still major questions that are debated
when it comes to speciation. Many of these questions concern the importance of
alternative mechanisms that probably both play a role, but to what extent is not
known. For one, there is a lot of ongoing discussion whether mutations in cis or
regulatory changes in trans contribute to evolution and speciation (Hoekstra and
Coyne 2007).
Introduction
There are quite a few studied examples of gene duplications that are involved in speciation, especially the ‘speciation genes’, but it is still not know how important the contribution of duplicated genes to speciation is. It seems reasonable to expect that duplication processes are often involved, as hybrid incompatibility genes often evolve rapidly, and redundant genes provide this freedom by lack of selective pressure.
In this chapter I will summarize the current understanding of the genetics of speciation and examples of genes known to play a role in speciation and reproductive isolation, and the evolutionary relevance of gene duplication and the theories that have been developed. I will also review the methods of selection detection that are relevant to this work, and give an introduction to the house mouse as a model system.
1.1 The genetics of speciation
The conceptual difficulties with understanding how reproductive isolation could evolve through changes at a single locus were resolved with the independent realization by Bateson, Dobzhansky and Muller that two populations can become reproductively separated when two interacting genes are involved (Bateson and Mendel 1909; Dobzhansky 1937; Muller 1942); if novel alleles of both genes are fixed in the two populations the genes may not be able to interact normally when combined in hybrid offspring. This two locus model, termed the Dobzhansky Muller model, marked the start of the research of the genetic causes of speciation.
The key to unraveling the many questions concerning speciation lies in understanding the molecular details involved in reproductive isolation. While it takes too long to observe the speciation process directly, it is possible to identify the genetic processes that maintain species boundaries. These hybrid incompatibility genes are commonly termed speciation genes (Orr and Presgraves 2000), although it is not clear if they contributed to the initial evolution of reproductive isolation. Thus far, four hybrid incompatibility genes have been identified (Orr, Masly et al. 2004).
The first gene in this category that was identified confers hybrid sterility. Called
Odysseus site homeobox (OdsH), it encodes a transcription factor with a homeobox
domain which is expressed in testis tissue. Its effect was found in hybrids between the
fruit fly species Drosophila simulans and Drosophila mauritiana, the hybrid males
from this cross are sterile (Coyne and Charlesworth 1986; Ting, Tsaur et al. 1998). In
Introduction
the sterile F1 males, OdsH seems to confer only to about 50% of the infertility phenotype, thus other factors must also be involved (Perez and Wu 1995; Ting, Tsaur et al. 1998). The effect also is only evident in young males, and diminishes as they get older, suggesting that OdsH may be involved in accelerating the maturation of sperm (Sun 2003). OdsH has been found to evolve rapidly under positive selection in one of the species, D. mauritiana, as has often been reported for testis specific genes (see (Ellegren and Parsch 2007) for review).The OdsH gene originated from a gene duplication of the ancestral gene Unc-4 (Sun, Ting et al. 2004), which is expressed in the embryonic stages and in neuronal tissue. After the duplication event, the expression of OdsH became confined to the testis. Thus, change in this hybrid sterility gene involved a duplication in addition to rapid evolution at the amino acid sequence level.
While OdsH belongs to the class of the hybrid sterility genes, other genes have been found that cause inviability in hybrids. The first one analyzed in detail shows its effects in hybrid fish; progeny of a cross between Xiphophorus maculatus and X.
helleri often develop fatal melanomas. The molecular cause of this phenotype has been traced to over expression of a receptor tyrosine kinase encoded on the X chromosome, Xmrk-2 (Wittbrodt, Adam et al. 1989; Schartl, Dimitrijevic et al. 1994).
Overexpression of Xmrk-2 is the result of a Dobzhansky Muller incompatibility with another locus that represses its expression. Xmrk-2 is a partial copy of its paralog Xmrk-1, and additionally acquired mutations following duplication render the protein constitutively active (Gomez, Wellbrock et al. 2001). While the protein coding part comes from Xmrk-1, the regulatory sequence that controls its expression originates from a second gene. This promoter interacts with a repressor, thus Xmrk-2 has acquired a novel regulatory mechanism. The detrimental phenotype occurs in hybrids which do not have a functional allele of the repressor.
Another hybrid inviability gene, hybrid male rescue (Hmr), has been found in crosses between Drosophila species. Hmr is a transcription factor located on the X chromosome. The hybrid lethality effect of Hmr is confined to male hybrids, which do not live beyond the transition from larval to pupal stage: females have reduced fertility and also become sensitive to high temperatures (Barbash, Roote et al. 2000).
It has been shown that the dosage of Hmr is correlated with the strength of the
inviability phenotype (Barbash, Roote et al. 2000; Orr and Irving 2000; Barbash,
Introduction
sister species D. sechellia, D. simulans, or D. mauritiana, and there is evidence that Hmr has diverged at the sequence level between D. melanogasterand the latter three species. The large extent of divergence has been attributed to positive selection (Barbash, Awadalla et al. 2004).
The fourth hybrid inviability gene discovered nucleoporin 96 (Nup96), could also be shown to have a period of evolution under positive selection in its history (Presgraves and Stephan 2007). The incompatibility involving Nup96 is again between D.
melanogaster and D. simulans (Presgraves, Balagopalan et al. 2003). The protein is present in all eukaryotes from yeast to humans, and forms a part of the nuclear pore complex located in the nuclear membrane, which regulates the passage of macromolecules through the membrane.
Although very limited, this set of four speciation genes allows drawing some preliminary conclusions about the genetic process of speciation. One of the unsolved questions concerning speciation is whether incompatibilities evolve neutrally or under selection. For all genes mentioned before positive selection could be shown, either recent or in the gene’s history. Additionally, all genes evolve very fast, and Hmr and Nup96 show evidence of adaptive protein evolution. It is not known in what way these adaptive processes relate to the species’ environmental conditions. Further, it has been postulated that functional constraint has to be relaxed in order to have such a rapid rate of sequence divergence (Wu and Ting 2004). One way this could be happen is through gene duplication. Indeed, duplication events during the evolution of OdsH and Xmrk-2 have contributed to the changes that cause them to act as ‘speciation genes’.
Finally, despite the fact that all the genes show sequence divergence that may explain the incompatibilities, three of four genes are also directly involved in gene expression, with two being transcription factors. In the case of Xmrk-2 the change in expression seems to be the main contributor towards the hybrid lethality phenotype, while OdsH may cause hybrid infertility through regulating other genes (Michalak and Noor 2004).
This recent progress in identifying genetic causes of reproductive isolation is the first evidence for speciation mechanisms at the molecular level. Nonetheless these data are still rather limited, and more examples have to be analyzed in detail to draw conclusions. For one, more taxa should be investigated, as three of the four
‘speciation genes’ summarized above are found in Drosophila. This ongoing research
Introduction
is required to confirm and expand on the preliminary conclusions that are discussed today.
1.2 Gene duplication
Gene duplication is the major mechanism that enables the increase in complexity of organisms. The importance of duplication events was first mentioned in the 1930s (Haldane 1933; Muller 1935), but general acceptance of the role of duplication in evolution came through the ideas of Ohno (Ohno 1970). In his book he laid the theoretical groundwork, and postulated that novel genes can arise through copies of those already in existence. Extensive research on the mechanisms and effects of gene duplication events since that time has provided a more comprehensive understanding of this important type of evolutionary change.
To be an important contributor to genome evolution, duplication events have to occur with some frequency. And indeed, Lynch and Conery’s analysis of several genome sequences comes to the conclusion that genes are copied at a rate of about 0.01 duplications per gene per million years (Lynch and Conery 2000), or 0.009 specifically for humans (Lynch and Conery 2003).
This overall rate reflects three very different mechanisms by which genetic material is multiplied and moved around the genome contribute to that rate. Unequal crossing over during recombination leads to fragments duplicated in tandem, and the affected stretch of DNA may include one or more genes, or parts thereof. Segmental duplications are much larger, encompassing 1 kb to more than 200 kb, and do not always occur within just one chromosome (Samonte and Eichler 2002). The third and most dramatic mechanism is whole genome duplication; evidence for genome duplications is reported in a variety of taxa, among them yeast (Wolfe and Shields 1997; Kellis, Birren et al. 2004; Scannell, Byrne et al. 2006), fish (Christoffels, Koh et al. 2004; Jaillon, Aury et al. 2004) and other vertebrates (Dehal and Boore 2005).
The availability of whole genome sequences makes the large contribution of the
duplication mechanisms to genome structure and organization hard to deny; for
example it is estimated that over 60% of human genes came into existence through
some kind of a duplication event (Li, Gu et al. 2001), and now form gene families or
pairs. Segmental duplications larger than 1 kb and with high similarity (>90%) alone
Introduction
duplication can be expected to have an even stronger effect on the genome, and indeed in yeast about 16% of the protein coding genes have a paralog (Seoighe and Wolfe 1999). But where do the duplicates of all the other genes go?
This question leads to the fairly complex theories of the fate of duplicate genes after the fact. As with mutations, the mechanisms that create duplicate genes act more or less randomly, and evolutionary forces only influence the events thereafter. They have accumulated so many mutations over time that they can no longer be distinguished from other noncoding sequence. This pattern of “nonfunctionalization” is the most common outcome because mutations that are detrimental to gene function and fitness are much more common than those with a positive effect (Lynch and Walsh 1998;
Lynch and Conery 2000; Harrison, Hegyi et al. 2002).
There are three other possible fates for duplicate genes: (1) Conservation - the duplicate copy is retained, (2) Subfunctionalization – the gene copy is optimized to perform one of multiple functions of the original, and (3) neofunctionalization – the new copy acquires a completely new function. Different models proposed to explain the evolution of gene duplicates vary in terms of the frequency and importance of these three outcomes.
The conservation of two or more identical open reading frames in one genome, without any one of them acquiring deleterious mutations, can only be explained by an advantage of producing a high amount of the protein encoded (Nowak, Boerlijst et al.
1997). Examples of this include rRNA and histone genes.
Subfunctionalization entails changes to the gene in the domain of protein function or expression. The latter may be a temporal or spatial difference in expression as compared to the original gene. For this subfunctionalization to occur the original gene does not have to change in the same timeframe as the copy.
In contrast, in the duplication-degeneration-complementation (DCC) model (Force, Lynch et al. 1999), deleterious mutations in one gene copy result in selective pressure to maintain the duplicate. If these mutations occur in both genes simultaneously, but affect different subfunctions or promoters responsible for expression in different tissues, the genes are stabilized, as both become necessary for the organism. The model also applies both to cases of subfunctionalization and neofunctionalization.
The third major model of gene duplication is the innovation, amplification and
divergence model (Bergthorsson, Andersson et al. 2007). In this model, duplicated
Introduction
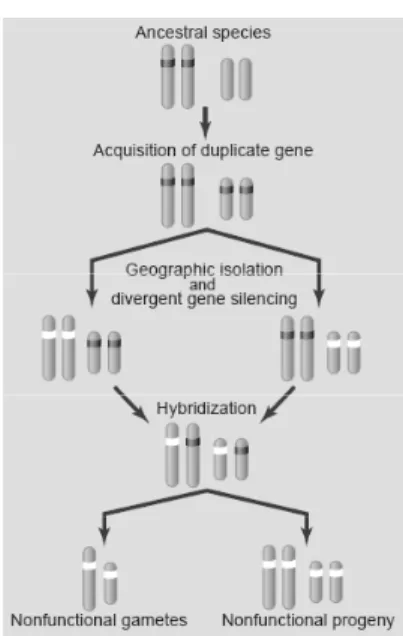
Figure 1: Divergent silencing of duplicate genes contributes to reproductive isolation (Lynch 2002).
genes acquire a new function in addition to their main purpose. If this new function is beneficial an increased amount of gene product will be favorable, providing a possibility for stabilization of the duplication similar to the case of gene conservation. The redundant copy is positively selected, and may spread through the population. Under this selection pressure it can then gain mutations that make the subfunction more efficient, and turning it from the minor side effect that it represented in the mother gene into the major function of the copy. This recent model does not suffer some problems identified with earlier models, such as the fact that neofunctionalization is unlikely to occur under the DCC model. Also, the rate of duplication retention via the ‘mutation during nonfunctionality’ model is very low, because of loss due to drift and null mutations.
Neofunctionalization has with good reason been thought to be much less likely than other forms of duplicate evolution (Lynch, O'Hely et al. 2001). Although less likely, there are several known examples of duplicate genes that have acquired a novel function. One example is the evolution of a RNAse A gene duplicate in the lineage of humans and old world monkeys which acquired an anti bacterial function that does not seem to require the ribonuclease activity (Rosenberg 1995; Zhang, Rosenberg et al. 1998). The authors of a recent study in Drosophila found a tandemly duplicated pair of transcription factors of the Polycomb group of proteins. There is evidence that strong positive selection drives neofunctionalization in one of the copies, despite the fact that they still share strong similarity (Beisswanger and Stephan 2008).
Gene duplication enables fast evolutionary changes. For example, it was recently suggested that the puzzling result of an earlier experiment, which suggests that mutation happens faster at loci under selection (Cairns, Overbaugh et al. 1988), can be better explained through gene duplication events (Hendrickson, Slechta et al. 2002).
The ability to adapt rapidly may be beneficial, such as when species encounter rapidly
changing environmental conditions or invade a new habitat.In addition to facilitating
Introduction
speciation (Lynch and Conery 2000). One model put forth by Lynch is displayed in Figure 1 (Lynch 2002). Given the high rate of duplicate birth and death mentioned earlier, it is quite likely that a species splits into two new species after a gene has, by chance, just been copied on another chromosome. With the nonfunctionalization rate being as high as it is, the two new species may each loose the other duplicate and retain one functional copy; with a probability of 0.5. This results is a form of postzygotic isolation, as one quarter of all gametes of hybrid offspring will lack the gene function completely. As this happens with more than one gene, and genes that are of vital importance, it may lead to complete reproductive isolation, and thus separate species. In fact, a hybrid incompatibility caused by the translocation of a gene to a different chromosome has recently been identified in Drosophila (Masly, Jones et al. 2006). The gene duplication must not necessarily take place before isolation, geographic or otherwise, duplication can also happen and be resolved in both populations independently. This is a very fast mechanism by which populations can become reproductively isolated on a genetic level, and it is theoretically independent of outside factors such as selection pressure.
1.3 Selection
Since the introduction of the neutral model (Kimura 1983), a major focus of evolutionary studies has been the attempt to track down evidence for positive selection in the genome. This line of research is important, because positive selection is the driving force of Darwinian evolution, but succeeding in it has proven difficult, since selection has to be distinguished from neutral processes including genetic drift and demographic effects. Two major approaches are used to detect positive selection from sequence data.
The first set of methods for detecting selection relies on comparison between
nonsynonymous mutations, which change the amino acid sequence of a protein and
synonymous, or silent, mutations. Synonymous sites in coding sequences are assumed
to evolve neutrally, and this ‘baseline’ rate of synonymous changes per synonymous
site (K
S) is compared to the nonsynonymous rate (K
A). The ratio of those two values
(K
A/K
S) is used to infer the type of evolutionary pressure the sequence is be under: A
ratio of one implies the sequence evolves neutrally, a ratio greater than one indicates
there is positive selection, and values below one signify negative or purifying
Introduction
selection. As so often though the practice is much more complicated than the theory.
Several different methods exist to calculate the values, incorporating various fine tuning techniques (Li, Wu et al. 1985; Nei and Gojobori 1986; Pamilo and Bianchi 1993). The interpretation of K
A/K
Sratios is not straightforward, and has been shown not to work in all scenarios (Crandall, Kelsey et al. 1999). In addition, the use of K
A/K
Sestimates for entire genes to infer selection is very conservative, as selection generally targets only a subset of amino acid sites in a gene.
The most widely implemented method used to detect selection is the maximum likelihood approach implemented in the PAML package (Yang 2007). This approach involves comparison of various models that allow K
A/K
Sratios to vary among codon sites in the gene and/or among branches of a phylogenetic tree.
While the K
A/K
Sratio methods may not be easy to implement, they have the great advantage that only one representative sequence of each species in the comparison is needed. The detection of positive selection based on sequence data and synonymous and nonsynonymous changes can also be achieved by contrasting those changes within and between species (McDonald and Kreitman 1991). The McDonald- Kreitman test yields a simple table that can be assessed for significance using a Chi- square test.
The second major approach for detecting selection involves looking at the neutral
variation around a gene or locus of interest. While noncoding areas of the genome are
assumed to evolve neutrally, unless they are part of a promoter or enhancer, they may
still be affected by positive selection events, in a manner dependent on the genomic
distance to the selected locus. After a positive mutation occurs, the affected allele
rises in frequency in the population, at a speed that depends on the selection
coefficient. The variable of neutral sites near to the selected locus also become more
common among individuals, an effect that has been termed ‘hitchhiking’ (Smith and
Haigh 1974 ). If one can find sequence that is not under selection directly, but shows
such a decreased variability in comparison to other sequences, it can be inferred that a
linked site may have been under selection (Slatkin 1995). The length of this fraction
of the genome with reduced variability depends on the selection coefficient and the
recombination rate, the former being positively associated with the length, the latter
negatively. Markers commonly used to detect sequence variability include single
Introduction
uniformly distributed in the genome, and their mutation rate is constant (although it may differ between regions of the genome (Wolfe, Sharp et al. 1989)).
Microsatellites have several advantages over SNPs in hitchhiking studies. The mutation rate, which is different for all individual microsatellites, is not one of them. However, it can be roughly predicted by the length of the repeat,
and the microsatellites can be searched for in published genome sequences, without any population sequence data. Also, microsatellites mutate in discrete steps, according to the length of the repeated pattern (Ellegren 2004). This property makes analysis very straightforward, as only the length of a PCR fragment needs to be measured as opposed to sequencing, making it easier to study large amounts of individual animals and loci. However, as the microsatellite mutation rate depends on the type of repeat unit and total microsatellite length, different loci are not comparable. To circumvent this problem the same microsatellite locus is compared among different populations or species, thus independence from the mutation rate is gained (Schlötterer 2002).
When analyzing the data of a given microsatellite locus in multiple individuals, two key values can be calculated: The variance in repeat number (V) as a measure for the variability of the locus (Goldstein and Clark 1995), and the expected heterozygosity (Nei 1978). If has been shown that, with data from two populations, the logarithm of the ratio between the two values for either V or H (lnRV and lnRH) follows a normal distribution, if the microsatellites evolve neutrally (Schlötterer 2002; Kauer, Dieringer et al. 2003). This makes it possible to detect loci within a dataset that depart from the expected null hypothesis, neutrality, with a defined probability. These extreme loci are likely linked to sites under selection. Using the heterozygosity seems to have a higher power due to the smaller variance for this parameter (Kauer, Dieringer et al.
2003).
In this study, methods based on both of the major approaches to detecting selection are utilized: a microsatellite survey is used in a large screen for duplicated genes under selection, and K
A/K
Smeasurements are used to evaluate the evolutionary dynamics of a candidate gene, Dnahc8, in greater detail.
Figure 2: Schematic diagram depicting the neutral variability at a 'sweep' locus
Introduction
1.4 Mouse model
The house mouse is an excellent model organism for the study of evolution in general, and speciation in particular, for several reasons.
First, it is one of the most widespread mammals, occurring nearly everywhere on the planet. Mus musculus has achieved this almost ubiquitous distribution through human activity; it is a commensal rodent, living in areas inhabited by humans. The colonization history of the mouse reflects this fact; it is thought to have originated in northern India (Guenet and Bonhomme 2003), and traveled from there following agriculturally active human settlement (Cucchi, Vigne et al. 2005). The phylogeny is well established, made possible through the good fossil record and extensive morphological data (Boursot, Auffray et al. 1993; Lundrigan, Jansa et al. 2002;
Guenet and Bonhomme 2003). The so called Mus musculus subspecies group includes 5 members (Figure 3).
M. m. castaneus colonized the Asian continent eastward and is now found in Southeast Asia. M. m. domesticus and M. m. musculus both inhabit Europe, where their ranges meet, forming a north-south hybrid zone. These two subspecies arrived in Europe by different routes, M. m. musculus expanded north of India to Kazakhstan and colonized eastern Europe, while M. m. domesticus moved westward through Iran to the western Europe and northern Africa (Boursot, Auffray et al. 1993). The Mus musculus subspecies group is of special interest to speciation studies, because its members are very closely related, and their invasion of the world is understood in
Figure 3: Phylogenetic tree for the subgenus Mus adapted from (Guenet and Bonhomme 2003).
Introduction
levels of comparison in the first part of this study: between the different subspecies, and between ancestral and derived populations within a subspecies.
In addition to the M. musculus group, other mouse species provide part of the data used in this study. The closest relative to the house mouse is M. spretus, which occurs in sympatry with it in Spain and northern Africa. M. macedonicus’ range covers the Balkans to the Near East, while M. macedonicus is found in the area from eastern Austria into the Ukraine. The Indian subcontinent is the range of M. famulus, M.
caroli as well as M. cookii are found in East Asia.
Second, several practical aspects make the house mouse a convenient model system:
They have a short generation time and are easy to keep under laboratory conditions.
Wild individuals are not hard to catch in their habitat. For genetic studies the availability of the whole genome sequence is greatly advantageous, facilitating the use of a wide array of bioinformatics tools. The sequenced laboratory mouse strain is a genetic mixture between the three subspecies M. m. domesticus, M. m.musculus and M. m. castaneus, with the first providing the largest fraction of the genome (Wade, Kulbokas et al. 2002; Wade and Daly 2005).
Finally, several loci have been found that confer hybrid incompatibility between house mouse (sub) species. These incompatibilities follow Haldane’s rule, that is, sterility is observed in males (the heterogametic sex). Hybrid sterility loci (Hst) have been identified in crosses between M. m. musculus and M. m. domesticus (including wild and laboratory strains), and between M. m. domesticus and M. spretus.
Hybrid sterility 1 (Hst1) is responsible for an incompatibility between M. m. musculus and M. m. domesticus (in the form of the lab strain C57BL/6) and has been mapped to a region containing only two genes, which is located in the proximal region of chromosome 17, in the area defined by the t-haplotype inversions, which have been implicated in hybrid male sterility among other effects (see detailed explanation below) (Forejt, Vincek et al. 1991; Trachtulec, Mihola et al. 2005; Vyskocilova, Trachtulec et al. 2005). The candidate genes are the TATA-binding protein (Tbp) and proteasome subunit beta 1 (Psmb1), although no coding differences have been found in alleles of the strains involved (Trachtulec, Mihola et al. 2005). Hst1 is variable in both mouse species in nature, and only some allele combinations lead to male sterility (Forejt 1996; Vyskocilova, Trachtulec et al. 2005).
Another hybrid sterility locus, named Hstx1, was also found in crosses of the mainly
M. m. domesticus lab strain C57BL/6 and the M. m. musculus derived strain PWD/Ph.
Introduction
As the name hints, the locus resides on the X chromosome. Introgressing the M. m.
musculus allele into a M. m. domesticus background leads to abnormal sperm, lower sperm count, and lower testis weight in the male F1 animals. A QTL analysis showed that the Hstx1 factor alone is not responsible, one or more linked loci of M. m.
musculus origin must also be present (Storchova, Gregorova et al. 2004).
The other pair that has been studied for hybrid incompatibility effects, M. m.
domesticus and M. spretus, is further along in the speciation process; individuals rarely hybridize in nature despite their overlap in range. All male F1 mice from this cross are sterile, but females are of normal fertility (Bonhomme, Martin et al. 1978).
One locus implicated in this incompatibility lies close to the pseudoautosomal region of the X Chromosome and has been named Hst3 (Guenet, Nagamine et al. 1990).
Closer analysis of this locus points to a possible chromosomal effect rather than a genic one, namely structural incompatibility of the X and Y chromosomes at their respective pseudoautosomal regions (Matsuda, Hirobe et al. 1991).
A group of three tightly linked loci, Hst4, 5 and 6 have been found in the t-haplotype region of chromosome 17. These loci were found in a study that backcrossed M.
spretus chromosome 17 into a M. m. domesticus background originally to survey the possible origin of the t-haplotype allele (Pilder, Hammer et al. 1991). One of these, Hst6, has been scrutinized in detail.
The t-haplotype is a structural variant of chomosome 17 that features four large, non- overlapping inversions which prevent recombination with the wild type alleles (Silver and Artzt 1981; Hammer, Schimenti et al. 1989). The t-haplotype does not follow mendelian inheritance, instead it shows transmission ratio distortion, where 90% of all male offspring inherit the t allele of Chromosome 17 from heterozygous +/t fathers (Hammer and Silver 1993). Nonetheless the frequency of the t allele in wild mouse populations is only about 20% (Ardlie and Silver 1996), the spread of the t-haplotype is kept at bay because homozygous males are sterile. While transmission ratio distortion and sterility are complex at the molecular level and still not fully understood, the t/t phenotype of deformed sperm seems to be the major contributor to male sterility. In particular, the motility of the sperm is affected by a flagellar waveform defect, a condition that was named “curlicue” (Olds-Clarke and Johnson 1993).
Although three of the four t-haplotype inversions are not inverted in respect to the M.
Introduction
chromosome 17 from M. spretus are also sterile. This observation enabled a fine mapping strategy to be devised to uncover the sterility factor (Pilder, Hammer et al.
1991; Samant, Fossella et al. 1999). This research revealed that t-haplotype M. m.
domesticus both homozygous and heterozygous for the M. spretus allele of Hst6 are sterile. In both cases sperm motility was hindered by nonfunctional or even absent flagella, caused by defect assembly of flagellar structures in early stages of spermiogenesis (Phillips, Pilder et al. 1993; Pilder, Olds-Clarke et al. 1993). Further mapping narrowed the identity of Hst6 down to one candidate gene, Dnahc8 (Fossella, Samant et al. 2000). Dnahc8 encodes a dynein heavy chain protein of 3480 amino acids in length, encoded in 79 exons. Dnahc8 belongs to a large gene family present in a wide range of organisms. Its expression is testis specific in M. m.
domesticus, but not in M. spretus, according to Samant et. al. (2002). Expression as well as translation take place before the process of spermatogenesis, fitting the hypothesis that it plays a part in formation of the sperm tail (Samant, Ogunkua et al.
2002).
The fact that the M. spretus allele of Dnahc8 is not functional in a M. m. domesticus
background makes it a very good candidate for a “speciation gene”. In this study,
population genetic data from M. m. domesticus are used to investigate the
evolutionary dynamics of this candidate gene in detail.
Introduction
1.5 Aims of this study
The first part of this study aims to provide data on duplicated genes under selection in the mouse model system. Microsatellite loci in the vicinity of duplicates are amplified and the length allele identified in a large sample of different mouse subspecies and populations to find loci that show a signature of a selective sweep. Genes that show such a sweep signature in one subspecies or population are interesting because they may contribute to the speciation process by causing hybrid incompatibilities.
The microsatellite screen makes some assumptions about duplicate gene pairs that will be tested in the second part. The presence of a duplicate can be tested through a PCR scheme, which is done for several mouse species. The data gathered in this process will make it possible to determine the age of a duplication event, and compare it to the age estimated by the K
Svalue. Also, this test will show if the genes tested are present in all mouse species.
While the first party of this study is a search for candidate genes, the third part focuses on one gene, Dnahc8. It has been shown to be a hybrid sterility gene in M. m.
domesticus and M. spretus hybrids, but it is not known what the mechanism of this
incompatibility is. To answer the question if the effect is caused by changes in the
coding sequence or regulatory effects, sequence data and expression levels will be
analyzed in several species.
A screen of duplicated genes for positive selection
2 A screen of duplicated genes for positive selection
2.1 Introduction
Duplicated genes have been implicated to play an important role in speciation, as they allow genes to gain new functions or regulative changes very quickly through lifting constraint. Such duplicates may develop this altered function only in one population of a species, giving rise to possible hybrid incompatibility.
This study tries to detect duplicated genes that have undergone a selective sweep in subspecies or populations of the house mouse by analyzing the variability of microsatellite loci.
2.2 Materials and Methods
2.2.1 Search for duplicated genes and associated microsatellite loci Duplicated genes were searched in the available genome sequence for Mus muculus as provided by the EnsEMBL project (http://ensembl.org). The database release 31 was used for the search as described here. All genes are sorted into gene families in the EnsEMBL database, a feature that is computed by generating similarity data among all proteins through blastp, and then clustering the sequences with the help of the TRIBE-MCL algorithm (Enright, Van Dongen et al. 2002). A list of all genes with their family ID was downloaded via the EnsMart service, and filtered for those families that contained only two single genes. The number of gene pairs in the resulting list was 1628 (see digital supplement). A large number of duplicated genes would not be found with this method, as they are grouped in larger families. On the other hand, this study focuses on young duplicates, which are represented in the set of genes found, and for the purposes needed here a complete list of all recently duplicated genes is not needed.
The next step in the analysis was the determination of the age of the duplication
through the K
Svalue. For all genes the protein and nucleotide sequences were
downloaded from EnsEMBL. The protein sequences of duplicate pairs were aligned
with the muscle software (Edgar 2004), and the nucleotide data was aligned
A screen of duplicated genes for positive selection
subsequently on the basis of the protein sequence alignment by means of the tranalign program, part of the EMBOSS package (Rice, Longden et al. 2000). This ensures the resulting nucleotide alignment does not contain codon shifts in any one sequence, which would render the calculation of synonymous and nonsynonymous replacements impossible. This calculation was performed with a software program that implements the method of W. H. Li (1993) to calculate K
Sand K
A.
To obtain a subset of gene duplicate pairs that can be presumed to have originated during or after the split that gave rise to the house mouse subspecies group, a cutoff value of K
S< 0.1 was chosen. The calculation assumes a mutation rate of 2.1 x 10
-8per base pair per generation (Nachman 1997), a generation time of 2 per year, and that the split occurred 0.5 – 1 million years ago (Guenet and Bonhomme 2003).
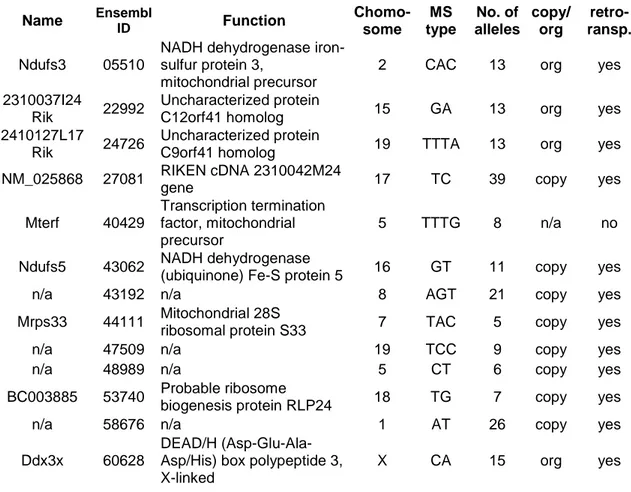
For a subset of the genes, the duplication mechanism that led to their existence was determined. Retrotransposed genes have lost all introns in one of the copies, this was tested manually by visible inspection. Whether gene duplication was caused by a large scale segmental duplication was assessed by searching for the genes in question in the non human segmental duplication database as available on the internet (Cheung, Wilson et al. 2003).
2.2.2 Microsatellite analysis 2.2.2.1 Mouse population samples
DNA from four mouse (sub)species, Mus. m. musculus, M. m. domesticus, M. m castaneus and M. spretus was used. For M. m. musculus genetic material from a Czech (35 individuals) and a Kazakh (36) population was available, the latter deemed the more ancestral one. The M. m. domesticus mice studied were caught in West Germany (37), the French Massiv Central (63) and Chicago in the USA (16). The M.
m. castaneus subspecies was also represented in one ancestral population from India (46), and one presumably derived population from Taiwan (12). All Mus spretus mice originate from central Spain (46).
The animals were caught according to a sampling scheme detailed by Ihle et. al.
(2006), to minimize the number of inbred individuals in the sample.
A screen of duplicated genes for positive selection
2.2.2.2 Microsatellite selection and primer design
To be able to draw conclusions from microsatellite allele patterns as to the evolution of genes, the repeat loci must be located in the vicinity of the gene, at a distance that is dependent on the selection coefficient and the local recombination rate, which, over time, breaks down the selective sweep pattern (Smith and Haigh 1974; Fay and Wu 2000). Per default, a window of 10 kilobases around the gene was searched for suitable microsatellite loci. These loci were chosen on the basis of the repeat pattern, bi-, tri- and tetranucleotide repeat units in the range of 9 to 25 repeats. Other criteria were the uniformity of the pattern, and the possible PCR product of the locus: Loci whose repeat pattern contains irregularities mutate much slower that the total length would suggest, and there may be other repeats close by that make generation of a PCR product with just the desired locus impossible. Detection, filtering and generation of a primer pair for PCR was automated via a perl script, the software used for finding the microsatellites in sequence data was Tandem Repeat Finder (Benson 1999). The primer design was facilitated by the primer3 software (Rozen and Skaletsky 2000), with settings that aim at primers with a melting temperature of 60°C and a optimum length of 20 basepairs.
The list of microsatellites and PCR primers that enclose them was checked by hand for suitable combinations. Six of these were grouped into a multiplex, two loci that differed in PCR product size by a few hundred basepairs were assigned the same of the three available fluorescent dyes. All primer sequences are available in supplement 1.
2.2.2.3 Microsatellite PCR and analysis
All PCRs were done in a total volume of 10 μl, with ca. 20 ng genomic DNA as a
template. The chemistry used was either EuroBio DNA Polymerase and the
corresponding buffers, or the Qiagen Multiplex PCR kit (Hilden, Germany) as
suggested in the instructions. The primer oligonucleotides were obtained from
Metabion (Martinsried, Germany), and in a few cases from Sigma (Munich,
Germany). The primers were labeled with the fluorescent dyes HEX, FAM and TET,
enabling the analysis on an MegaBACE automated capillary sequencer (Amersham,
A screen of duplicated genes for positive selection
USA) for size determination. To this end the PCR reaction was diluted 1:20 and one μl was mixed with 15 μl water containing ET550 ROX size standard.
2.2.2.4 Analysis of the microsatellite data
Raw sequencer data was manually allele typed in the Genetic Profiler program (Amersham, USA).
The program MS analyzer (Dieringer and Schlötterer 2003) was run on the raw data of the microsatellite allele sizes. It calculates various parameters, among them the heterozygosity and the variance in repeat number of each locus and population. The Hardy-Weinberg exact test was performed using the Genepop software (Rousset 2008).
An allele sharing tree was calculated with the program ‘neighbor’ available in the Phylip package (Felsenstein 1989) on the basis of distance data calculated by MS analyzer and visualized with the ‘tree explorer’ program, part of MEGA (Tamura, Dudley et al. 2007).
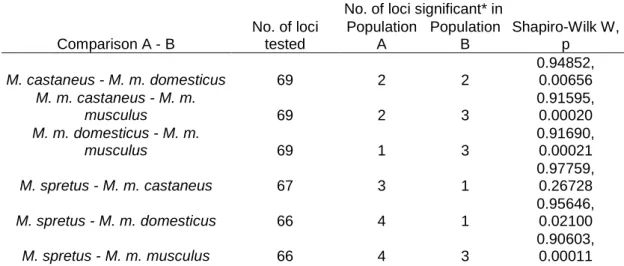
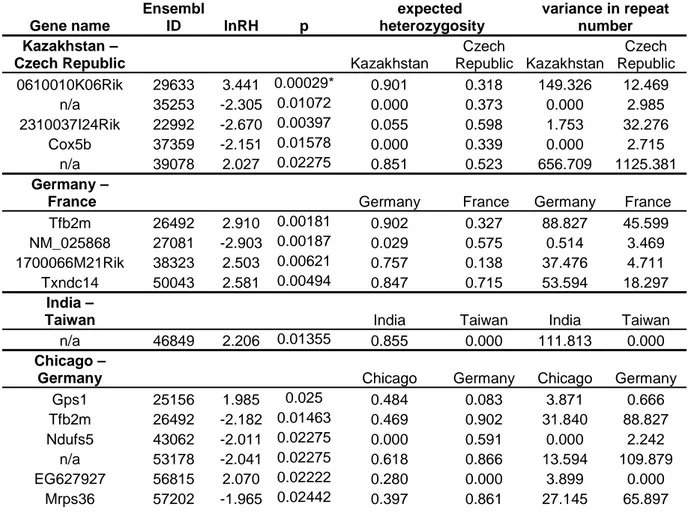
To find selective sweep candidate loci, the lnRH values were calculated as a measure of relative variability levels, after Kauer et. al. (2003). The lnRH statistic when calculated for a range of neutrally evolving microsatellite loci follows a normal distribution. Thus, the values for all loci within a given comparison were Z- transformed and tested whether they conformed to a normal distribution by the Shapiro Wilks test, performed in the Statistica software package (StatSoft, USA). The 95% confidence interval for this data set ranges from -1.96 to 1.96, and values outside of this interval are significant at the 0.05 level.
All raw data and input files used for MS analyzer are available in the digital
supplement.
A screen of duplicated genes for positive selection
2.3 Results
2.3.1 Properties of duplicated gene dataset
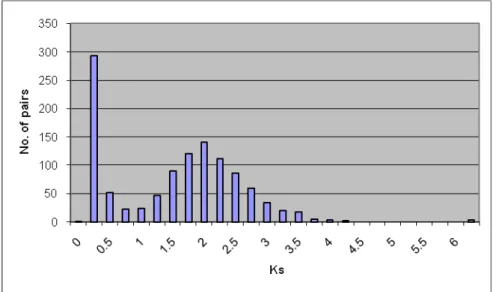
Using the procedure detailed earlier, 1628 two-member gene families, or duplicate gene pairs, were found. The ratio of synonymous changes per synonymous site (KS) was calculated for all pairs, the distribution is shown in Figure 4.
Figure 4: KS distribution of 1131 gene pairs
The majority of the duplications are young, with a K
Svalue of between 0 and 0.5.
Another peak of duplication lies around a K
Sof 2. A linear accumulation of silent substitutions makes it possible to calculate the age of the duplication event (Lynch and Conery 2000). Assuming an average mutation rate of 4*10
-9per base pair per year in the mouse (Waterston, Lindblad-Toh et al. 2002), this translates to an age of these events of 250 Myr (2 / 4*10
-9/ 2). (A similar rate, 3.06*10
-9, has been found by Nachman et al. (Nachman 1997)). The same pattern, with many very young duplications and a peak of duplication at a more ancient time, was found in other studies using human gene families (Gu, Wang et al. 2002; Cotton and Page 2005).
The time estimates of the wave of duplications are much higher than found here, 550
and 500 Myr for both studies, respectively. However, the method used to infer age in
these studies is fundamentally different from the one used above. In both cases
neighbor-joining trees of gene families with sequence data in various vertebrate
species are used to map duplication events to the vertebrate phylogeny. Using
A screen of duplicated genes for positive selection
speciation events, whose age is known from the fossil record, as calibration points the age of duplications is determined from the phylogenetic interval it falls into.
I found similar distribution patterns for the K
Sof duplicated genes in various mammal species, Xenopus, and chicken (data not shown).
The origin of the subspecies is estimated to have occurred less than one million years ago, that of M. spretus less than two million years (Guenet and Bonhomme 2003).
The so far unexplained phenomenon of the overrepresentation of genes in the age class around 250 Myr (K
Sof 2) does thus not affect the young duplicate pairs analyzed here.
In order to restrict the analysis to young duplicates, only those with a K
Sof 0.1 (10 Myr) or less were selected; this restriction reduces the dataset to 157 gene pairs, excluding genes with a K
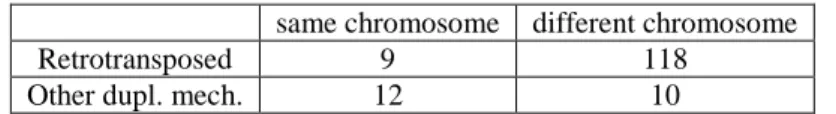
Svalue of zero. They were classified as retrotransposed or duplicated by other mechanisms through the absence or presence of introns in one of the genes. Of the 157 genes, 129 lack introns and thus likely arose through retrotransposition. A great majority of the retrotransposed genes are located on different chromosomes from their corresponding gene, as opposed to those pairs duplicated by other mechanisms (Table 1).
Table 1: Chromosomal location of duplicate pairs by duplication mechanism same chromosome different chromosome
Retrotransposed 9 118
Other dupl. mech. 12 10
2.3.2 Microsatellite screen for selection
Microsatellites with di-, tri-, and tetra-nucleotide repeats were selected for typing. The mean heterozygosity was compared among the types, to ensure no repeat type is much more monomorphic than others, making it unsuitable for selection tests (Figure 5).
There are no significant differences between the heterozygosities when tested with an
ANOVA (p = 0.2).
A screen of duplicated genes for positive selection
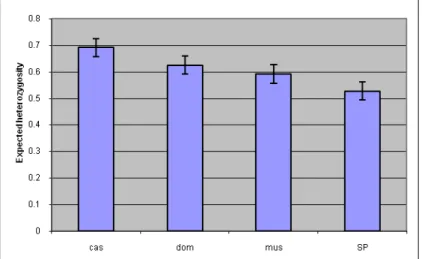
The heterozygosity was also averaged over the four different subspecies. The heterozygosity means over the subspecies show similar values, with Mus spretus having the least genetic variation (Figure 5), but the differences are not significant when tested with an ANOVA (p = 0.34).
General population genetic parameters derived from the microsatellite data are presented in Table 2. The M. m. castaneus subspecies sample shows the highest heterozygosity as well as variance in repeat number, which is expected under the assumption that a large fraction of the animals from this subspecies represents the
Figure 5: Mean heterozygosity of the different microsatellite repeat types. n is 36 for di-, 8 for tri-, and 25 for the tetranucleotide repeats, all (sub)species data is pooled.
Figure 6: Average expected heterozygosity for each of the subspecies. cas: M. m.
castaneus; dom: M. m. domesticus; mus: M. m. musculus; SP: Mus spretus
A screen of duplicated genes for positive selection
most ancestral population, the one from India (46 of 58 total) (Din, Anand et al.
1996). The expected heterozygosity is significantly higher than the observed heterozygosity in all but one case, as has been found previously in a similar study (Ihle, Ravaoarimanana et al. 2006). Ihle et. al. assume the reason for this difference is the social system of mice, which often inbreed within a deme. For this reason a similar sampling scheme was employed that aims to sample individual mice from single demes only, and the expected heterozygosity was used for further analysis, assuming all alleles are thus from a panmictic pool.
Table 2: Population genetic parameters of the subspecies studied Heterozygosity No. of
animals observed expected
Hardy- Weinberg exact test p
Variance in repeat number
Avg. no. of alleles
M. m. castaneus 58 0.47 0.69 <0.001 18.26 12.36
M. m. domesticus 116 0.39 0.62 <0.001 10.34 9.16
M. m. musculus 71 0.43 0.59 <0.001 9.94 8.75
M. spretus 46 0.40 0.53 <0.001 8.35 7.22
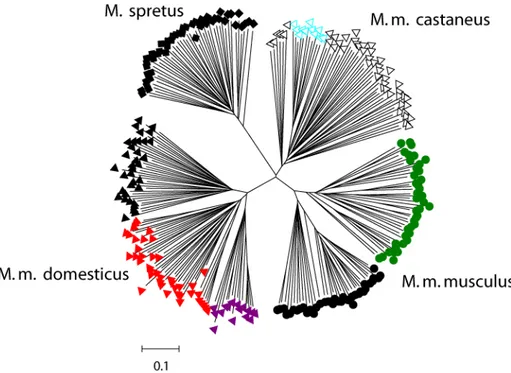
An allele sharing tree was calculated for all individuals which is shown in Figure 7.
All subspecies are clearly separated in the tree, and all individuals are grouped into populations according to their geographic origin.
Figure 7: Allele sharing tree based on 69 microsatellites in the four (sub)species.
Black circles, Kazakhstan; green circles, Czech Republic; open triangles, India;
A screen of duplicated genes for positive selection
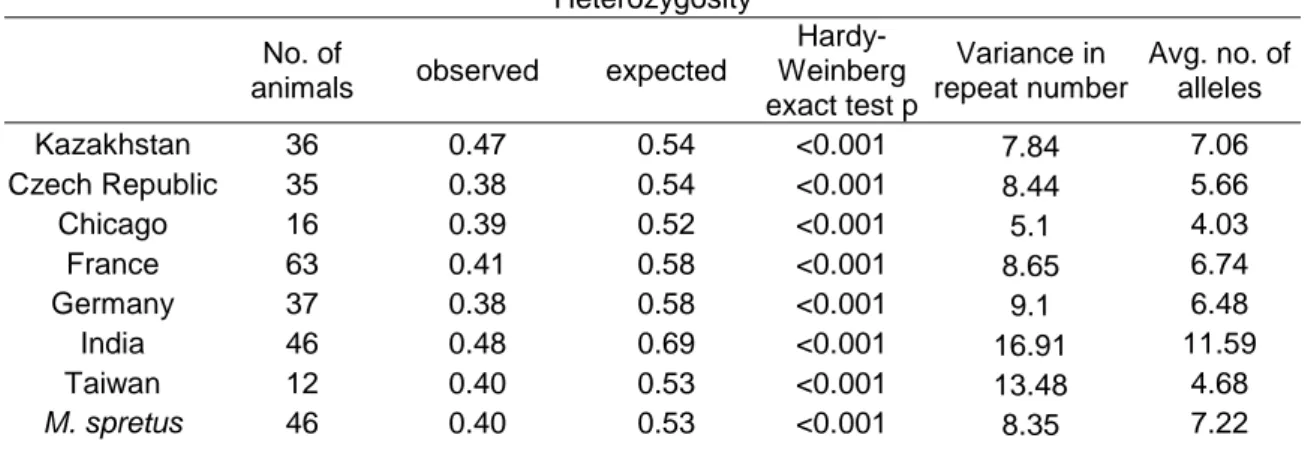
The trend that the more ancestral populations have the higher heterozygosity and variability is also evident on the population level. Table 3 shows that the populations from Kazakhstan and India have the highest heterozygosity, and India a noticeably high difference between the expected and observed value, while it is low for the Kazakhstan data as compared to the other populations.
Table 3: Population genetic parameters of the populations studied Heterozygosity No. of
animals observed expected
Hardy- Weinberg exact test p
Variance in repeat number
Avg. no. of alleles
Kazakhstan 36 0.47 0.54 <0.001 7.84 7.06
Czech Republic 35 0.38 0.54 <0.001 8.44 5.66
Chicago 16 0.39 0.52 <0.001 5.1 4.03
France 63 0.41 0.58 <0.001 8.65 6.74
Germany 37 0.38 0.58 <0.001 9.1 6.48
India 46 0.48 0.69 <0.001 16.91 11.59
Taiwan 12 0.40 0.53 <0.001 13.48 4.68
M. spretus 46 0.40 0.53 <0.001 8.35 7.22