doi:10.1351/pac200779050895
© 2007 IUPAC
INTERNATIONAL UNION OF PURE AND APPLIED CHEMISTRY ANALYTICAL CHEMISTRY DIVISION*
CHEMICAL SPECIATION OF ENVIRONMENTALLY SIGNIFICANT METALS WITH INORGANIC LIGANDS PART 2: THE Cu 2+ –OH – , Cl – , CO 3 2– , SO 4 2– , AND PO 4 3–
SYSTEMS
(IUPAC Technical Report)
Prepared for publication by
KIPTON J. POWELL1,‡, PAUL L. BROWN2, ROBERT H. BYRNE3, TAMAS GAJDA4, GLENN HEFTER5, STAFFAN SJÖBERG6, AND HANS WANNER7
1Department of Chemistry, University of Canterbury, Christchurch, New Zealand; 2Rio Tinto Technical Services, 1 Research Avenue, Bundoora VIC3083, Australia; 3College of Marine Science,
University of South Florida, 140 Seventh Avenue South, St. Petersburg, FL 33701-5016, USA;
4Department of Inorganic and Analytical Chemistry, A. József University, P.O. Box 440, Szeged 6701, Hungary; 5School of Chemical and Mathematical Sciences, Murdoch University, Murdoch, WA 6150, Australia; 6Department of Inorganic Chemistry, Umeå University, S-901 87 Umeå, Sweden; 7Swiss
Federal Nuclear Safety Inspectorate, CH-5232 Villigen, Switzerland
*Membership of the Analytical Chemistry Division during the final preparation of this report was as follows:
President: R. Lobinski (France); Titular Members: K. J. Powell (New Zealand); A. Fajgelj (Slovenia); R. M. Smith (UK); M. Bonardi (Italy); P. De Bièvre (Belgium); B. Hibbert (Australia); J.-Å. Jönsson (Sweden); J. Labuda (Slovakia); W. Lund (Norway); Associate Members: Z. Chai (China); H. Gamsjäger (Austria); U. Karst (Germany); D. W. Kutner (Poland); P. Minkkinen (Finland); K. Murray (USA); National Representatives:
C. Balarew (Bulgaria); E. Dominguez (Spain); S. Kocaoba (Turkey); Z. Mester (Canada); B. Spivakov (Russia);
W. Wang (China); E. Zagatto (Brazil); Provisional Member: N. Torto (Botswana).
‡Corresponding author: E-mail: kip.powell@canterbury.ac.nz
Republication or reproduction of this report or its storage and/or dissemination by electronic means is permitted without the need for formal IUPAC permission on condition that an acknowledgment, with full reference to the source, along with use of the copyright symbol ©, the name IUPAC, and the year of publication, are prominently visible. Publication of a translation into another language is subject to the additional condition of prior approval from the relevant IUPAC National Adhering Organization.
Chemical speciation of environmentally significant metals with inorganic ligands Part 2: The Cu 2+ –OH – , Cl – , CO 3 2– , SO 4 2– , and PO 4 3– systems
(IUPAC Technical Report)
Abstract: Complex formation between CuIIand the common environmental lig- ands Cl–, OH–, CO32–, SO42–, and PO43–can have a significant effect on CuIIspe- ciation in natural waters with low concentrations of organic matter. Copper(II) complexes are labile, so the CuIIdistribution amongst these inorganic ligands can be estimated by numerical modeling if reliable values for the relevant stability (formation) constants are available. This paper provides a critical review of such constants and related thermodynamic data. It recommends values of log10βp,q,r° valid at Im= 0 mol kg–1and 25 °C (298.15 K), along with the equations and spe- cific ion interaction coefficients required to calculate log10βp,q,rvalues at higher ionic strengths. Some values for reaction enthalpies, ∆rHm, are also reported where available.
In weakly acidic fresh water systems, in the absence of organic ligands, CuII speciation is dominated by the species Cu2+(aq), with CuSO4(aq) as a minor species. In seawater, it is dominated by CuCO3(aq), with Cu(OH)+, Cu2+(aq), CuCl+, Cu(CO3)OH–, Cu(OH)2(aq), and Cu(CO3)22–as minor species. In weakly acidic saline systems, it is dominated by Cu2+(aq) and CuCl+, with CuSO4(aq) and CuCl2(aq) as minor species.
Keywords: chemical speciation; copper; environmental; ligands; stability con- stants; IUPAC Analytical Chemistry Division.
CONTENTS
1. INTRODUCTION
2. SUMMARY OF RECOMMENDED VALUES 3. CuIISOLUTION CHEMISTRY
4. DATA SELECTION AND EVALUATION
5. METHODS FOR NUMERICAL EXTRAPOLATION OF DATA TO Im= 0 mol kg–1. 6. EVALUATION OF EQUILIBRIUM CONSTANTS (HOMOGENEOUS REACTIONS)
6.1 The Cu2+–OH–system 6.1.1 Formation of CuOH+ 6.1.2 Formation of Cu(OH)2(aq)
6.1.3 Formation of Cu(OH)3–and Cu(OH)42–
6.1.4 Formation of Cu2OH3+, Cu2(OH)22+, and Cu3(OH)42+
6.2 The Cu2+–Cl–system 6.2.1 Formation of CuCl+ 6.2.2 Formation of CuCl2(aq)
6.2.3 Formation of CuCl3–and CuCl42–
6.3 The Cu2+–CO32–system
6.3.1 Formation of CuCO3(aq) 6.3.2 Formation of Cu(CO3)22–
6.3.3 Formation of CuHCO3+ 6.3.4 Formation of Cu(CO3)OH– 6.4 The Cu2+–SO42–system
6.4.1 Formation of CuSO4(aq)
6.4.2 Higher-order Cu2+–SO42–complexes 6.5 The Cu2+–PO43–system
7. EVALUATION OF EQUILIBRIUM CONSTANTS (HETEROGENEOUS REACTIONS) 7.1 The Cu2+–OH–system: Solubility of CuO (tenorite) and Cu(OH)2
7.2 The Cu2+–CO32––OH–system
7.2.1 The solubility of Cu2(CO3)(OH)2(s) (malachite) 7.2.2 The solubility of Cu3(CO3)2(OH)2(azurite) 7.3 The Cu2+–SO42–system
7.4 The Cu2+–PO43–system
8. EVALUATION OF ENTHALPY DATA (HOMOGENEOUS AND HETEROGENEOUS REACTIONS)
8.1 The Cu2+–OH–system 8.2 The Cu2+–Cl–system 8.3 The Cu2+–SO42–system
9. SPECIATION IN MULTICOMPONENT SYSTEMS: Cu2+–H+–Cl––CO32––PO43––SO42–
9.1 Fresh water in equilibrium with CO2(g) 9.2 Seawater and saline systems
9.3 Summary
10. QUANTITIES, SYMBOLS, AND UNITS USED IN THIS TECHNICAL REPORT REFERENCES
APPENDIX 1A
Data evaluation criteria APPENDIX 1B
Complex formation by polyvalent anions (SO42–, CO32–, PO43–) APPENDIX 2
Selected equilibrium constants APPENDIX 3
SIT plots for Cu2+–L systems
1. INTRODUCTION
This review is the second in a series relevant to the speciation of metal ions in environmental waters at low to moderate ionic strengths. It provides access to the best available stability constants for chemical speciation modeling of reactions of Cu2+with the major environmental inorganic ligands: Cl–, OH–, CO32–, SO42–, and PO43–. The first in this series was a review of Hg2+complexation reactions with these ligands, and the protonation*reactions of CO32–and PO43–[2005PBa]. Future reviews will focus on equilibria involving the same ligands with Pb2+, Cd2+, and Zn2+.
The first review [2005PBa] discussed the relevance of chemical speciation modeling to our under- standing of the equilibrium reactions of labile species in aqueous systems. It noted the need for reliable
*By common usage, the terms “proton” and “protonation” refer to the natural isotopic mixture of hydrogen, not isotopically pure
1H. Strictly speaking, the reaction is hydronation.
stability (formation) constants that are applicable at the ionic strength and temperature of the medium studied. The reader is referred to that document [2005PBa] for (i) the nomenclature used to express sta- bility constants βp,q,r, *βp,q,r°, Kn, and *Kn(Appendix 1A); (ii) the criteria used to determine whether published data (βp,q,rand ∆rHm) are “accepted” for inclusion in the critical evaluation or “rejected”; (iii) the principles of the specific ion interaction theory (SIT) [97GRE]; and (iv) the application of SIT func- tions [97GRE] to effect regression of “accepted” data at finite ionic strengths to obtain values at Im= 0 mol kg–1(infinite dilution). The primary source of data is the IUPAC Stability Constants Database, SC-Database [2005PET].
For each Cu2+–ligand combination, the present review will
• identify the most reliable publications and stability constants;
• identify (and reject) unreliable stability constants;
• establish correlations among the accepted data on the basis of their ionic strength dependence, using the SIT functions;
• establish recommended values of βp,q,r° and Ks0° at 25 °C (298.15 K) and Im= 0 mol kg–1;
• identify the most reliable reaction enthalpy values ∆rHmfor the equilibrium reactions;
• provide the user with the numerical relationships that can be used to calculate values of βp,q,rat Im> 0 mol kg–1;
• provide examples of SIT plots for βp,q,rextrapolations;
• provide examples of distribution diagrams for binary and multicomponent systems; and
• provide values of βp,q,rapplicable to calculations in fresh water and saline systems.
Literature values for stability constants [2005PET], or formation constants [97INC], of metal–lig- and complexes are reported for ionic media of nominally fixed and (usually comparatively) high ionic strength. The high ionic strength is normally achieved by addition in large excess of a supposedly non- complexing 1:1 electrolyte such as NaClO4. The reported constants, designated by βp,q,ror Kn, are strictly valid only at the specified ionic strength in that medium. Most frequently, such constants are re- ported on the amount concentration (mol solute/dm3solution) scale as equilibrium concentration prod- ucts (or quotients). These concentration products for a specified ionic strength, Ic, are related to the stan- dard (state) equilibrium constants, βp,q,r° and Kn°, the equilibrium activity products, by βp,q,r° = limβp,q,r(Ic→0) and Kn° = lim Kn(Ic→0) [2005PBa].
The stability constants are as well defined thermodynamically as those referring to pure water (the equilibrium activity products) [97INC].
In this work, the “accepted” values for stability constants βp,q,rand Knwere initially converted to the molality (mol kg–1) scale. The limiting values at Im= 0 mol kg–1(βp,q,r° and Kn°) were then ob- tained by weighted linear regression against Imusing the SIT equations to describe the ionic strength dependence of ion activity coefficients. The weighting (uncertainty) assigned to each value followed the guidelines in [92GRE, Appendix C].
Consistent with common practice, the quotients βp,q,rand Knare referred to as stability constants (whether defined on the amount concentration or molality scales) while the equilibrium activity prod- ucts βp,q,r° and Kn° are referred to as the standard (state) equilibrium constants; see [2005PBa]
Appendix 1A.
All reactions described in this document refer to aqueous solution, e.g., 2Cu2+(aq) + 2H2O Cu2(OH)22+(aq) + 2H+(aq)
For simplicity, the suffixes such as (aq) are not used unless a species has zero net charge, in which case the phase is specified, e.g., Cu(OH)2(aq) and CuO(s). Further, in this document “amount concen- tration” is abbreviated to “concentration”, the units being mol dm–3(= mol L–1, or M).
2. SUMMARY OF RECOMMENDED VALUES
Tables 1 to 5 provide a summary of the standard equilibrium constants, reaction ion interaction co- efficients, ∆ε, and reaction enthalpies (where available) for the formation of Cu2+complexes with the selected inorganic anions. These were derived from a critical evaluation of the available literature data [2005PET], with a focus particularly on values for 25 °C and perchlorate media, and the application of SIT functions in regression analyses of the accepted data. The reader is referred to [2005PBa] for definition of the terms “Recommended” (R) and “Provisional” (P) used in these Tables. The log10βp,q,r°, log10Kn°, and log10*βp,q,r° values are for 298.15 K, 1 bar (105Pa), and infinite dilution (Im= 0 mol kg–1).
Table 1 Recommended values for the Cu2+–OH–system at 298.15 K, 1 bar, and I = 0 mol kg–1.
R = Recommended; P = Provisional. ∆εvalues for NaClO4media. The uncertainties represent two standard deviations of the regression intercept (log10K°) and of the slope (∆ε).
Reaction Constant Evaluation
Cu2++ H2O CuOH++ H+ log10*K1° = –7.95 ± 0.16 R
∆ε = –(0.33 ± 0.08) kg mol–1
Cu2++ 2H2O Cu(OH)2(aq) + 2H+ log10*β2° = –16.2 ± 0.2 R
∆ε = (0.14 ± 0.36) kg mol–1
Cu2++ 3H2O Cu(OH)3–+ 3H+ log10*β3 = –26.60 ± 0.09 R
∆ε1 = 0.50 ± 0.06 kg mol–1
Cu2++ 4H2O Cu(OH)42–+ 4H+ log10*β4° = –39.74 ± 0.18 P
∆ε1 = 0.43 ± 0.05 kg mol–1
2Cu2++ H2O Cu2OH3++ H+ log10*β2,1° = –6.40 ± 0.12 P
∆ε = (0.04 ± 0.04) kg mol–1
2Cu2++ 2H2O Cu2(OH)22++ 2H+ log10*β2,2° = –10.43 ± 0.07 R
∆ε = –(0.09 ± 0.04) kg mol–1
3Cu2++ 4H2O Cu3(OH)42++ 4H+ log10*β3,4° = –21.1 ± 0.2 P
CuO(s) + 2H+Cu2++ H2O log10*Ks0° = 7.64 ± 0.06 R
∆ε = (0.04 ± 0.06) kg mol–1
Cu(OH)2(s) + 2H+Cu2++ 2H2O log10*Ks0° = 8.67 ± 0.05 R
∆ε2 = (0.04 ± 0.06) kg mol–1
CuO(s) + H2O Cu2++ 2OH– log10Ks0° = –20.36 ± 0.06 R
Cu(OH)2(s) Cu2++ 2OH– log10Ks0° = –19.33 ± 0.05 R
1From [97PLY].
2Assumed value for ∆ε; see Section 7.1.
Table 2 Recommended values for the Cu2+–Cl–system at 298.15 K and Im= 0 mol kg–1. R = Recommended, P = Provisional. ∆εvalues for ClO4–medium.
Reaction Constant Evaluation
Cu2++ Cl–CuCl+ log10K1° = 0.83 ± 0.09 R
∆ε = –(0.05 ± 0.02) kg mol–1
Cu2++ 2Cl–CuCl2(aq) log10β2° = 0.6 ± 0.3 P
∆ε = –(0.10 ± 0.06) kg mol–1
Table 3 Recommended values for the Cu2+–H+–CO32–system at 298.15 K, 1 bar, and Im= 0 mol kg–1. R = Recommended, P = Provisional. ∆εvalues for ClO4–medium.
Reaction Constant Evaluation
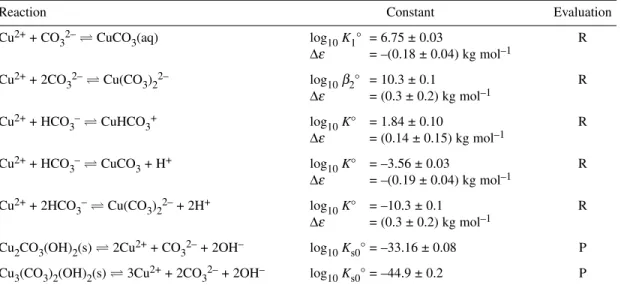
Cu2++ CO32–CuCO3(aq) log10K1° = 6.75 ± 0.03 R
∆ε = –(0.18 ± 0.04) kg mol–1
Cu2++ 2CO32–Cu(CO3)22– log10β2° = 10.3 ± 0.1 R
∆ε = (0.3 ± 0.2) kg mol–1
Cu2++ HCO3–CuHCO3+ log10K° = 1.84 ± 0.10 R
∆ε = (0.14 ± 0.15) kg mol–1
Cu2++ HCO3–CuCO3+ H+ log10K° = –3.56 ± 0.03 R
∆ε = –(0.19 ± 0.04) kg mol–1
Cu2++ 2HCO3–Cu(CO3)22–+ 2H+ log10K° = –10.3 ± 0.1 R
∆ε = (0.3 ± 0.2) kg mol–1
Cu2CO3(OH)2(s) 2Cu2++ CO32–+ 2OH– log10Ks0° = –33.16 ± 0.08 P Cu3(CO3)2(OH)2(s) 3Cu2++ 2CO32–+ 2OH– log10Ks0° = –44.9 ± 0.2 P
Table 4 Recommended values for the Cu2+–SO42–system at 298.15 K and Im= 0 mol kg–1. R = Recommended, P = Provisional.
Reaction Constant Evaluation
Cu2++ SO42–CuSO4(aq) log10K1° = 2.35 ± 0.05 R
∆ε = –(0.16 ± 0.07) kg mol–1 P1
∆ε = –(0.05 ± 0.02) kg mol–1 P2
∆rHm° = 7.3 ± 1.5 kJ mol–1 R
∆rSm° = 68.4 ± 0.7 J K–1mol–1 R
1Calculated for NaClO4medium and ajB = 1.15; see Section 6.4.1.
2Calculated for NaClO4medium, ajB = 1.50 and log10K1° fixed at 2.35 ± 0.05; see Section 6.4.1.
Table 5 Recommended values for the Cu2+–H+–PO43–system at 298.15 K and Im= 0.101 mol kg–1NaClO4. R = Recommended, P = Provisional.
Reaction Constant Evaluation
Cu2++ HPO42–CuHPO4(aq) log10K = 3.25 ± 0.2 R1 Cu2++ H++ PO43–CuHPO4(aq) log10β= 14.93 ± 0.2 P2,3
1Provisional value calculated for I = 0 mol kg–1, log10K° = 4.15 ± 0.3.
2Provisional assignment, based on unavailability of phosphate protonation constant in 0.101 mol kg–1 NaClO4.
3Provisional value calculated for I = 0 mol kg–1is log10β° = 16.49 ± 0.3.
3. CuIISOLUTION CHEMISTRY
In aqueous solution, copper has two common oxidation states, CuIand CuII. The disproportionation re- action 1,
2Cu+Cu2++ Cu(s) (1)
has an equilibrium constant log10K≈6 [52LAa], and thus CuIIis the predominant oxidation state in aqueous solution. However, in the presence of particular types of complexing agents, mostly those that
have “soft”, π-acceptor donor atoms [2005PET], CuImay become dominant. Other oxidation states of Cu are also known [88COT] but are not stable in aqueous solution.
The hydrolysis reactions of Cu2+are less pronounced than those of Hg2+(e.g., log10*K1° for Cu2+) is –7.95 (cf. Hg2+–3.40 [2005PBa]) and thus have a smaller influence on its aqueous speciation.
Like HgII, CuIIalso shows a propensity to form polynuclear hydroxido complexes: Cu2(OH)22+and, to a lesser extent, Cu2(OH)3+ and Cu3(OH)42+. Due to the formation of these polynuclear species, the onset of CuIIhydrolysis occurs at lower pH as [CuII]Tincreases (where here, and throughout this re- view, the subscript T denotes the total concentration). The CuII hydroxide precipitates that form at higher pH are weakly amphoteric and thus dissolve in strongly alkaline solution by formation of species such as Cu(OH)3–and Cu(OH)42–.
4. DATA SELECTION AND EVALUATION
The data that meet our selection criteria for use in the SIT regression analyses for Cu2+complexes are recorded in Tables A2-1 through A2-11 in Appendix 2. The criteria used for the acceptance of litera- ture data as “reliable” (designated “reported” in the Tables, and included in the regression analysis) and those for the rejection of data (indicated by a reference superscript in the Table footnotes) are summa- rized in Appendix 1A. The abbreviations used in these Tables to describe the experimental methods are:
emf: measurement of cell potentials (emf) using a redox electrode; sol: solubility determination; gl: pH measurement by glass electrode; con: conductivity; cry: cryoscopy; dis: distribution between partially miscible solvents; ise: measurement of the cell potentials using an ion selective electrode; cal: calor- imetry; refr: refractometry; vlt: voltammetry (polarography); sp: (UV–vis) spectrometry; K(T): varia- tion of log10K with temperature.
The column headed log10K (reported) contains the “accepted” stability constant data, on the mo- lality (mol kg–1) or amount concentration (mol dm–3) scales, as published. The column headed log10K (accepted) contains the same data converted to the molality scale (to facilitate SIT analysis) and indi- cates our assigned uncertainty [2005PBa].
5. METHODS FOR NUMERICAL EXTRAPOLATION OF DATA TO Im= 0 mol kg–1
An objective in this work was to obtain the most reliable values for βp,q,rat Im= 0 mol kg–1. This was achieved by use of accepted data over a wide range of ionic strengths and by application of the Brønsted–Guggenheim–Scatchard model (named the specific ion interaction theory, or SIT). This model accounts for the ionic strength-dependent short-range, weak, non-electrostatic interactions be- tween the reactant species and the electrolyte anions or cations. The associated regression analysis of log10βp,q,ragainst Imyields log10βp,q,r° (the standard equilibrium constant) as the intercept at Im= 0 mol kg–1and the specific ion interaction coefficient for the equilibrium, –∆ε(i,k), as the slope.
For the general reaction (omitting most charges for simplicity) pM + qL + rH2O MpLq(OH)r+ rH+
the stability constant βp,q,rdetermined for the MpLq(OH)rspecies in an ionic medium (typically con- taining a 1:1 electrolyte NX of ionic strength Imat concentrations well in excess of those of the inter- acting species) is related to the standard equilibrium constant βp,q,r°, by
log10βp,q,r= log10βp,q,r° + plog10γm(M) + qlog10γm(L) + rlog10a(H2O) – log10γm(p,q,r) –
rlog10γm(H+) (2)
where γm(p,q,r) is the activity coefficient (on the molality scale, subscript m) of the species MpLq(OH)r and γm(i) is given by [97GRE]
log10γm(i) = – zi2A√Im(1 + ajB√Im)–1+ Σkε(i,k) mk= – zi2D + Σkε(i,k) mk (3)
ε(i,k) is the aqueous species interaction coefficient for short-range interactions between ions i and k.
Substitution of eq. 3 into eq. 2, and for conditions such that Im≈mk, gives
log10βp,q,r– ∆z2D – rlog10a(H2O) = log10βp,q,r° – ∆εIm (4) where ∆z2= (pzM+ qzL– r)2+ r – p(zM)2– q(zL)2and ∆ε= ε(complex, N+or X–) + rε(H+,X–) – pε (M+,X–) – qε(L–,N+).
In this review, the term ajB is set at 1.5 kg1/2mol–1/2, the value found by Scatchard to minimize the ionic strength dependence of derived ε(i,k) values [76SCA]. For a 1:1 electrolyte, the term log10 a(H2O) can be calculated from the solution osmotic coefficient, ϕm[59ROB]. For NaClO4, the medium most frequently used in this review, the relationship log10a(H2O) = –(0.01378 ± 0.00003)(Im/mol kg–1) pertains at 25 °C (298.15 K) and Im= 0 to 3.5 mol kg–1[2005PBa]. Values for other media can be cal- culated from data given in [59ROB].
The application of SIT to the selected literature values involves graphical extrapolation of log10 βp,q,r– ∆z2D – rlog10a(H2O) to mk= 0 (or Im= 0 mol kg–1for a system with a large excess of 1:1 elec- trolyte), using eq. 4. Regression analyses using SIT are represented graphically and are recorded in Appendix 3. For each datum, the assigned uncertainty (Tables A2-1 to A2-11) reflects our estimation of combined experimental, systematic, and numerical uncertainties (see Section 5.2 in [2005PBa]) and is used to weight each value in the SIT regression analysis. Where appropriate, an initial SIT analysis was used to identify outliers based on their deviation from the calculated confidence limits. For a more detailed description, see Section 5.2 in [2005PBa]. The reported uncertainties on log10βp,q,r(log10Kn) and ∆εrepresent two standard deviations of the regression intercept and slope, respectively.
In view of the rather limited data sets available for some equilibrium reactions studied in NaClO4, data for other media have sometimes been included in the regression analyses, where necessary.
6. EVALUATION OF EQUILIBRIUM CONSTANTS (HOMOGENEOUS REACTIONS) 6.1 The Cu2+–OH–system
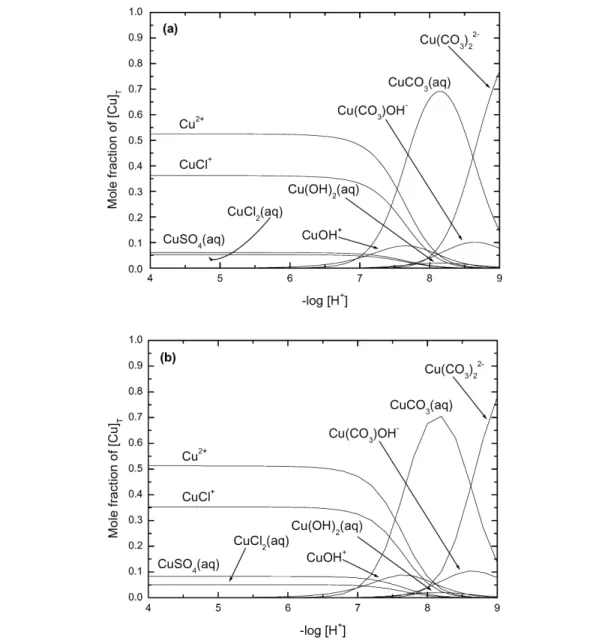
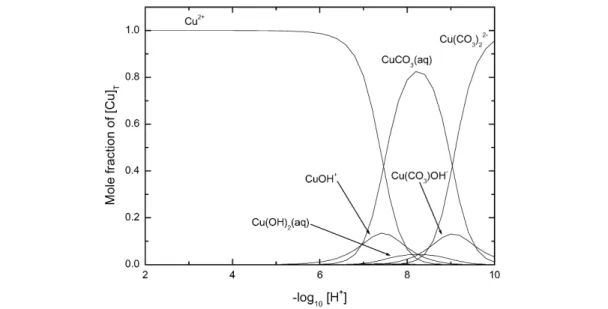
The speciation diagram for the Cu2+–OH– system, based on our recommended values recorded in Table 1 for stability constants at Im= 0 mol kg–1, is shown in Fig. 1. Results outside the –log10[H+] range 2 to 12 should be viewed with caution as activity coefficients deviate significantly from 1.0.
The SC-Database [2005PET] contains 87 investigations that report data for the hydrolysis reac- tions of Cu2+, but the values for the formation constants are strongly divergent. For example, at low ionic strengths the values reported for log10*K1vary from –6.8 (30 °C, 0.10 mol dm–3KCl) [52CCa, 77VNa] to –8.0 (18 °C) [43PEa], or even <–8 (25 °C, 0.05 mol dm–3KCl) [60PEc, 80PKb]. Proposed speciation schemes even do not agree about the number and stoichiometry of the mono- and/or poly- nuclear complexes formed. Indeed, the identification and quantification of the mononuclear Cu(OH)n(2–n)+complexes (n = 1, 2) is difficult due to the formation of di- and trinuclear complexes even at quite modest values of [CuII]T. Furthermore, the formation of (possibly metastable) “CuII-hy- droxide” colloidal suspensions and/or precipitates in slightly hydrolyzed solutions adds complexity in terms of measurement accuracy and data interpretation.
The determination of stability constants for the mononuclear complexes Cu(OH)3– and Cu(OH)42–is currently based on solubility measurements in alkaline solutions. On the other hand, the stabilities of CuOH+and Cu(OH)2(aq), as well as the composition and stabilities of the polynuclear species, have mostly been determined from potentiometric titrations utilizing a combination of glass and copper ion-selective electrode (ise) measurements.
Plyasunova et al. [97PLY] recently reported a critical evaluation of CuII hydrolysis equilibria.
However, in their SIT analysis, no corrections were introduced for changes in the activity of water.
Subsequent to this, De Robertis et al. [97RSb] published a comprehensive study of the CuIIhydrolysis
reactions in homogeneous solution at Ic= 0.10–1.0 mol dm–3NaClO4. These data, which were not cited by [97PLY], have contributed significantly to the present analysis.
6.1.1 Formation of CuOH+
Formation of the first monomeric hydrolysis species can be described by eq. 5,
Cu2++ H2O CuOH++ H+ (5)
Fig. 1 Speciation diagram for the binary Cu2+-hydroxide system at 25 °C as obtained from the Recommended stability constants at Im= 0 mol kg–1(Table 1). Results outside the –log [H+] range of 2–12 should be viewed with caution as activity coefficients deviate from 1.0. No corrections were made for changes in formation constants at high pH (Im> 0 mol kg–1). (a) [Cu]T= 10–9mol dm–3. If the total CuIIconcentration is less than ca. 10–8.35mol dm–3, CuO(s) will not form. The corresponding value with respect to Cu(OH)2(s) is 10–7.31mol dm–3. (b) [Cu]T= 10–5mol dm–3.
This reaction is dominant only when [CuII]Tis in or below the µmol dm–3concentration range.
This follows from the value log10K°(6) = 5.46 (Section 6.1.4) for the dimerization reaction 6
2CuOH+Cu2(OH)22+ (6)
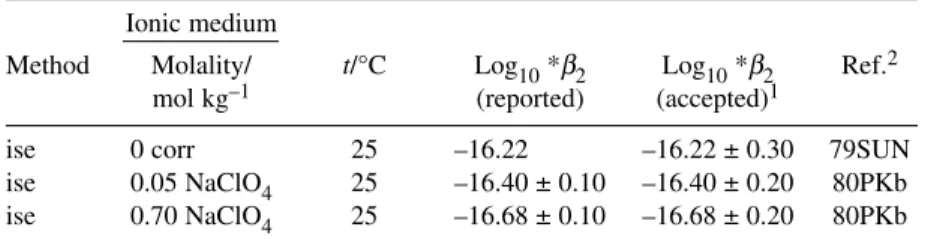
The accepted data for equilibrium 5 are listed in Table A2-1, along with the relevant references and our assigned uncertainties. The data used for the SIT analysis, to determine the standard equilib- rium constant, log10*K1°(eq. 5), and the reaction interaction coefficient, ∆ε(5), were limited to NaClO4 media and 25 °C. The study by Paulson and Kester [80PKb] is regarded as the most reliable with re- spect to the stability of the species CuOH+. They studied CuIIhydrolysis in 0.05 and 0.70 mol kg–1 NaClO4media using a copper ise and low [CuII]T: (1, 2, and 4 µmol kg–1) to minimize the formation of polynuclear complexes. Furthermore, effects due to the adsorption of CuIIonto the vessel walls were accounted for. In addition, the data of Burkov et al. [82BBb] for 3.0 mol dm–3NaClO4were also in- cluded in the SIT analysis.
The weighted regression (Fig. A3-1) used the expression log10*K1+ 2D – log10a(H2O) = log10*K1° – ∆εIm
derived from eqs. 4 and 5 with ∆z2= –2. The intercept yields the Recommended standard constant log10*K1°(eq. 5, 298.15 K) = –7.95 ± 0.16
and the slope yields the value for ∆ε(5) = –(0.33 ± 0.08) kg mol–1, where the uncertainties represent two standard deviations of the regression intercept and slope, respectively. This value of log10*K1° is in excellent agreement with the result of –7.97 ± 0.09 given by Plyasunova et al. [97PLY] from their critical evaluation of CuIIhydrolysis data. On the other hand, the present Recommended value of log10
*K1° disagrees significantly from the earlier estimates derived from potentiometric measurements at low ionic strength and 25 °C (–7.6 [67MSb]; –7.34 [64ACa, 58ACa]; –7.53 [38OGa]). As these latter measurements were performed at relatively high [CuII]T and as higher (i.e., less negative) values of log10 *K1° are consistent with the presence of (undetected) CuII/OH– polynuclear complexes and/or colloidal suspensions, these values are rejected.
The values for ε(Cu2+,ClO4–) = (0.32 ± 0.02) kg mol–1and ε(H+,ClO4–) = (0.14 ± 0.02) kg mol–1 [97GRE] lead to ε(CuOH+,ClO4–) = –(0.15 ± 0.08) kg mol–1. These estimates are in good agreement with those given by Plyasunova et al.: [97PLY] ∆ε(5) = –(0.35 ± 0.06) kg mol–1and ε(CuOH+,ClO4–) = –(0.13 ± 0.10) kg mol–1. From log10*K1° = –7.95 ± 0.16, we derive log10K1° = 6.05 ± 0.16 at 25 °C.
6.1.2 Formation of Cu(OH)2(aq)
The formation of the aqueous Cu(OH)2species can be defined by reaction 7:
Cu2++ 2H2O Cu(OH)2(aq) + 2H+ (7)
To avoid the formation of colloidal CuII-hydroxide particles, studies have been performed at µmol dm–3 concentrations of total copper. Reliable results appear to have been obtained [84GLb, 80PKb] by use of a copper ise, in combination with a glass electrode to measure pH. A SIT analysis (Fig. A3-2) on data presented in Table A2-2 gave the result
log10*β2°(eq. 7, 298.15 K) = –16.2 ± 0.2
This value is in excellent agreement with that given by Plyasunova et al. [97LY] (log10*β2° = –16.23 ± 0.15). The value for ∆ε (7) is (0.1 ± 0.3) kg mol–1. The values for ε(Cu2+,ClO4–) = (0.32 ± 0.02) kg mol–1and ε(H+,ClO4–) = (0.14 ± 0.02) kg mol–1[97GRE] lead to ε(Cu(OH)2,Na+,ClO4–) = (0.14 ± 0.36) kg mol–1. This value is high for an uncharged complex but has a very large uncertainty that in- cludes zero within its range.
The present critical evaluation indicates that log10 *K1° = –7.95 (log10 K1° = 6.05) and log10*K2° = –8.25(log10K2° = 5.75), which is the normal sequence for metal ion hydrolysis reactions
and Cu2+complex formation constants. In contrast, [67MSb] and [68SMd] reported log10K2> log10 K1, i.e., –log10*K1> –log10*K2. This unexpected relationship suggests a change in coordination num- ber at the second hydrolysis step, which seems unlikely for CuII. Higher values of log10K2may result from the presence of a CuII-hydroxy colloid at pH >7 [80PKb] and/or polynuclear species. The values of [67MSb] and [68SMd] are therefore rejected.
6.1.3 Formation of Cu(OH)3–and Cu(OH)42–
Cu(OH)3–and Cu(OH)42–form in alkaline solutions, with the former predominating above pH = 10 and Cu(OH)42–being the main hydrolysis product above pH = 13. McDowell and Johnston [36MJa] deter- mined the stability of these species from studies on the solubility of crystalline CuO(s) in strongly al- kaline solutions (0.04 to 8 mol dm–3KOH). Reactions 8 and 9 were considered:
CuO(s) + H2O + OH–Cu(OH)3– (8)
CuO(s) + H2O + 2OH–Cu(OH)42– (9)
These solubility data have been re-evaluated [97PLY] using the SIT approach. The reported regression provided a good fit to the experimental data and resulted in the solubility constants: log10Ks3° = –4.96
± 0.05 and log10Ks4° = –4.10 ± 0.15 for reactions 8 and 9, respectively. The derived ion interaction co- efficients were ε(K+,Cu(OH)3–) = 0.40 ± 0.02 and ε(K+,Cu(OH)42–) = 0.29 ± 0.05. Solubility studies in 2.2–4.2 mol kg–1NaOH solutions [36MJa], also processed using SIT [97PLY], gave log10Ks4° = –4.07 ± 0.18 with ε(Na+,Cu(OH)42–) = 0.19 ± 0.05. The weighted mean of these two values is log10Ks4° = –4.10 ± 0.16.
From these data, we calculate log10K4°(eq. 10, 298.15 K) = log10Ks4° – log10Ks3° = 0.86 ± 0.16.
Cu(OH)3–+ OH–Cu(OH)42– (10)
The value calculated using the above SIT parameters is 0.92 at Im= 1.05 mol kg–1(1.0 mol dm–3 NaClO4), which is in good agreement with that reported by [70GHb] for 1.0 mol dm–3 NaClO4 (log10K4= 1.1) and that reported by [96FSa] for 1.0 mol dm–3KNO3(log10K4= 0.90). Other values reported are: log10K4= 0.9 (Ic= 0.5 mol dm–3NaClO4) [75LRa] and 0.90 (Im= 0 mol kg–1) [36MJa].
Thus, there is consistency in the literature with respect to the stepwise stability constant for Cu(OH)42–. Ziemniak et al. [92ZJb] studied the dissolution of CuO(s) in alkaline phosphate solutions at 290 to 530 K. From their equilibrium constants for the reactions CuO(s) + 2H2OCu(OH)3–+ H+, and Cu(OH)3–+ H2OCu(OH)4–+ H+and pKw= 14.00, we calculate for 25 °C, log10Ks3° = –4.04 ± 0.17 and log10K4° = 0.38 ± 1.1 for reactions 8 and 10, respectively. These values differ significantly from those discussed above and therefore are rejected.
For reaction 11
CuO(s) + H2O Cu2++ 2OH– (11)
the Recommended equilibrium constant (Section 7.1) is log10Ks0°(eq. 11, 298.15 K) = –20.36 ± 0.06.
Combining reactions 8 and 11 gives the Recommended value for reaction 12
Cu2++ 3OH–Cu(OH)3– (12)
log10β3°(eq. 12, 298.15 K) = –4.96 + 20.36 = 15.40 ± 0.08. Assuming that log10K4° = 0.86 ± 0.16 (as above), one obtains the Recommended value for reaction 13
Cu2++ 4OH–Cu(OH)42– (13)
log10β4°(eq. 13, 298.15 K) = 16.26 ± 0.24.
To summarize, at Im= 0 mol kg–1and 25 °C, the stability of the mononuclear hydrolytic com- plexes, Cu(OH)n(2–n)+expressed in terms of hydrolysis constants have the following Recommended values: log10*β1° = –7.95 ± 0.16; log10*β2° = –16.2 ± 0.2; log10*β3° = –26.60 ± 0.09 (= log10β3° –
3 pKw); and log10*β4° = –39.74 ± 0.18 (= log10β4° – 4 pKw). The corresponding log10βn° values are:
6.05; 11.8, 15.40, and 16.26.
Although these values are Recommended, they exhibit some worrying features. In particular, al- though the present stepwise constants (log10Kn°) show a more or less normal sequence of declining values with increasing coordination number [88COT], the difference log10K2° – log10K1° (= –0.27) is small and close to the statistical value of –0.38 for six-coordinated CuII– complexes (despite the sig- nificant difference in the donor strengths of H2O and OH–). In contrast, there are the expected large dif- ferences between log10K2° = 5.78, log10K3° = 3.57, and log10K4° = 0.86.
6.1.4 Formation of Cu2OH3+, Cu2(OH)22+, and Cu3(OH)42+
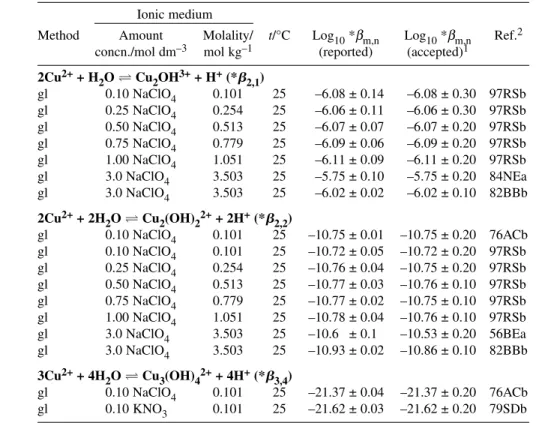
Several intensive studies indicate that Cu2(OH)22+is the predominant polynuclear species in slightly acidic solutions at moderate [CuII]T. Its formation, first reported by Hasigawa [39HAa], has since been confirmed in many studies employing [CuII]T in the millimol dm–3 range [43PEa, 56BEa, 64ACa, 70KAb, 72OKa, 76ACb, 79SDb, 82BBb, 97RSb].
In contrast, Cu2OH3+has been claimed to form only at high [CuII]T(0.3 to 0.9 mol dm–3) at pH
≤ 3.5 and then to less than 1 % [84NEa]. Its existence has also been postulated by others [72OKa, 82BBb, 97RSb]. In addition to these dimeric species, a trinuclear complex Cu3(OH)42+has been sug- gested [60PEc, 76ACb, 79SDb]. This appears to form in measurable amounts only in solutions super- saturated with respect to CuO(s) and Cu(OH)2(s).
Cu2OH3+
The formation of this species can be represented by reaction 14
2Cu2++ H2O Cu2OH3++ H+ (14)
It forms only in concentrated, acidic CuIIsolutions. A detailed study of the ionic strength dependence for this reaction, as well as for reaction 15 below, has been reported by De Robertis et al. [97RSb] in NaClO4media at 25 °C. Data selected for the SIT analysis are listed in Table A2-3, along with refer- ences and our assigned uncertainties. References to (and reasons for) data rejected from this analysis are shown in footnote 2. The Recommended stability constant at zero ionic strength, derived from the weighted regression (Fig. A3-3), is
log10*β2,1°(eq. 14, 298.15 K) = –6.40 ± 0.12
The reaction ion interaction coefficient, ∆ε(14), is (0.04 ± 0.04) kg mol–1. The values for ε(Cu2+,ClO4–) = (0.32 ± 0.02) kg mol–1and ε(H+,ClO4–) = (0.14 ± 0.02) kg mol–1[97GRE] lead to ε(Cu2OH3+,ClO4–) = (0.54 ± 0.05) kg mol–1.
Close inspection of the log10 *β2,1vs. Imdata (Fig. A3-3) indicates that they are not well de- scribed by a simple SIT analysis. At high Im, where experimental accuracy should be greatest, large dis- crepancies exist among the reported values (Table A2-3). Perhaps more importantly, the trend in the data at low Im, all from a single source [97RSb], does not correspond to that imposed by the SIT analy- sis. The latter problem can be treated by allowing the SIT parameter ajB to vary from the Scatchard value of 1.5 kg1/2mol–1/2[76SCA], as was done previously for the protonation equilibria of carbonate and phosphate [2005PBa]. However, the uncertainties associated with the detection of small concentra- tions of polynuclear complexes at low ionic strengths do not warrant such action at present.
Accordingly, the above value of log10*β2,1°(eq. 14) = –6.40 ± 0.12 is downgraded to Provisional and the stated uncertainty must be regarded as indicative only.
Cu2(OH)22+
The formation of the dimeric species Cu2(OH)22+can be represented by reaction 15
2Cu2++ 2H2O Cu2(OH)22++ 2H+ (15)
Data for NaClO4media selected for the SIT analysis are listed in Table A2-3, with our assigned uncertainties. References (and reasons) for data rejected from this analysis are shown in footnote 2. The Recommended stability constant at zero ionic strength, derived from the weighted regression (Fig. A3-4), is
log10*β2,2°(eq. 15, 298.15 K) = –10.43 ± 0.07
The reaction ion interaction coefficient, ∆ε(15), is –(0.07 ± 0.04) kg mol–1. The values for ε(Cu2+,ClO4–) = (0.32 ± 0.02) kg mol–1and ε(H+,ClO4–) = (0.14 ± 0.02) kg mol–1[97GRE] lead to ε(Cu2(OH)22+,ClO4–) = (0.29 ± 0.12) kg mol–1.
From the values for log10*β2,2° and log10*K1°, we derive the value for the dimerization reaction at 25 °C, log10K°(6) = 5.46 ± 0.23.
Cu3(OH)42+
The formation of the trimeric species can be represented by reaction 16. It has been claimed that this species is observed at high [CuII]Tand pH ≈6:
3Cu2++ 4H2O Cu3(OH)42++ 4H+ (16)
A SIT analysis for this reaction is not possible because of the limited data available. Sylva and Davidson [79SDb] reported a value for log10*β3,4(Ic= 0.1 mol dm–3KNO3) which is in reasonable agreement with that reported by [76ACb] (Ic= 0.1 mol dm–3NaClO4) (Table A2-3). The average of these two val- ues gives log10*β3,4(Ic= 0.1 mol dm–3) = –21.5 ± 0.2 at 25 °C. An extrapolation to Im= 0 mol kg–1, assuming the ionic strength dependence to be the same as for the formation of the dimer, Cu2(OH)22+
[∆ε= –(0.07 ± 0.04) kg mol–1], gives the Provisional value log10*β3,4°(eq. 16, 298.15 K) = –21.1 ± 0.2
6.2 The Cu2+–Cl–system
CuIIis generally thought (but see below) to form four consecutive chlorido- complexes in aqueous so- lution (reactions 17 to 20).
Cu2++ Cl–CuCl+ (17)
Cu2++ 2 Cl–CuCl2(aq) (18)
Cu2++ 3 Cl–CuCl3– (19)
Cu2++ 4 Cl–CuCl42– (20)
These complexes are claimed to have different electronic absorption bands, and their formation has therefore been investigated mostly by UV–vis spectrometry. Unfortunately, the bands are strongly overlapping and require simultaneous determination of the constants and the absorptivities, leading to correlation problems in the data. Furthermore, the complexes CuCl+and CuCl2(aq) are weak, while the higher-order complexes are extremely weak and only form at very high chloride concentrations.
Reliable stability constants can therefore only be obtained from measurements in solutions containing background electrolyte at high concentration. However, use of high ionic strength media does not a pri- ori guarantee constant activity coefficients when the replacement of the background anion (usually per- chlorate) by chloride is significant. Several authors have discussed these problems and presented pos- sible solutions, e.g., [77BSa, 83BWa, 83RFa, 87BJE, 89IPa, 97WZb]. No evidence has been reported for the existence of polynuclear species.
Most of the following discussion refers to the better-characterized lower-order complexes (reac- tions 17 and 18). The Recommended values for stability constants at Im= 0 mol kg–1 are shown in Table 2. As the chloride concentrations required for the formation of these complexes is well above


![Fig. 4 Speciation diagram for the Cu 2+ –H + –Cl – –CO 2 –HPO 4 2– –SO 4 2– system at 25 °C with total concentrations [Cl – ] T = 0.23 mmol dm –3 , [SO 4 2– ] T = 0.42 mmol dm –3 and [HPO 4 2– ] T = 0.7 µ mol dm –3](https://thumb-eu.123doks.com/thumbv2/1library_info/5146439.1661257/26.810.90.718.574.880/fig-speciation-diagram-hpo-total-concentrations-mmol-mmol.webp)