doi:10.1351/PAC-REP-09-03-05
© 2009 IUPAC, Publication date (Web): 29 October 2009
Chemical speciation of environmentally significant metals with inorganic ligands.
Part 3: The Pb 2+ + OH – , Cl – , CO 3 2– , SO 4 2– , and PO 4 3– systems (IUPAC Technical Report)*
Kipton J. Powell
1, Paul L. Brown
2, Robert H. Byrne
3, Tamas Gajda
4, Glenn Hefter
5, Ann-Kathrin Leuz
6, Staffan Sjöberg
7,‡, and
Hans Wanner
61Department of Chemistry, University of Canterbury, Christchurch, New Zealand;
2Rio Tinto Technology and Innovation, 1 Research Avenue, Bundoora VIC 3083, Australia; 3College of Marine Science, University of South Florida, 140 Seventh Avenue South, St. Petersburg, FL 33701-5016, USA; 4Department of Inorganic and Analytical Chemistry, A. József University, P.O. Box 440, Szeged 6701, Hungary;
5School of Chemical and Mathematical Sciences, Murdoch University, Murdoch, WA 6150, Australia; 6Swiss Federal Nuclear Safety Inspectorate, CH-5232 Villigen, Switzerland; 7Department of Chemistry, Umeå University, S-901 87 Umeå, Sweden
Abstract: Complex formation between PbII and the common environmental inorganic lig- ands, Cl–, OH–, CO32–, SO42–, and PO43–, can be significant in natural waters with low con- centrations of organic matter. Numerical modeling of the speciation of PbIIamongst these in- organic ligands requires reliable values for the relevant stability (formation) constants. This paper provides a critical review of such constants and related thermodynamic data. It recom- mends values of log10βp,q,r°valid at Im= 0 mol kg–1and 25 °C (298.15 K), along with the equations and empirical coefficients required to calculate log10βp,q,rvalues at higher ionic strengths using the Brønsted–Guggenheim–Scatchard specific ion interaction theory (SIT).
Some values for reaction enthalpies, ΔrH, are also reported.
In weakly acidic fresh water systems (–log10{[H+]/c°} < 6), the speciation of PbIIis similar to that of CuII. In the absence of organic ligands, PbIIspeciation is dominated by Pb2+(aq), with PbSO4(aq) as a minor species. In weakly alkaline solutions, 8.0 < –log10 {[H+]/c°} < 9.0, the speciation is dominated by the carbonato species PbCO3(aq) and Pb(CO3)22–. In weakly acidic saline systems (–log10{[H+]/c°} < 6), the speciation is domi- nated by PbCln(2–n)+complexes, (n= 0–3), with Pb2+(aq) as a minor species. In this medium (and in seawater), the speciation contrasts with that of CuIIbecause of the higher stability of the Pb2+-chlorido- complexes. In seawater at –log10{[H+]/c°} = 8.2, the calculated specia- tion is less well defined, although it is clearly dominated by the uncharged species PbCO3(aq) (41 % of [Pb]T) with a significant contribution (16 %) from Pb(CO3)Cl–and minor contributions (5–10 %) from PbCln(2–n)+, (n= 0–3) and Pb(CO3)22–. The uncertainty in calculations of PbIIspeciation in seawater arises from (a) the large uncertainty in the sta- bility constant for the apparently dominant species PbCO3(aq), (b) the reliance on statistical predictions for stability constants of the ternary species Pb(CO3)Cl–and Pb(CO3)OH–, and (c) the uncertainty in the stability constant for PbCl42–, the available value being considered
*Sponsoring body: IUPAC Analytical Chemistry Division: see more details on p. 2453.
‡Corresponding author: E-mail: staffan.sjoberg@chem.umu.se
“indicative” only. There is scope for additional detailed high-quality measurements in the Pb2++ CO32–+ Cl–system.
Keywords: chemical speciation; environmental; lead; ligands; stability constants.
CONTENTS
1. INTRODUCTION
2. SUMMARY OF RECOMMENDED VALUES 3. PbIISOLUTION CHEMISTRY
4. DATA SELECTION AND EVALUATION
5. METHODS FOR NUMERICAL EXTRAPOLATION OF DATA TOIm= 0 mol kg–1 6. EVALUATION OF EQUILIBRIUM CONSTANTS (HOMOGENEOUS REACTIONS)
6.1 The Pb2++ OH–system 6.1.1 Formation of PbOH+
6.1.2 Formation of Pb(OH)n(2–n)+, n = 2, 3, 4
6.1.3 Formation of Pb3(OH)42+, Pb4(OH)44+, and Pb6(OH)84+
6.1.4 Formation in nitrate media 6.2 The Pb2++ Cl–system
6.2.1 Formation of PbCl+ 6.2.2 Formation of PbCl2(aq)
6.2.3 Formation of PbCl3–and PbCl42–
6.3 The Pb2++ CO32–system 6.3.1 Formation of PbCO3(aq) 6.3.2 Formation of Pb(CO3)22–
6.3.3 Formation of PbHCO3+
6.3.4 Formation of Pb(CO3)OH–and Pb(CO3)Cl– 6.3.5 Formation of polynuclear carbonato species 6.4 The Pb2++ SO42–system
6.4.1 Formation of PbSO4(aq)
6.4.2 Formation of Pb(SO4)22–and other complexes 6.5 The Pb2++ PO43–system
7. EVALUATION OF EQUILIBRIUM CONSTANTS (HETEROGENEOUS SYSTEMS) 7.1 The Pb2++ OH–system and the solubility of PbO(red), PbO(yellow), and “Pb(OH)2”(s) 7.2 The Pb2++ Cl–system
7.3 The Pb2++ CO32–+ Cl–system
7.3.1 Solubility of PbCO3(s) (cerussite) 7.3.2 Solubility of Pb2(CO3)Cl2(s) (phosgenite) 7.4 The Pb2++ SO42–system
7.5 The Pb2++ PO43–system
8. EVALUATION OF ENTHALPY DATA (HOMOGENEOUS AND HETEROGENEOUS REACTIONS)
8.1 The Pb2++ OH–system 8.2 The Pb2++ Cl–system 8.3 The Pb2++ SO42–system
9. SPECIATION IN MULTICOMPONENT SYSTEMS: Pb2++ Cl–+ CO32–+ PO43–+ SO42–
9.1 Fresh water in equilibrium with CO2(g) 9.2 Seawater and saline systems
9.3 Summary
10. QUANTITIES, SYMBOLS, AND UNITS USED IN THIS TECHNICAL REPORT 10.1 Quantities, symbols, and units
10.2 Subscripts and superscripts 10.2.1 Subscripts
10.2.2 Superscripts REFERENCES
APPENDIX 1A
Data evaluation criteria APPENDIX 1B
Competitive complex formation by medium anions APPENDIX 2
Selected equilibrium constants APPENDIX 3
SIT plots for Pb2++ L systems
1. INTRODUCTION
This review is the third in a series relevant to the speciation of heavy metal ions in environmental wa- ters of low to moderate ionic strength. It provides access to the best available equilibrium data for use in chemical speciation modeling of reactions of Pb2+with the major inorganic ligands present in envi- ronmental systems: Cl–, OH–, CO32–, SO42–, and PO43–. The previous reviews in this series were on the Hg2+[2005PBa] and Cu2+[2007PBa] complexation reactions with these ligands. Note: reference citations are based on those adopted in the IUPAC Stability Constants Database (SC-Database) [2009PET]; see further note in the Reference section. The protonation* reactions of CO32–and PO43–
were also reviewed [2005PBa]. Subsequent reviews will focus on the equilibrium reactions of the same ligands with Cd2+and Zn2+.
The first review [2005PBa] noted the need for reliable equilibrium constants, valid at ionic strengths and temperatures relevant to chemical speciation modeling of labile equilibrium reactions in natural aquatic systems. The reader is referred to [2005PBa] for (i) the nomenclature used to express stability constants βp,q,r, *βp,q,r°, Kn, and *Kn(Appendix 1A in [2005PBa]; see also Section 10), (ii) the criteria by which published data (βp,q,rand ΔrH) are “accepted” for inclusion in the critical evalua- tions, or “rejected”, (iii) the principles of the Brønsted–Guggenheim–Scatchard specific ion interaction theory (SIT) [97GRE], and (iv) the application of SIT functions [97GRE] to effect regression of “ac- cepted” values at finite ionic strengths to obtain values at Im= 0 mol kg–1(infinite dilution).
The first two reviews [2005PBa, 2007PBa] in this series outlined the procedure for converting sta- bility constants published on the amount concentration scale (mol solute/dm3solution; expressed as [species i]) to values on the molality (mol kg–1) scale, to permit the application of SIT and the regres- sion of stability constant values to obtain the standard (state) equilibrium constants valid at Im = 0 mol kg–1. The primary source of data is the SC-Database[2009PET].
For each Pb2++ ligand combination, this review will, where possible:
• identify the most reliable publications and stability constants;
• identify (and reject) unreliable stability constants;
• establish correlations between the accepted data on the basis of ionic strength dependence, using the SIT functions;
• establish Recommended values of βp,q,r°and Ks0°at 25 °C (298.15 K) andIm= 0 mol kg–1;
• identify the most reliable reaction enthalpy values ΔrHfor each equilibrium reaction;
*By common usage, the terms “proton” and “protonation” refer to the natural isotopic mixture of hydrogen, not isotopically pure
1H+. Strictly speaking, the reaction is hydronation.
• provide the user with the numerical relationships required to interpolate values of βp,q,rat Im> 0 mol kg–1;
• provide examples of SIT plots for βp,q,rextrapolations;
• provide examples of distribution diagrams for binary and multicomponent systems; and
• provide values of βp,q,rapplicable to calculations in fresh and saline water systems.
All reactions described in this document refer to aqueous solution, e.g., Pb2+(aq) + 2H2OPb(OH)2(aq) + 2H+(aq)
For simplicity, suffixes such as (aq) are not used unless a species has zero net charge, in which case the phase is specified, e.g., Pb(OH)2(aq), Pb(OH)2(s), and PbO(s). In this document, “amount concentra- tion” is abbreviated to “concentration”, the units being mol dm–3(= mol L–1, or M).
2. SUMMARY OF RECOMMENDED VALUES
Tables 1–5 provide a summary of the standard equilibrium constants (Im= 0 mol kg–1), SIT reaction ion interaction coefficients (Δε) and, where available, reaction enthalpies for the formation of Pb2+
complexes with the selected inorganic anions. These were derived from a critical evaluation of the avail- able literature, followed by regression analyses of the accepted data using SIT functions. The reader is referred to [2005PBa] for definition of the terms “Recommended” (R) and “Provisional” (P) used in these Tables. The log10βp,q,r°, log10Kn°, and log10*βp,q,r°values are for 298.15 K, 1 bar (105Pa), and infinite dilution (Im= 0 mol kg–1).
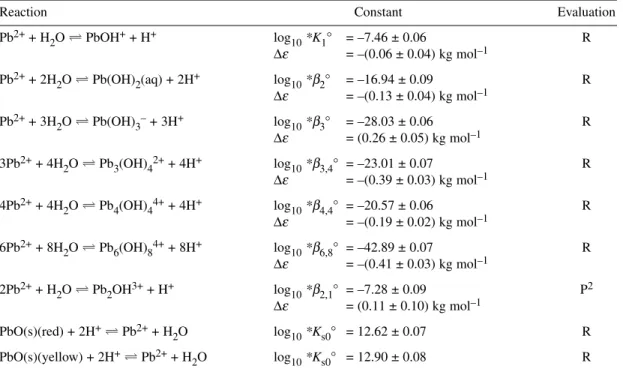
Table 1Recommended (R) values for the Pb2++ OH–system at 298.15 K, 1 bar, and Im= 0 mol kg–1. Δεvalues for NaClO4medium1.
Reaction Constant Evaluation
Pb2++ H2O PbOH++ H+ log10*K1° = –7.46 ± 0.06 R
Δε = –(0.06 ± 0.04) kg mol–1
Pb2++ 2H2O Pb(OH)2(aq) + 2H+ log10*β2° = –16.94 ± 0.09 R Δε = –(0.13 ± 0.04) kg mol–1
Pb2++ 3H2O Pb(OH)3–+ 3H+ log10*β3° = –28.03 ± 0.06 R Δε = (0.26 ± 0.05) kg mol–1
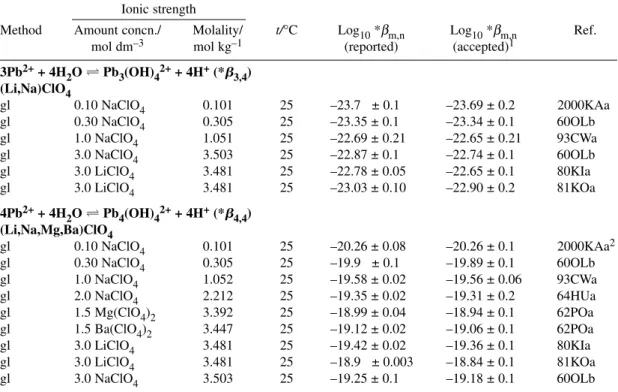
3Pb2++ 4H2OPb3(OH)42++ 4H+ log10*β3,4° = –23.01 ± 0.07 R Δε = –(0.39 ± 0.03) kg mol–1
4Pb2++ 4H2OPb4(OH)44++ 4H+ log10*β4,4° = –20.57 ± 0.06 R Δε = –(0.19 ± 0.02) kg mol–1
6Pb2++ 8H2OPb6(OH)84++ 8H+ log10*β6,8° = –42.89 ± 0.07 R Δε = –(0.41 ± 0.03) kg mol–1
2Pb2++ H2OPb2OH3++ H+ log10*β2,1° = –7.28 ± 0.09 P2 Δε = (0.11 ± 0.10) kg mol–1
PbO(s)(red) + 2H+Pb2++ H2O log10*Ks0° = 12.62 ± 0.07 R PbO(s)(yellow) + 2H+Pb2++ H2O log10*Ks0° = 12.90 ± 0.08 R
1The uncertainties represent 95 % confidence limits of the regression intercept (log10K°) and of the slope (–Δε).
2Log10*β2,1° and Δεderived from data for nitrate media.
Table 2 Recommended values (R) for the Pb2+ + Cl–system at 298.15 K and Im= 0 mol kg–1. Δεvalues for NaClO4medium.
Reaction Constant1 Evaluation
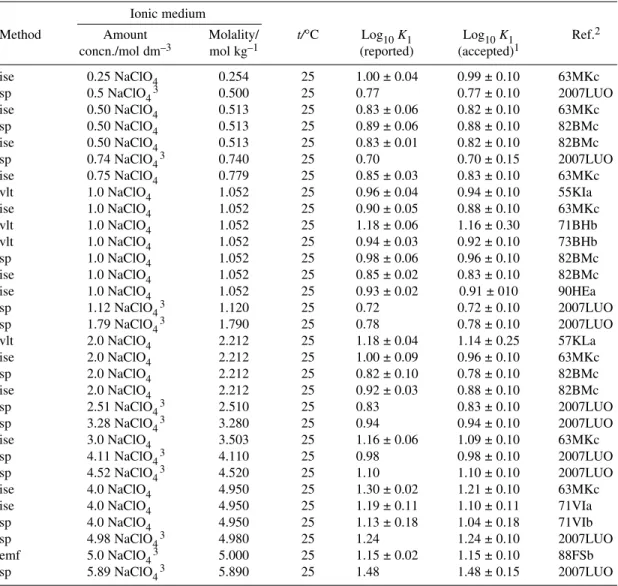
Pb2++ Cl–PbCl+ log10K1° = 1.50 ± 0.03 R
Δε = –(0.14 ± 0.01) kg mol–1
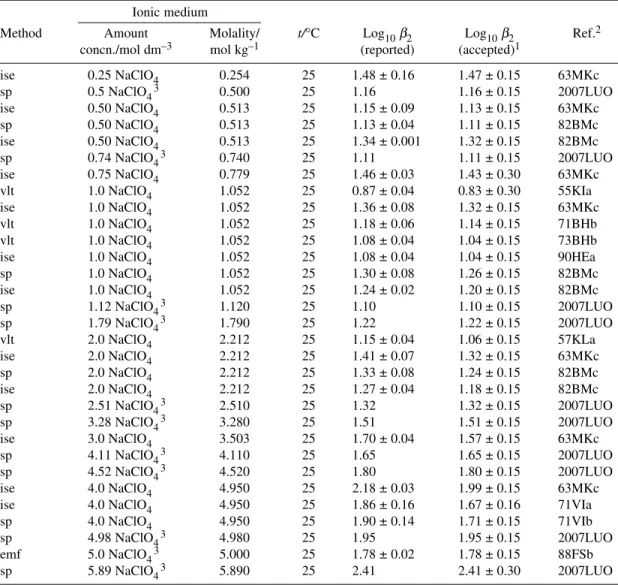
ΔrH° = (10.3 ± 1.5) kJ mol–1 P Pb2++ 2Cl–PbCl2(aq) log10β2° = 2.10 ± 0.05 R
Δε = –(0.26 ± 0.02) kg mol–1
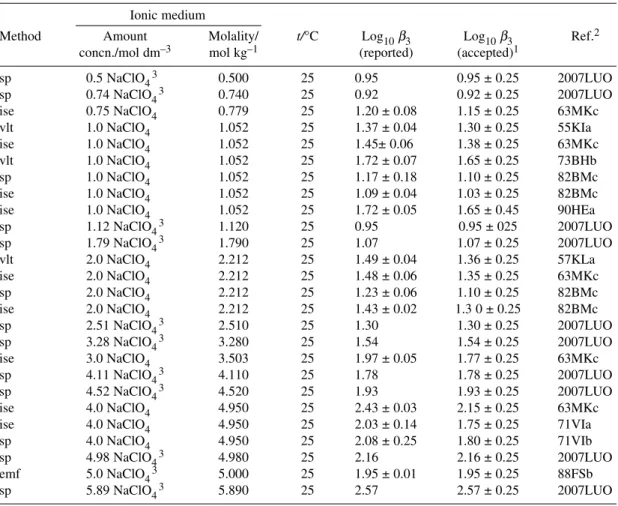
ΔrH° = (17.0 ± 0.6) kJ mol–1 P Pb2++ 3Cl–PbCl3– log10β3° = 2.00 ± 0.10 R
Δε = –(0.32 ± 0.03) kg mol–1
ΔrH° = (14.7 ± 1.0) kJ mol–1 P
1The uncertainties represent 95 % confidence limits of the regression intercept (log10K°) and of the slope (–Δε).
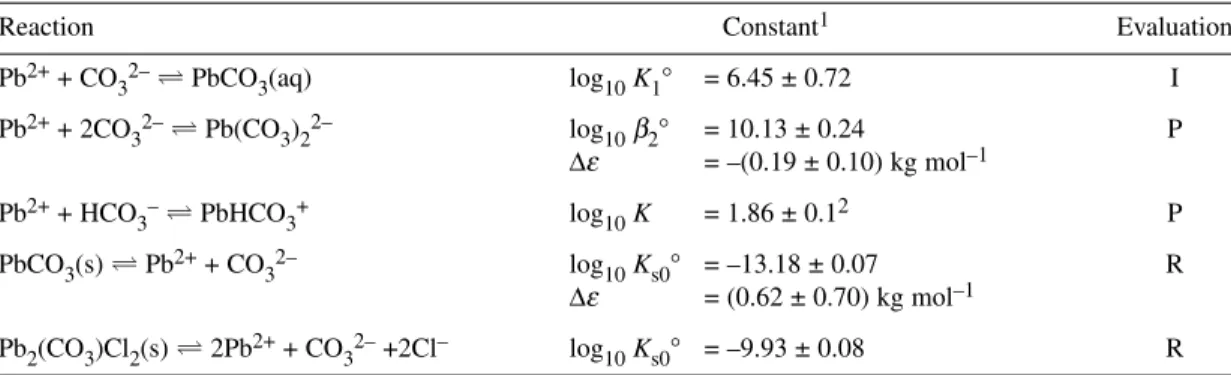
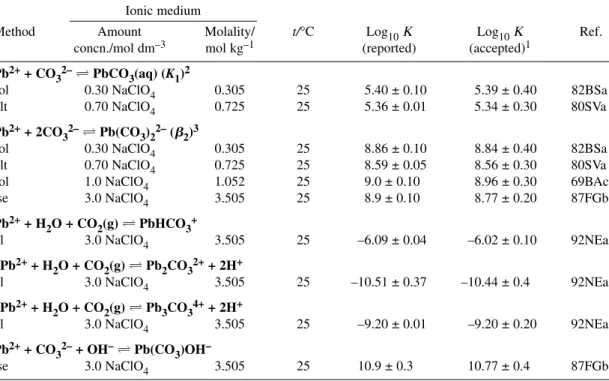
Table 3Recommended (R), Provisional (P), and Indicative (I) values for the Pb2+ + CO32–system at 298.15 K, 1 bar, and Im= 0 mol kg–1. Δεvalues for NaClO4medium.
Reaction Constant1 Evaluation
Pb2++ CO32–PbCO3(aq) log10K1° = 6.45 ± 0.72 I
Pb2++ 2CO32–Pb(CO3)22– log10β2° = 10.13 ± 0.24 P
Δε = –(0.19 ± 0.10) kg mol–1
Pb2++ HCO3–PbHCO3+ log10K = 1.86 ± 0.12 P
PbCO3(s)Pb2++ CO32– log10Ks0° = –13.18 ± 0.07 R
Δε = (0.62 ± 0.70) kg mol–1
Pb2(CO3)Cl2(s)2Pb2++ CO32–+2Cl– log10Ks0° = –9.93 ± 0.08 R
1The uncertainties represent 95 % confidence limits of the regression intercept (log10K°) and of the slope (–Δε).
2Value forIm= 3.5 mol kg–1NaClO4.
Table 4Recommended (R) values for the Pb2++ SO42–system at 298.15 K and Im= 0 mol kg–1. Δεvalues for ClO4–medium.
Reaction Constant1 Evaluation
Pb2++ SO42–PbSO4(aq) log10K1° = 2.72 ± 0.05 R Δε = (0.02 ± 0.03) kg mol–1
PbSO4(s)Pb2++ SO42– log10Ks0° = –7.80 ± 0.05 R
1The uncertainties represent 95 % confidence limits of the regression intercept (log10K°) and of the slope (–Δε).
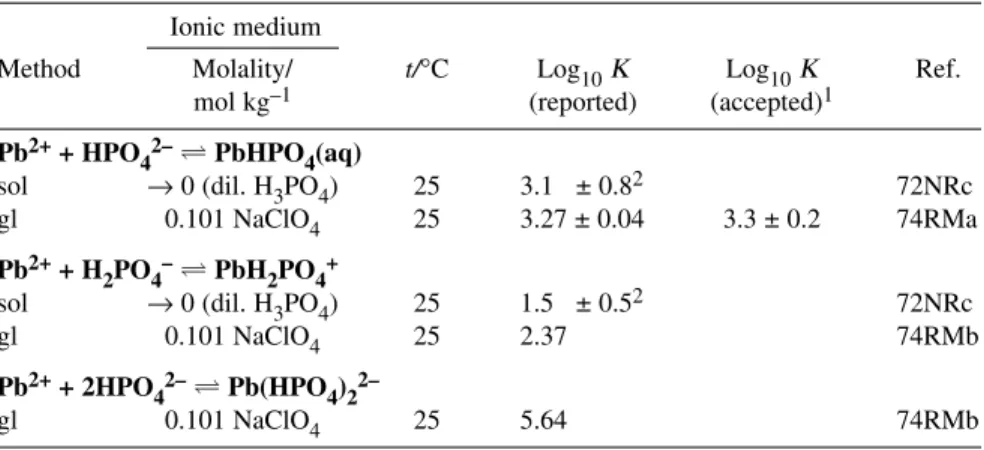
Table 5 Provisional (P) values for the Pb2++ H++ PO43–system at 298.15 K and Im= 0 mol kg–1.
Reaction Constant1 Evaluation
Pb2++ HPO42–PbHPO4(aq) log10K = 3.3 ± 0.2 P2 PbHPO4(s) Pb2++ HPO42– log10Ks0° = –11.4 ± 0.3 P Pb3(PO4)2(s) 3Pb2++ 2PO42– log10Ks0° = – 44.4 ± 1.0 P
1The uncertainties represent 95 % confidence limits of the regression intercept (log10K°) and of the slope (–Δε).
2Medium: 0.10 mol kg–1NaClO4.
3. PbIISOLUTION CHEMISTRY
In aqueous solution, lead occurs in two oxidation states: PbII, the dominant form under most conditions, and PbIV. Diagrams of pH-potential boundaries indicate that PbIVis stable in aqueous solution only as the mixed PbII/PbIVoxide mineral minium, Pb3O4(s), and as plattnerite, PbO2(s); these exist to appre- ciable extents only over narrow pH domains in strongly alkaline solutions [2001BRO]. Analogous to Cu2+, but in contrast to Hg2+[2005PBa], the onset of the Pb2+hydrolysis reactions occurs at about pH 5 in dilute (<1 × 10⁻³ mol dm–3) solution. At total (subscript T) PbII concentrations [PbII]T < 5 × 10⁻⁶ mol dm–3 (<1 mg dm–3), the dominant hydrolysis species that form in aqueous solution are monomeric PbOH+, Pb(OH)2(aq), and Pb(OH)3–. Higher-order monomeric species Pb(OH)42– and Pb(OH)64–have been postulated at pH > 13 [89FSb] but remain controversial [2001PHa].
At [PbII]T> 5 × 10⁻⁶mol dm–3(>1 mg dm–3, a condition atypical of environmental systems) a number of polymeric species form. With increasing [PbII]T, the dominant species are Pb3(OH)42+
(at 50 × 10–6mol dm–3), Pb4(OH)44+, and Pb6(OH)84+(at 1 × 10⁻³mol dm–3). At very high PbIIcon- centrations (>0.5 mol dm–3), Pb2(OH)3+is reported [80SBa]. Note that none of these species will play a significant role at the submicromol/dm3concentrations of PbII typical of environmental fresh and saline waters. Other species such as Pb3(OH)33+[80KIa] and Pb3(OH)5+[80SBa, 93CWa] have been postulated under various conditions but lack supporting evidence.
Heterogeneous solubility equilibria are unlikely to have a significant impact on the chemical spe- ciation of PbII, except possibly in heavily polluted natural water systems (which are not under consid- eration in this document). Low [Pb2+] values may arise from other “mixed ligand” compounds, but none of these phases (and corresponding solubility) has been sufficiently well characterized, especially under typical environmental conditions, to justify their consideration in the present speciation calculations.
Where relevant, they are mentioned in the appropriate parts of Section 7.
4. DATA SELECTION AND EVALUATION
The data that meet our selection criteria for use in the SIT regression analyses are recorded in Tables A2-1 through A2-16 in Appendix 2. The criteria used for the acceptance of literature data as re- liable (designated “reported” in these Tables, and included in the regression analysis) and those for the rejection of data (indicated by a reference superscript in the Table footnotes) are summarized in Appendix 1A. The values for log10Kn(reported) are given on the molality (mol kg–1) or amount con- centration (mol dm–3) scales, as published. In most cases, the uncertainties assigned to log10Kn(re- ported) by the original authors reflect analytical and numerical precision but not systematic errors.
Some log10Kn(reported) values have much stronger experimental bases than others, being derived from a large amount of experimental data and/or from more than one experimental method. In determining the value of log10Kn(accepted) for inclusion in the regression analysis, we therefore assign an addi-
tional uncertainty to each value of log10Kn(reported) that reflects our estimation of accuracy and reli- ability of the experimental methods, according to [92GRE, Appendix C], and consistent with a 95 % confidence limit. The log10Kn(accepted) values are listed in the Tables on the molality scale (to facil- itate SIT analysis); our assigned uncertainty is used to weight each constant in the SIT regression analy- sis [2005PBa].
The abbreviations used in these Tables to describe the experimental methods are: emf: measure- ment of galvanic cell potentials (emf) using a redox electrode; sol: solubility determination; gl: pH measurement by glass electrode; con: conductivity;ise: measurement of cell potentials using an ion-se- lective electrode; cal: calorimetry;vlt: voltammetry; pol: polarography; sp: (UV–vis) spectrometry.
5. METHODS FOR NUMERICAL EXTRAPOLATION OF DATA TOIm= 0 mol kg–1
To obtain the most reliable values for βp,q,r°, the accepted data for a wide range of ionic strengths were extrapolated to Im= 0 mol kg–1by application of the Brønsted–Guggenheim–Scatchard SIT model.
This model accounts for the ionic strength-dependent short-range, weak, non-electrostatic interactions that occur between the reactant species and the electrolyte anions or cations.
For the general reaction (omitting charges except for that of H+) pM + qL + rH2O MpLq(OH)r+ rH+
the formation constant βp,q,rdetermined in an ionic medium (typically containing a noncomplexing 1:1 electrolyte NX of ionic strength Imat concentrations well in excess of the interacting ionic species) is related to the corresponding value at zero ionic strength, βp,q,r°, by
log10βp,q,r= log10βp,q,r°+ plog10γm(M) + qlog10γm(L) + rlog10a(H2O) –
log10γm(p,q,r) – rlog10γm(H+) (1)
where γm(p,q,r) and γm(i) refer respectively to the activity coefficient on the molality scale for the species MpLq(OH)rand for the interacting species i. According to the SIT, the latter is given [97GRE]
by
log10γm(i) = –zi2A√Im(1 + ajB√Im)–1+ Σkε(i,k) mk= –zi2D+ Σkε(i,k) mk (2) where k = N+or X–and ε(i,k) is the aqueous species interaction (SIT) coefficient for short-range inter- actions between ions iand k.
Substitution of (2) into (1), and for conditions such that Im≈mk, gives
log10βp,q,r–Δz2D –rlog10a(H2O) = log10βp,q,r°–ΔεIm (3) where Δz2= (pzM+ qzL– r)2+ r – p(zM)2– q(zL)2and Δε= ε(complex, N+or X–) + rε(H+,X–) –pε (Mn+,X–) –qε(Lm–,N+) is the reaction-specific ion interaction coefficient.
Wherever possible in this review, to maintain thermodynamic consistency among the various con- stants, the term ajB is set at 1.5 kg1/2 mol–1/2, the value found by Scatchard to minimize the ionic strength dependence of derived ε(i,k) values [76SCA]. For a 1:1 electrolyte, the term log10a(H2O) can be calculated from the solution osmotic coefficient, ⌽m[59ROB]. For NaClO4media, the relationship log10a(H2O) = –(0.01484 ± 0.00018) (Im/mol kg–1) pertains at 25 °C and 0 ≤ Im/mol kg–1≤ 3.5 where the uncertainty pertains to the 95 % confidence limits; it is noted that this relationship is a correction from that reported in [2005PBa, 2007PBa].
The application of SIT to the accepted literature values (Tables A2-1 to A2-14) involves extrap- olation of log10βp,q,r– Δz2D – rlog10a(H2O) to mk(or Im) = 0 mol kg–1for a system with a large ex- cess of 1:1 electrolyte, using eq. 3. In the SIT regression analyses, the weighting of each datum point was 1/u2where uis the assigned uncertainty for each value (Tables A2-1 to A2-14). The regression analyses (shown in Appendix 3) yield log10βp,q,r° (log10Kn°) as the intercept at Im= 0 mol kg–1and the reaction-specific ion interaction coefficient, –Δε(i,k), as the slope. The uncertainties reported for
log10βp,q,r° (log10Kn°) and Δεrepresent 95 % confidence limits of the regression intercept and slope, respectively. Where appropriate, an initial SIT analysis was used to identify (and reject) outliers based on their deviation from the calculated confidence limits. The data used in the regression analyses to ob- tain values for log10βp,q,r° (log10Kn°) are for perchlorate media [predominantly NaClO4but also for LiClO4and (Li,Na,Mg,Ba)ClO4], except for Pb2OH for which accepted values are available only in ni- trate media. For PbOH+and Pb4(OH)44+, there are also a significant number of values for nitrate media, and for Pb3(OH)42+and Pb6(OH)84+, there are two values that meet our selection criteria. SIT analyses for nitrate media are discussed separately in Section 6.1.4.
6. EVALUATION OF EQUILIBRIUM CONSTANTS (HOMOGENEOUS REACTIONS) 6.1 The Pb2++ OH–system
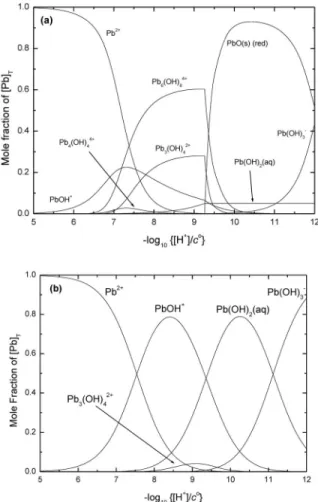
Speciation diagrams for the Pb2++ OH–system, based on our Recommended values recorded in Table 1 for stability constants at Im= 0 mol kg–1, are shown in Figs. 1a and 1b for [PbII]T= 4.8 × 10⁻⁴mol dm–3
Fig. 1Speciation diagram for the binary Pb2++ hydroxide system as obtained from the Recommended stability constants at Im= 0 mol kg–1(Table 1). Results outside the –log10{[H+]/c°} range of 2–12 should be viewed with caution as activity coefficients deviate from 1.0. (No corrections were made for ionic strength-dependent changes in formation constants at high pH.) (a) [PbII]T= 4.8 × 10⁻⁴mol dm–3(100 mg Pb dm–3); (b) [PbII]T= 4.8 × 10⁻⁶ mol dm–3(1 mg Pb dm–3).
(100 mg Pb dm–3) and [PbII]T= 4.8 × 10⁻⁶mol dm–3([PbII]T= 1 mg dm–3), respectively. Results out- side the range 2 ≤ –log10{[H+]/c°} ≤ 12 should be viewed with caution as activity coefficients may de- viate significantly from 1.0. The SC-Database[2009PET] reports results from 62 investigations for the hydrolysis of Pb2+.
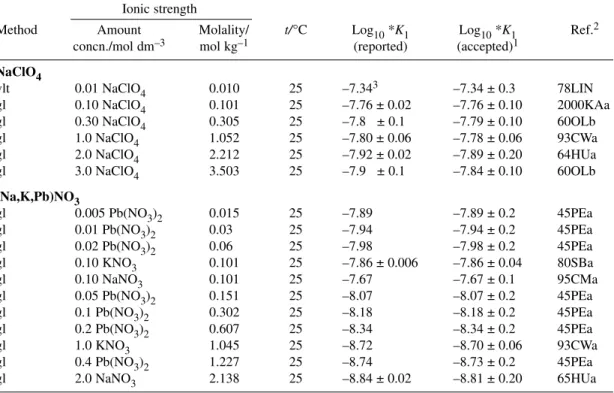
6.1.1 Formation of PbOH+
Formation of the first monomeric hydrolysis species can be described by eq. 4
Pb2++ H2O PbOH++ H+ (4)
Data selected for the SIT analysis, to determine the stability constant at zero ionic strength and the re- action interaction coefficient, Δε(4), were for perchlorate media at 25 °C and are listed in Table A2-1, along with references and our assigned uncertainties. The weighted regression of these data (Fig. A3-1) used the expression
log10*K1+ 2D – log10a(H2O) = log10*K1°–ΔεIm
derived from eqs. 3 and 4 (Δz2= –2). The regression yields the Recommended value log10*K1°(eq. 4, 298.15 K) = –7.46 ± 0.06
The value for Δε(4) in NaClO4medium is –(0.06 ± 0.04) kg mol–1. 6.1.2 Formation of Pb(OH)n(2–n)+, n = 2, 3, 4
Pb(OH)2(aq)
The formation of Pb(OH)2(aq) can be described by reaction 5
Pb2++ 2H2O Pb(OH)2(aq) + 2H+ (5)
Data selected for the SIT analysis, to determine the stability constant at zero ionic strength and the re- action ion interaction coefficient, Δε(5), are listed in Table A2-2, along with references and our assigned uncertainties. The selected values for perchlorate media at 25 °C make a rather limited data set. The weighted regression (Fig. A3-2) used the expression
log10*β2+ 2D – 2 log10a(H2O) = log10*β2°– ΔεIm
derived from eqs. 3 and 5 (Δz2= –2). The regression yields the Recommended value log10*β2°(eq. 5, 298.15 K) = –16.94 ± 0.09
The calculated value for Δε(5) in NaClO4medium is –(0.13 ± 0.04) kg mol–1. Pb(OH)3–, Pb(OH)42–, and Pb(OH)64–
The formation of Pb(OH)3–is most frequently reported in the literature in terms of reaction 6
Pb2++ 3OH–Pb(OH)3– (6)
Data selected for the SIT analysis, to determine the stability constant at zero ionic strength and the re- action ion interaction coefficient, Δε(6), are listed in Table A2-3, along with references and our assigned uncertainties. The weighted regression (Fig. A3-3), using the selected values for NaClO4media at 25 °C and the expression
log10β3+ 6D= log10β3°– ΔεIm
indicates good consistency among the accepted data and gave the Recommended value log10β3°(eq. 6, 298.15 K) = 13.97 ± 0.06
The calculated value for the reaction ion interaction coefficient is Δε(6) = –(0.28 ± 0.02) kg mol–1.
The formation of Pb(OH)3–can also be defined by reaction 7
Pb2++ 3H2O Pb(OH)3–+ 3H+ (7)
for which we derive the Recommended value log10*β3°(eq. 7, 298.15 K) = –(28.03 ± 0.06)
and the reaction ion interaction coefficient Δε(7) = 0.26 ± 0.05 kg mol–1in NaClO4media.
Stability constant data have been reported by [89FSb] for the formation of the species Pb(OH)42– (log10β4= 13.26 ± 0.06, Im= 5.0 mol kg–1) and Pb(OH)64–(log10β6= 12.18 ± 0.06, Im= 5.0 mol kg–1) at pH > 13. Perera and Hefter [2001PHa] noted the experimental and theoretical difficulties as- sociated with these measurements at high pH in a cell without liquid junction, and also noted that there is no spectroscopic or polarographic evidence for the existence of Pb(OH)64–. Thus, these stability con- stant values are considered as doubtful, and the formation of Pb(OH)62–extremely doubtful.
Perera et al. [2001PH] studied the hydrolysis equilibria of Pb2+by the spectrophotometric method at 25 °C, using total lead concentrations under 10 μmol dm–3in 1 and 5 mol dm–3NaClO4. At these low lead concentrations they found evidence for the monomeric species PbOH+to Pb(OH)42–but no evidence for polymeric species (Section 6.1.3). Unfortunately, their stability constants disagree with the values accepted in Tables A2-1 to A2-3, differing by about 0.6 log units per hydroxide ion in each re- spective species, and thus have not been included in the present review.
6.1.3 Formation of Pb3(OH)42+, Pb4(OH)44+, and Pb6(OH)84+
The formation of polymeric hydrolysis products in perchlorate media has been extensively studied by Olin et al. using very careful potentiometric [60OLb, 60OLc, 62POa], calorimetric [62COa], and X-ray diffraction studies [68JOH]. Their work indicated very small differences in the magnitude of the re- spective PbIIhydrolysis constants in 3 mol dm–3NaClO4[60OLb, 60OLc, 62POa] and 1.5 mol dm–3 magnesium or barium perchlorate media [62POa] (all 3 mol dm–3in perchlorate). In each system, be- fore the onset of precipitation, the hydrolysis reactions involve the formation of cationic or neutral species only. Therefore, within the confines of SIT, the interaction coefficients will involve only the cationic lead hydrolysis species and the medium anion (in this case, perchlorate).
X-ray diffraction [68JOH] studies confirm the existence of the species Pb4(OH)44+ and Pb6(OH)84+in aqueous solution. The analysis indicates a tetrahedral core of lead atoms in Pb4(OH)44+, with each hydroxide ion bound to three lead atoms. The same core occurs in Pb6(OH)84+, with the two additional lead atoms bound to adjacent faces of the tetrahedron, each forming a tetragonal pyramid with three lead atoms of the core. This interpretation is supported by the solid-state analysis of lead per- chlorate compounds [72OLI].
More recently, Japanese workers have studied the formation of polymeric PbIIhydrolysis prod- ucts [80KIa, 81KOa, 2000KAa]. The first two studies utilized 3 mol dm–3LiClO4as the ionic medium, whereas the latter used 0.1 mol dm–3NaClO4. The resultant log10*βp,rvalues are in good agreement with those reported by Olin et al. However, [80KIa] also postulated the formation of Pb3(OH)33+; this species has not been reported in any other study and, as such, its formation is considered doubtful.
Kogure et al. [81KOa] examined the hydrolysis reactions at relatively high PbIIconcentrations in both water and deuterated water and found that the same polymeric species occur in both media.
Pb3(OH)42+
Formation of the trimeric hydrolysis species can be described by reaction 8
3Pb2++ 4H2O Pb3(OH)42++ 4H+ (8)
Data selected for the SIT analysis, to determine the stability constant at zero ionic strength and the re- action ion interaction coefficient, Δε(8), refer to perchlorate media (NaClO4and LiClO4) at 25 °C and
are listed in Table A2-4, along with references and our assigned uncertainties. A weighted regression for these data (Fig. A3-4) used the expression
log10*β3,4+ 4D – 4 log10a(H2O) = log10*β3,4°–ΔεIm
derived from eqs. 3 and 8 (Δz2= –4). The intercept yields the Recommended value log10*β3,4°(eq. 8, 298.15 K) = –23.01 ± 0.07
Figure A3-4 indicates reasonable consistency among the stability constants measured in sodium and lithium perchlorate solutions. The value for Δε(8) in perchlorate media is –(0.39 ± 0.03) kg mol–1.
Figure 1b illustrates that the maximum concentration of the polymeric species Pb3(OH)42+ac- counts for less than 5 % of total lead at 10 μmol dm–3and I= 0 mol kg–1. However, the percentage of total lead present as this species varies with ionic strength and is ca. 22 % at Ic = 1.0 mol dm–3and [PbII]T= 10 μmol dm–3.
Pb4(OH)44+
Formation of the tetrameric hydrolysis species can be described by reaction 9
4Pb2++ 4H2O Pb4(OH)44++ 4H+ (9)
Data selected for the SIT analysis, to determine the stability constant at zero ionic strength and the re- action ion interaction coefficient, Δε(9), refer to perchlorate media [NaClO4, LiClO4, and (Mg,Ca)(ClO4)2] at 25 °C and are listed in Table A2-4, along with references and our assigned uncer- tainties. A weighted regression for these data (Fig. A3-5) used the expression
log10*β4,4– 4D – 4 log10a(H2O) = log10*β4,4°–ΔεIm
derived from eqs. 3 and 9 (Δz2= 4). The intercept yields the Recommended value log10*β4,4°(eq. 9, 298.15 K) = –20.57 ± 0.06
As shown in Table A2-4, the effect of the medium cation (Na+, Li+, Mg2+, or Ba2+) on the magnitude of this stability constant in perchlorate media is minimal; this is not surprising given that all ions in re- action 9 are cations which, according to SIT, should have no effect on the equilibrium constant. The value derived for Δε(9) in perchlorate media is –(0.19 ± 0.02) kg mol–1.
For the formation of Pb4(OH)44+, a significant number of data in nitrate media also meet our cri- teria for selection; these data are discussed in Section 6.1.4.
Pb6(OH)82+
Formation of the hexameric hydrolysis species is described by reaction 10
6Pb2++ 8H2O Pb6(OH)84++ 8H+ (10)
Data selected for the SIT analysis, to determine the stability constant at zero ionic strength and the re- action ion interaction coefficient, Δε(10), refer to perchlorate media (NaClO4and LiClO4) at 25 °C and are listed in Table A2-4, along with references and our assigned uncertainties. A weighted regression for these data (Fig. A3-6) used the expression
log10*β6,8– 8 log10a(H2O) = log10*β6,8°–ΔεIm
derived from eqs. 3 and 10 (Δz2= 0). The regression intercept yields the Recommended value log10*β6,8°(eq. 10, 298.15 K) = –42.89 ± 0.07
The value derived for Δε(10) in perchlorate media is –(0.41 ± 0.03) kg mol–1.
6.1.4 Formation in nitrate media Pb2OH3+
Formation of the dimeric hydrolysis species is described by reaction 11
2Pb2++ H2O Pb2OH3++ H+ (11)
Data selected for the SIT analysis, to determine the stability constant at zero ionic strength and the re- action ion interaction coefficient, Δε(11), are listed in Table A2-4, along with references and our as- signed uncertainties. The selected data refer only to nitrate media at 25 °C. The weighted regression (Fig. A3-7) for the selected values used the expression
log10*β2,1– 2D– log10a(H2O) = log10*β2,1°–ΔεIm
derived from eqs. 3 and 11 (Δz2= 2). The regression yields the Provisional value:
log10*β2,1°(eq. 11, 298.15 K) = –7.28 ± 0.09
The value derived for Δε(11) in nitrate media is (0.11 ± 0.10) kg mol–1. This species only forms to a relatively small percentage at elevated PbIIconcentrations and is unlikely to be an important species in the environment.
PbOH+
A weighted regression analysis based on the data for (Na,K,Pb)NO3 media at 25 °C (Table A2-4) yielded a stability constant at zero ionic strength log10*K1°(eq. 4, 298.15 K) = –7.61 ± 0.04. This value contrasts with that derived from data for perchlorate media (log10*K1°= –7.46 ± 0.06). The data pub- lished for nitrate media were not corrected for nitrate complexation, although this should not impact significantly on the stability constant calculated for zero ionic strength, as the term for the effect of ni- trate complexation tends to unity as Im→0 (eq. B-7, Appendix 1B). The derived reaction ion inter - action coefficient, Δε(4) = (0.50 ± 0.07) kg mol–1can be used to interpolate apparent stability constants applicable in nitrate media, but cannot be used to calculate individual species interaction coefficients in nitrate media because the contributing log10*K1values have not been corrected for nitrate complexa- tion.
The discrepancies between the stability constants obtained at zero ionic strength from values in nitrate media and perchlorate media, for both this species and Pb4(OH)44+(below), may be due to the large number of nitrate media data that are derived from use of the self-medium method. Comparison of these data with those obtained in either NaNO3 or KNO3alone show statistical differences, with those obtained using the self-medium method being more negative when differences in ionic strength have been considered. These differences are consistent with the more negative stability constants ob- tained at zero ionic strength for both PbOH+and Pb4(OH)44+.
Pb4(OH)44+
A weighted regression analysis based on the data for (Na,K,Pb)NO3 media at 25 °C (Table A2-4) yielded a stability constant at zero ionic strength log10*β4,4°(eq. 9, 298.15 K) = –20.79 ± 0.04. This value also contrasts with that derived from data for perchlorate media (log10*β4,4°= –20.57 ± 0.06).
The value derived for Δε(9) in nitrate media is (0.90 ± 0.07) kg mol–1. Pb3(OH)42+and Pb6(OH)84+
For Pb3(OH)42+, two values published for KNO3media at 25 °C meet our selection criteria. The val- ues are log10*β3,4= –23.91 ± 0.02 (Im= 0.101 mol kg–1[80SBa]) and log10*β3,4= –24.3 ± 0.02 (Im= 1.045 mol kg–1[90CWa]). Similarly, for Pb6(OH)84+two values published for KNO3media at 25°C meet our selection criteria, viz. log10 *β6,8 = –43.38 ± 0.01 (Im = 0.101 mol kg–1 [80SBa]) and log10*β6,8= –44.91 (Im= 1.045 mol kg–1[90CWa]). In neither case is there sufficient data for a SIT regression analysis.
6.2 The Pb2++ Cl–system
PbIIappears to form up to four consecutive chlorido- complexes in aqueous solution, reactions 12–15
Pb2++ Cl–PbCl+ (12)
Pb2++ 2Cl–PbCl2(aq) (13)
Pb2++ 3Cl–PbCl3– (14)
Pb2++ 4Cl–PbCl42– (15)
These reactions have been widely studied, there being 112 entries in the SC-Database [2009PET].
Analogous to the Cu2++ Cl–system, the complexes are all weak and are best studied in media of high [Cl–]T, high [Cl–]T: [PbII]Tratios, and high ionic strength. The stability constants have been investigated by voltammetry (vlt), ion-selective electrode (ise) and other types of potentiometry, and by UV–vis spectrometric measurements (sp). No polynuclear complexes have been reported in aqueous solution.
The Recommended values for the stability constants at Im= 0 mol kg–1are given in Table 2.
6.2.1 Formation of PbCl+
A substantial number of equilibrium constant values have been reported for the formation of PbCl+, for different media (NaClO4, LiClO4, HClO4, NaCl), ionic strengths and temperatures. Data selected for the SIT analysis, to determine the standard stability constant at zero ionic strength for reaction 12 and the reaction ion interaction coefficient Δε, are listed in Table A2-5, along with our assigned uncertain- ties according to our estimate of the overall precision of the data. For this evaluation the selected data all refer to NaClO4media and 25 °C, but no significant differences can be observed for data determined in other perchlorate media.
The weighted linear regression (Fig. A3-8), which indicates reasonable consistency between the values, leads to the Recommended standard constant
log10K1°(eq. 12, 298.15 K) = 1.50 ± 0.03
The reaction ion interaction coefficient based on this regression is Δε(12) = –(0.14 ± 0.01) kg mol–1. The Recommended value of log10K1° is in good agreement with those of [2007LUO] [1.45 ± 0.02;
from measurements in NaClO4(Im= 0.38 to 5.89 mol kg–1) and NaCl (Im= 0.08 to 0.32 mol kg–1)], [84MBc] (1.48 ± 0.05; based on measurements of [84BMb] in NaCl/NaClO4, Im= 0.38 to 5.89 mol kg–1) and [84SEa] (1.41 ± 0.05; from measurements in NaCl, Im= 0.001 to 3.22 mol kg–1).
Results from several studies in NaClO4at 25 °C were rejected, as indicated in the footnote to Table A2-5 with annotations on each reference. In the case of [73VIa], the log10K1values are given as a function of [Cl–]T; [74MId] reported constants calculated using a mathematical model, rather than based on experimental determinations; in [76FSa, 87KSd] the quality of the data could not be judged, because an English translation was not available; the values of [66VSa] were later corrected for liquid junction potentials and reported by [71VIa].
6.2.2 Formation of PbCl2(aq)
Data selected for the SIT analysis, to determine the stability constant at zero ionic strength and the re- action ion interaction coefficient Δε(13), are listed in Table A2-6, along with our assigned uncertainties.
The selected data all refer to NaClO4media and 25 °C. The uncertainties assigned to log10β2in this review are slightly larger than those assigned to log10K1to reflect the weakness of the 1:2 complex.
The weighted linear regression (Fig. A3-9) indicates reasonable consistency between the values and yields the Recommended standard constant
log10β2°(eq. 13, 298.15 K) = 2.10 ± 0.05