ARTICLE
DOI: 10.1002/zaac.201400058
LiSbS
2-mC16: Structure Determination from X-ray Powder Diffraction Data
Sebastian Huber
[a]and Arno Pfitzner*
[a]Dedicated to Professor Heinz Dieter Lutz on the Occasion of His 80th Birthday
Keywords:Antimony; Lithium; Sulfur; Powder diffraction; Rietveld method Abstract.Monoclinic LiSbS2-mC16 was synthesized by solid-state re-
action of Li2S, Sb, and S in the ratio 1:2:5 at a temperature of 900 °C.
The excess of sulfur serves as a kind of flux and is not incorporated in the structure. The product is air and moisture sensitive. The crystal structure of the dark red product was determined from X-ray powder diffraction data at 293 K. LiSbS2-mC16 crystallizes in the space group C2/c(no. 15) witha= 8.0205(8) Å,b= 7.9243(8) Å,c= 6.6987(7) Å, β = 126.303(6)°,V= 343.11(7) Å3, andZ = 4. It forms an ordered
Introduction
The phase diagram of Li2S and Sb2S3 was first described 1983 by Olivier-Fourcade et al.[1,2] Two interesting com- pounds in this system are MI3PnQ3 (Li3SbS3) and MIPnQ2 (LiSbS2) since especially for the Li rich composition an en- hanced ion conductivity is observed.[3] MI(alkali metal, cop- per, or silver) as well asPn(pnicogen) andQ(chalcogen) can be substituted for both formula types. So a whole variety of compounds results with similar structural motifs in all substi- tuted compounds. TheMI3PnQ3compounds show interesting physical properties. Li3SbS3,[3] Na3SbS3,[4,5] and Na3SbSe3[6]
are good ion conductors with a specific conductivity of σ = 5.4⫻10–5Ω–1·cm–1 at 573 K (Li3SbS3). The copper com- pounds Cu3SbS3[7–10]and Cu3SbSe3[11]are interesting thermo- electric materials,[12,13]and Ag3SbS3[14]is a piezo-electric ion conductor with a specific conductivity ofσ= 5⫻10–2Ω–1·cm–1 at 473 K.[15,16] Most of the heavier homologous compounds are also structurally characterized, i.e., K3SbS3,[5]K3SbSe3,[17]
Rb3SbSe3,[17] Cs3SbSe3,[17] Li3AsS3,[3,18] Na3AsS3,[5,19]
Na3AsSe3,[20] K3AsS3,[5] K3AsSe3,[20] K3BiSe3,[21,22]
Rb3BiSe3,[21,22] Cs3BiSe3,[21,22] Ag3AsS3,[23,24] and Ag3AsSe3.[25–27]MIPnQ2withPn= Sb andQ= S show inter- esting crystal chemical features. Both AgSbS2 and NaSbS2 crystallize in two different modifications, a cubic one (cF8)
* Prof. Dr. A. Pfitzner Fax: +49-941-943-814551
E-Mail: arno.pfitzner@chemie.uni-regensburg.de [a] Institut für Anorganische Chemie
Universität Regensburg Universitätsstraße 31 93040 Regensburg, Germany
Supporting information for this article is available on the WWW underhttp://dx.doi.org/10.1002/zaac.201400058or from the au- thor.
© 2014 WILEY-VCH Verlag GmbH & Co. KGaA, Weinheim Z. Anorg. Allg. Chem.2014,640, (8-9),1596–1599 1596
NaCl type superstructure, which shows two different sites for the cations, whereas the cubic high temperature modificationcF8 exhibits only one position with a mixed occupation by lithium and antimony.
Lithium has a slightly distorted octahedral coordination by sulfur. The distortion of the octahedral coordination polyhedron is much stronger in the case of antimony. Therefore it is better described as a 2 + 2 + 2 coordination mode.
with rock salt structure type and disorder ofMIand Sb (space groupFm3¯m) at high temperature,[28,29]and a monoclinic one [mC16 (MI= Na),mC32 (MI= Ag)] with an ordered distribu- tion of the cations (space group C2/c) at ambient tempera- ture.[29,30] To date KSbS2 is known only in the monoclinic form with space group C2/c.[31] Further MIPnQ2 type com- pounds, which crystallize in the rock salt structure type and disorder of MI and Pn are LiSbSe2,[32] NaSbSe2,[33]
LiAsSe2,[34] NaAsSe2,[33] LiBiS2,[35] NaBiS2,[35] KBiS2,[35]
NaBiSe2,[36]and KBiSe2.[36]In contrast, three different modifi- cations (α-, β-, γ-LiSbS2) are reported in the case of LiSbS2.[1,2]β-LiSbS2was reported to crystallize in an ordered NaCl type superstructure in the rhombohedral space groupR3¯, whereas γ-LiSbS2 is isotypic with NaSbS2-cF8 (rock salt structure type). Forα-LiSbS2 only a monoclinic cell without any structure details was reported.[1] All MISbS2 compounds listed above crystallize either in space group Fm3¯m with a perfect rock salt structure type (MIPnQ2-cF8) and only one cation position with mixed occupation by MIand Sb, or in a fully ordered rock salt superstructure type (MIPnQ2-mC16 or -32) with two or even three (MI= Ag) different cation sites and no mixed occupation. We will consequently use the Pearson symbols instead of Greek letters in order to avoid any confu- sion.
Herein we report on the synthesis and on the structure deter- mination of LiSbS2-mC16 from X-ray powder diffraction data.
Results and Discussion
Structure Determination
The crystal structure of LiSbS2-mC16 was determined from X-ray diffraction data of a microcrystalline powder. Crystallo-
LiSbS2-mC16: Structure Determination from X-ray Powder Diffraction Data
graphic data are summarized in Table 1. Atomic coordinates and isotropic displacement parameters are collected in Table 2.
Table 3 lists the anisotropic displacement parameters of anti- mony and sulfur, and Table 4 shows selected interatomic dis- tances.
Structure Determination from X-ray Powder Diffraction Data
The crystal structure of LiSbS2-mC16 was determined from X-ray powder diffraction with JANA2006.[37]The profile re- finement was done by the le Bail algorithm. Background was Table 1. Crystallographic data for the structure analysis of LiSbS2-mC16.
LiSbS2
Formula weight/g·mol–1 192.8
Color dark red
Crystal system monoclinic
Space group C2/c(No. 15)
Lattice constants from X-ray powder data
a/Å 8.0205(8)
b/Å 7.9243(8)
c/Å 6.6987(7)
β/° 126.303(6) °
Cell volume /Å3,Z 343.11(7), 4
Densityρcalc/g·cm–3 3.7313
Diffractometer STOE STADI P
Mythen 1 K, Mo-Kα1
λ= 0.70926 Å Absorption coefficientμ(Mo-Kα1) /mm–1 8.937
Temperature /°C 20
2θrange /° 2.000ⱕ2θⱕ73.985
Step width2θ/° 0.015
No. of measured points 4800
No. of parameters, constraints 33, 1
Program JANA2006[37]
Profile function Pseudo-Voigt
Background function Legendre polynomial 3.
order
FinalRp,wRp, expectedwRp 0.0540, 0.0721, 0.0346 FinalR/wR(obs. reflections) 0.0369, 0.0345 FinalR/wR(all reflections) 0.0488, 0.0389
GooF 2.09
Largest difference peakΔρmaxand hole 0.55, –0.70 Δρmin/e·Å–3
Table 2.Atomic coordinates and equivalent isotropic displacement pa- rametersUeq/Å2for LiSbS2-mC16.
Atom Wyckoff x y z Ueqa)
Sb 4e 0 0.358(1) 1/4 0.015(3)
S 8f 0.777(2) 0.154(3) 0.262(2) 0.017(9)
Li 4e 0 0.12(3) 3/4 0.03b)
a)Ueqis defined as one third of the trace of the orthogonalizedUij
tensor. b)Uiso(Li) is fixed during refinement.
Table 3.Anisotropic displacement parametersUij/Å2for LiSbS2-mC16.
Atom U11 U22 U33 U23 U13 U12
Sb 0.013(3) 0.012(4) 0.017(3) 0 0.009(3) 0
S 0.019(9) 0.02(1) 0.016(8) –0.01(1) 0.010(8) –0.004(9)
Z. Anorg. Allg. Chem.2014, 1596–1599 © 2014 WILEY-VCH Verlag GmbH & Co. KGaA, Weinheim www.zaac.wiley-vch.de 1597 Table 4.Selected interatomic distances /Å for LiSbS2-mC16.
Sb–S 2⫻ 2.45(2)
2⫻ 2.77(1)
2⫻ 3.20(2)
Li–S 2⫻ 2.65(2)
2⫻ 2.8(2)
2⫻ 2.9(2)
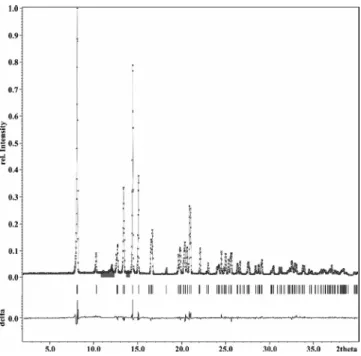
corrected by a Legendre polynomial of third order. Peak pro- files were fitted by a Pseudo-Voigt profile function within a range of 8*FWHM. Refined parameters wereGV,GWandLY. Divergence was taken into account for fitting the peak asym- metry. Refined parameters wereH/LandS/L, both constrained H/L = S/L. The unit cell parameters a, b, c, β and the zero point were also refined. Minor reflections caused by impurities of elemental sulfur were excluded from the refinement. The observed and fitted diffraction patterns are shown in Figure 1.
Space group C2/c was determined with JANA2006 and the crystal structure was solved with Superflip implemented therein.[37,38] The positions of all atoms were located by this procedure. The Rietveld algorithm implemented in the JANA2006 program package was used for the structure refine- ment. The positions of all atoms were refined and anisotropic displacement parameters were used for the heavier atoms.
Figure 1.Section of the fitted powder profile from 2.0⬍2θ⬍40.0°.
We should remind that the wavelength is onlyλ = 0.70926 Å (Mo- Kα1) instead of λ = 1.540598 Å (Cu-Kα1), which is typically used.
Observed (⫻), fitted (gray line), and difference profiles of LiSbS2. Minor impurities due to elemental sulfur are omitted from the refine- ment (gray bar). The whole diagram is displayed in Figure S1.
S. Huber, A. Pfitzner
ARTICLE
However, the displacement parameter for lithium was fixed to a reasonable value ofUiso = 0.03 Å2in the final stages of the refinement. No significant residual electron density was de- tected in the final difference Fourier map. At this stage of the refinement the significance of the position for Li was checked.
TheRvalues increased when Li was excluded from the refine- ment and Difference Fourier syntheses had a maximum exactly at the Li position. This means that even Li can be refined from these data.
The X-ray diffraction pattern was refined to final R-values ofRp= 5.40 % andwRp= 7.21 % (expected 3.46 %), based on 4800 measured points. The structure refinement converged to final R-values of Robs (Rall) = 3.69 % (4.88 %) and wRobs (wRall) = 3.45 % (3.89 %).
Structure Description and Discussion
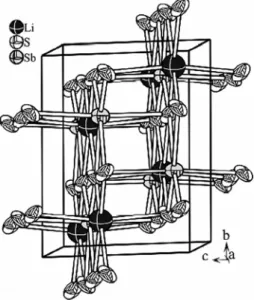
LiSbS2-mC16 crystallizes in the space group C2/c. The atoms are arranged in an ordered NaCl superstructure type.
The formation of the superstructure results from the separation of Li+ and Sb3+ on two different sites (see Table 2 and Fig- ure 2). Both sites are fully occupied with either antimony or lithium. Lithium has a slightly distorted octahedral coordina- tion by sulfur. The distances d(Li–S) are in the range from 2.66 Å to 2.9 Å (see Figure 3). The distortion of the octahedral coordination sphere is much more pronounced in the case of antimony. It has a coordination of 2 + 2 + 2 sulfur atoms.[39]
The distancesd(Sb–S) are 2.45 Å, 2.77 Å, and 3.20 Å (see Fig- ure 3).
Figure 2.Section of the crystal structure of LiSbS2-mC16.
Olivier-Fourcadeet al. described the phase diagram of Li2S and Sb2S3in 1983.[1,2] They reported that LiSbS2crystallizes in three different modifications (α-, β-, γ-LiSbS2). α-LiSbS2 was described as monoclinic without any structure details.β- LiSbS2(LiSbS2-hR72) crystallizes in an ordered NaCl super- structure, andγ-LiSbS2(LiSbS2-cF8) forms a cubic structure of the NaCl type. Only a powder pattern was published for the α-phase without any structure details. The simulated powder
www.zaac.wiley-vch.de © 2014 WILEY-VCH Verlag GmbH & Co. KGaA, Weinheim Z. Anorg. Allg. Chem.2014, 1596–1599 1598
Figure 3.Octahedral coordination spheres of antimony and lithium by sulfur.
pattern of the title compound does not match the reflection positions ofα-LiSbS2described in literature. Two explanations are possible for this observation: (1) the title compound is a fourth modification of LiSbS2, or (2) the published powder pattern forα-LiSbS2results from more than one phase and the title compound is the hitherto unknownα-phase of LiSbS2.
From a crystal chemical viewpoint LiSbS2-mC16 fits quite well to literature data on the heavier homologous compounds.
Both NaSbS2-mC16 and KSbS2-mC16 crystallize in the space groupC2/c. The ratios of the cell parameter are in the same range and show some systematic trends (see Table 5).[29,31]
The alkali metal cations therein have a slightly distorted octa- hedral coordination by sulfur. The distancesd(MI–S) increase from lithium to potassium, and they are in the usual range (see Table 6). In contrast, the antimony sulfur bonds show an interesting change. For LiSbS2-mC16 antimony has a 2 + 2 + 2 coordination by sulfur with four regular distancesd(Sb–S) = Table 5. Comparison of the unit cell parameters of MISbS2-mC16 (MI= Li, Na, K).
LiSbS2 NaSbS2[29] KSbS2[31]
Space group C2/c
a/Å 8.0205(8) 8.232(1) 8.75(1)
b/Å 7.9243(8) 8.252(2) 8.98(1)
c/Å 6.6987(7) 6.836(1) 6.84(1)
β/° 126.303(6) 124.28(1) 121.6(1)
V/Å3 343.11(7) 383.71 457.76
a/b 1.012 0.998 0.974
a/c 1.197 1.204 1.279
b/c 1.183 1.207 1.313
Table 6.Comparison ofd(Sb–S) andd(MI–S) inMISbS2-mC16 (MI= Li, Na, K).
LiSbS2 NaSbS2[29] KSbS2[31]
d(Sb–S)/Å 2⫻ 2.45 2.43 2.41
2⫻ 2.77 2.77 2.76
2⫻ 3.20 3.41 3.89
d(MI–S) /Å 2⫻ 2.65 2.91 3.17
2⫻ 2.8 2.92 3.17
2⫻ 2.9 2.95 3.20
LiSbS2-mC16: Structure Determination from X-ray Powder Diffraction Data
2.45 and 2.77 Å and two longer distancesd(Sb–S) = 3.20 Å, so called secondary bonds. The four regular distances between antimony and sulfur are more or less identical in all three com- pounds. However, the length of the secondary bonds increases significantly, i.e., the secondary bond length is d(Sb–S) = 3.20 Å for LiSbS2-mC16 and d(Sb–S) = 3.89 Å in KSbS2-mC16 (see Table 6). An increasing ionicity from the lithium to the potassium compound might serve as an explana- tion for this finding. This trend also might be the reason why MISbQ2(MI= Li, Na,Q= S, Se)[1,2,29,32,33]form a cubic rock salt structure (cF8) with disorder of MI and Sb at elevated temperatures.
Conclusions
LiSbS2-mC16 was obtained by reaction of Li2S, Sb, and S.
It represents the hitherto unknown so-called α-phase of LiSbS2. It crystallizes isotypic with the heavier homologous compounds in the space groupC2/cin an ordered NaCl super- structure type. The diffraction pattern was fitted to final R- values ofRp= 5.40 % andwRp= 7.21 %. The structure refine- ment converged at finalR-values ofRobs= 3.69 % and wRobs
= 3.45. A systematic increase of the secondary bond lengths is observed from LiSbS2-mC16 to KSbS2-mC16. In contrast, the regular bond lengths do not change in this series.
Experimental Section
LiSbS2-mC16 was obtained by the reaction of Li2S (99.9 %, Alfa Aesar), Sb (99.999 %, Chempur), and S (99.9995 %, Merck) in the ratio 1:2:5. The excess of sulfur serves as flux to obtain a crystalline product. All manipulations were performed in a glove box in an argon atmosphere. The starting materials were filled into graphite crucibles and fused in evacuated silica ampoules. The reagents were annealed for 3 weeks at 900 °C and cooled down to room temperature over 15 h.
The product is air and moisture sensitive. The dark red sample was ground and filled in glass capillaries (Ø = 0.3 mm). X-ray diffraction measurements were carried out with a STOE STADI P diffractometer with monochromatic Mo-Kα1-radiation (λ= 0.70926 Å), a Ge-mono- chromator, and a Mythen 1 K detector at 293 K. The 2θ range was 2.000° to 73.985° with a step-width of 0.015°. Four powder patterns were summed up for a better statistics and were subsequently used for the structure determination. The data were processed using JANA2006.[37]Background was corrected using a Legendre polyno- mial of third order and the profile was fitted by a Pseudo-Voigt profile function. The crystal structure was solved by Superflip.[38]The struc- ture was refined with the Rietveld algorithm implemented in JANA2006. Antimony and sulfur were refined by using anisotropic displacement parameters. The isotropic displacement parameter of lith- ium was fixed atUiso= 0.03 Å2in the final stages of the refinement.
Further details of the crystal structure investigations may be obtained from the Fachinformationszentrum Karlsruhe, 76344 Eggenstein- Leopoldshafen, Germany (Fax: +49-7247-808-666; E-Mail:
crysdata@fiz-karlsruhe.de, http://www.fiz-karlsruhe.de/request for deposited data.html) on quoting the depository number CSD-427506.
Supporting Information(see footnote on the first page of this article):
Figure S1: Whole range powder diffraction pattern for LiSbS2-mC16 measured with molybdenum radiation (λ= 0.70926 Å).
Z. Anorg. Allg. Chem.2014, 1596–1599 © 2014 WILEY-VCH Verlag GmbH & Co. KGaA, Weinheim www.zaac.wiley-vch.de 1599
References
[1] J. Olivier-Fourcade, L. Izghouti, M. Maurin, E. Philippot, Rev.
Chim. Miner.1983,20, 186.
[2] J. Olivier-Fourcade, M. Maurin, E. Philippot,Rev. Chim. Miner.
1983,20, 196.
[3] S. Huber, C. Preitschaft, R. Weihrich, A. Pfitzner,Z. Anorg. Allg.
Chem.2012,638, 2542.
[4] C. Pompe, A. Pfitzner,Z. Anorg. Allg. Chem.2013,639, 296.
[5] H. Sommer, R. Hoppe,Z. Anorg. Allg. Chem.1977,480, 199.
[6] C. Pompe, A. Pfitzner,Z. Anorg. Allg. Chem.2012,638, 2158.
[7] A. Pfitzner,Z. Anorg. Allg. Chem.1994,620, 1992.
[8] A. Pfitzner,Z. Kristallogr.1998,213, 228.
[9] S. Karup-Møller, E. Makovicky,Am. Mineral.1974,59, 889.
[10] B. J. Skinner, F. D. Luce, E. Makovicky,Econ. Geol.1972,67, 924.
[11] A. Pfitzner,Z. Anorg. Allg. Chem.1995,621, 685.
[12] E. J. Skoug, J. D. Cain, D. T. Morelli,Appl. Phys. Lett.2010,96, 181905.
[13] M. Kirkham, P. Majsztrik, E. Skoug, D. Morelli, H. Wang, W. D.
Porter, E. A. Payzant, E. Lara-Curzio,J. Mater. Res.2011,26, 2001.
[14] D. Harker,J. Chem. Phys.1936,4, 381.
[15] K. A. Schönau, S. A. T. Redfern,J. Appl. Phys.2002,92, 7415.
[16] M. Leitl,Dissertation, Regensburg,2007.
[17] W. Bronger, A. Donike, D. Schmitz,Z. Anorg. Allg. Chem.1999, 625, 435.
[18] D.-Y. Seung, P. Gravereau, L. Trut, A. Levasseur, Acta Crys- tallogr., Sect. C1998,54, 900.
[19] M. Palazzi,Acta Crystallogr., Sect. B1976,32, 3175.
[20] W. Bronger, A. Donike, D. Schmitz,Z. Anorg. Allg. Chem.1998, 624, 553.
[21] W. Bronger, A. Donike, D. Schmitz,Z. Anorg. Allg. Chem.1996, 622, 1003.
[22] W. Bronger, A. Donike, D. Schmitz,Z. Anorg. Allg. Chem.1997, 623, 1715.
[23] D. Harker,J. Chem. Phys.1936,4, 381.
[24] P. Engel, W. Nowacki,Acta Crystallogr., Sect. B1968,24, 77.
[25] K. Sakai, T. Koide, T. Matsumoto,Acta Crystallogr., Sect. B1978, 34, 3326.
[26] K. Kihara, T. Matsumoto,Z. Kristallogr.1986,177, 211.
[27] M. G. Kanatzidis, J.-H. Chou, J. Solid State Chem.1996, 127, 186.
[28] S. N. Hoda, L. L. Y. Chang,Am. Mineral.1975,60, 621.
[29] J. Olivier-Fourcade, E. Philippot, M. Maurin, Z. Anorg. Allg.
Chem.1978,446, 159.
[30] H. Effenberger, W. H. Paar, D. Topa, A. J. Criddle, M. Fleck,Am.
Mineral.2002,87, 753.
[31] H. A. Graf, H. Schaefer,Z. Anorg. Allg. Chem.1975,414, 211.
[32] V. A. Bazakutsa, N. I. Gnidash, V. B. Lazarev, E. I. Rogacheva, A. V. Salov, L. N. Sukhorukova, M. P. Vasil⬘eva, S. I. Berul,Russ.
J. Inorg. Chem.1973,18, 1722.
[33] B. Eisenmann, H. Schaefer,Z. Anorg. Allg. Chem.1979,456, 87.
[34] T. K. Bera, J.-I. Jang, S. Jungh Wan, C. D. Malliakas, A. J. Free- man, J. B. Ketterson, M. G. Kanatzidis,J. Am. Chem. Soc.2010, 132, 3484.
[35] O. Glemser, M. Filcek,Z. Anorg. Allg. Chem.1955,279, 321.
[36] G. Gattow, J. Zemann,Z. Anorg. Allg. Chem.1955,279, 324.
[37] V. Petricek, M. Dusek, L. Palatinus, The Crystallographic Com- puting SystemJANA2006. Institute of Physics, Praha, Czech Re- public,2006.
[38] L. Palatinus, G. J. Chapuis,J. Appl. Crystallogr.2007,40, 786.
[39] A. Pfitzner, D. Kurowski,Z. Kristallogr.2000,215, 373.
Received: February 7, 2014 Published Online: April 7, 2014