Southern Ocean Decadal Variability and Predictability Mojib Latif1,2, Torge Martin1, Annika Reintges1, and Wonsun Park1
1GEOMAR Helmholtz Centre for Ocean Research Kiel, Kiel, Germany
2Centre of Excellence “The Future Ocean”, Kiel, Germany Email: mlatif@geomar.de
Abstract
The Southern Ocean featured some remarkable changes during the recent decades. For example, large parts of the Southern Ocean, despite rapidly rising atmospheric greenhouse gas concentrations, depicted a surface cooling since the 1970s, whereas most of the planet has warmed considerably. In contrast, climate models generally simulate Southern Ocean surface warming when driven with observed historical radiative forcing. The mechanisms behind the Southern Ocean surface cooling and other prominent changes in the Southern Ocean sector climate during the recent decades, such as expanding sea-ice extent, abyssal warming, and CO2 uptake are still under debate. Observational coverage is sparse and records are short but rapidly growing, making the Southern Ocean climate system one of the least explored. It is thus difficult to separate current trends from underlying decadal to centennial scale variability. Here we present the state of the discussion about some of the most perplexing decadal climate trends in the Southern Ocean during the recent decades along with possible mechanisms and contrast these with an internal mode of Southern Ocean variability present in state-of-the art climate models.
Keywords: Southern Ocean, Climate trends, Internal variability, Atmosphere-ice-ocean interaction, Open-ocean deep convection, Climate models
NOTE: This is the revised version of the manuscript accepted by Current Climate Change reports. It is part of the Topical Collection on Decadal Predictability and Prediction. The final publication can be found at: https://link.springer.com/article/10.1007/s40641-017-0068-8
Please cite as
Latif M, Martin T, Reintges A, Park W (2017) Southern Ocean Decadal Variability and Predictability.
Current Climate Change Reports 3(3):163-173. doi:10.1007/s40641-017-0068-8
1. Introduction
One of the salient characteristics of the climate is its large variability. Climate variability exists on a wide range of timescales from seasonal, through decadal and centennial to multi- millennial and beyond. Climate variability can be either generated internally due to the chaotic nature of an individual or through interactions between different climate system components (e.g. atmosphere, ocean and cryosphere); or it can be forced externally, for example by volcanic eruptions, solar variability or anthropogenic emissions of greenhouse gases and aerosols. In the middle to high latitudes of the Southern Hemisphere another major anthropogenic driver of climate change during the last decades is stratospheric ozone, which strongly varies in response to varying human chlorofluorocarbon (CFC) emissions. The stratospheric ozone exhibited a fast depletion during the late part of the 20th century and a slow recovery beginning around the turn of the millennium, just now showing the first indication of actual healing (Solomon et al., 2016).
Prominent examples of internal climate variability, also termed unforced variability, with demonstrated impact on the Southern Ocean region are the El Niño/Southern Oscillation (ENSO), a coupled ocean-atmosphere mode originating in the equatorial Pacific (Philander, 1990; L’Heureux and Thompson, 2006; Ding et al., 2012), the Interdecadal Pacific Oscillation (IPO) (Power et al., 1999; Meehl et al., 2016), the Pacific Decadal Oscillation (PDO) (Mantua et al., 1997; Pezza et al., 2007) and the Atlantic Multidecadal Oscillation (AMO) (Knight et al., 2005; Li et al., 2014; Simpkins et al., 2014).All these phenomena are more or less inter- related, cover a wide range of frequencies, and project to a certain degree onto hemispheric and even global surface air temperature (SAT). The Southern Annular Mode (SAM) is the leading internal atmospheric mode in the Southern Hemisphere (Thompson and Solomon, 2002; Marshall, 2003; Visbeck, 2009). SAM variability is associated with changes in Antarctic surface temperatures, Southern Ocean dynamics and many other aspects of Southern Hemisphere climate including atmosphere-ocean feedbacks (Thompson and Solomon, 2002; Meredith and Hogg, 2006; Sen Gupta and England, 2007). A coupled ocean- atmosphere mode originating in the Southern Hemisphere is the Antarctic Circumpolar Wave (ACW) (White and Peterson, 1996; White et al., 1998). The ACW is a nominal 4-yr climate signal in the ocean-atmosphere system of the Southern Ocean, propagating eastward, composed of two waves taking approximately 8 years to circle the globe. The ACW is characterized by a persistent phase relationship between warm (cold) sea surface temperature (SST) anomalies and poleward (equatorward) meridional surface wind anomalies. More recently, Giarolla and Matano (2013) documented ACW-type variability from long time series of sea surface height (SSH), SST and wind stress curl observations. Finally, there is significant decadal variability in Southern Ocean CO2-uptake. About a decade ago scientists pointed out that the Southern Ocean carbon sink might have begun to “saturate” (Le Quere et al., 2007; Lovenduski et al., 2008). Based on model results, they suggested that it had not increased since the late 1980s. Now, Landschützer et al. (2015) show that since the beginning of the millennium, the Southern Ocean carbon sink has become much stronger, thereby regaining its expected strength.
Of special scientific and also public interest is the natural decadal to centennial variability, may it be internal or external, because it can interfere with and potentially mask the regional effects of anthropogenic climate change, as the natural variability evolves on a similar timescale, thereby hindering an early detection of anthropogenic climate signals. During the recent decades, pronounced decadal trends in the Southern Ocean sector climate have been observed in the atmosphere, the surface and abyssal Southern Ocean, and in the Antarctic sea- ice cover. However, the causes of these are still under debate. Are the trends during the recent decades, for example, part of long-term variability? Are the trends related? Are they due to internal or external factors? What is the role of remote forcing? How predictable is the
Southern Ocean decadal variability? And what is the role of anthropogenic forcing? In the following, we summarize the state of the discussion about these issues on the basis of selected examples. A complete review of Southern Ocean sector decadal variability and predictability is not attempted, but references of a number of papers are provided, which help to obtain a more detailed picture on the problem. Instead, we discuss the possibility of an own internal mode of the Southern Ocean as a possible contributor to the observed variability and trends.
2. Decadal changes in the lower atmosphere, in the surface and abyssal ocean, sea ice and carbon uptake
Changes in the lower atmosphere
We focus on the lower atmosphere of the middle to high latitude Southern Hemisphere, where the SAM, also known as the Antarctic Oscillation (AAO), dominates atmospheric variability and describes the north-south movement of the westerly wind belt that circles Antarctica. A positive SAM phase is characterized by an intensification of the belt of strong westerly winds and its contraction towards Antarctica. Conversely, a negative SAM phase reflects an expansion and weakening of the belt of strong westerly winds towards the equator.
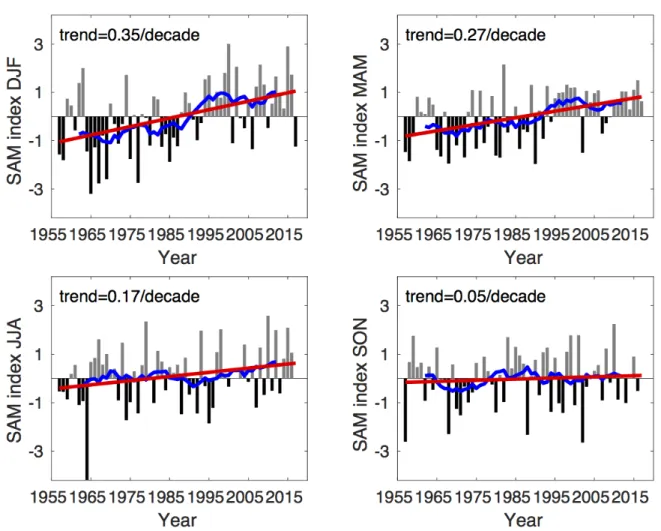
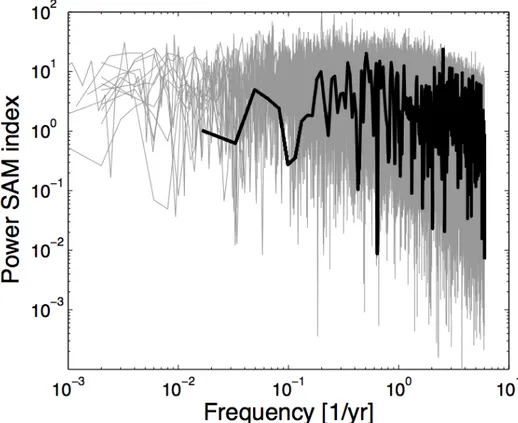
The SAM index is defined by the zonal pressure difference between the middle and high latitudes of the Southern Hemisphere and thus measures a seesaw of atmospheric mass (Marshall, 2003). Since the middle of the 1960s, the SAM index has been observed to increase, the most in summer (DJF) and least in spring (SON) (Fig. 1), and the tropospheric westerly winds in the Southern Hemisphere to accelerate on the poleward side of the surface wind maximum. The main characteristics of the index are unaffected by choosing an alternative definition, the leading principle component of sea level pressure (Thompson and Wallace, 2000). Climate models simulated pronounced internal decadal to multidecadal SAM variability (Fig. 2) which would superimpose any long-term trend. In most studies, the long- term trend has been attributed to the combined anthropogenic effects of increasing greenhouse gases and decreasing stratospheric ozone (see Thompson et al. 2011 and references therein).
The seasonal dependence of the Southern Hemisphere atmosphere response to anthropogenic forcing needs to be considered in this context. While the greenhouse gas-induced SAM changes occur year round, ozone-induced SAM changes occur primarily in the austral summer.Consequently, strongest SAM trends are observed during this season (Fig. 1). Since the beginning of the 21st century, the SAM index has been more stable and even depicted a weak downward trend in austral summer, which may be due to the stabilization of the stratospheric ozone, as has been conjectured by Son et al. (2010).
Atmospheric variability, in particular the intensification and poleward shift of the westerlies in conjunction with the recent positive SAM (Marshall, 2003), largely impacts the Southern Ocean current systems such as the Antarctic Circumpolar Current (ACC). While the mean current is less affected (Böning et al., 2008), the associated mesoscale eddy activity is changing (Meredith and Hogg, 2006). The latter is spatially strongly inhomogeneous as suggested by recent high-resolution ocean simulations (Patara et al., 2016; Meredith, 2016).
In situ and satellite-derived observations between 1993 and 2010 have been used by Domingues et al. (2014) to assess the link between local wind forcing mechanisms and the variability of the upper-ocean temperature and the dynamics of the different fronts in the ACC region. The main finding of their work is that meridional changes in the westerlies linked with the SAM drive temperature anomalies in the Ekman layer and changes in the Subantarctic Front and Antarctic Polar Front transports through Ekman dynamics.
Surface Southern Ocean and Antarctic sea-ice extent
One of the most prominent and also unexpected climate trends during the recent decades is the surface cooling or lack of surface warming in most parts of the Southern Ocean in the presence of a marked global surface warming (Fig. 3). Moreover, the Antarctic sea-ice extent slightly expanded during the satellite era (Parkinson and Cavalieri, 2012) in marked contrast to the Arctic sea-ice cover which has rapidly retreated during this period (Cavalieri and Parkinson, 2012). This prominent contrast has sparked many studies presenting a variety of explanations such as changes in the surface wind field (Holland and Kwok, 2012; Haumann et al, 2014; Purich et al., 2015), SAM changes featuring two different response time scales with opposing trends (Ferreira et al., 2015; Kostov et al., 2017), Amundsen Sea Low variability (Hosking et al., 2013; Raphael et al., 2016), a positive trend in the surface temperature (Comiso et al. 2017), and ice-ocean feedbacks related to the ocean’s stratification and mixing (Zhang, 2007; Goose and Zunz, 2014; Venables and Meredith, 2014); see Hobbs et al. (2016) for a detailed review. The hypothesis that also ozone depletion contributes to the observed positive trend in sea ice coverage (Turner et al., 2009) was not confirmed (Sigmond and Fyfe, 2010; Previdi and Polvani, 2014). In this context it is important to understand that the evolution of Antarctic sea ice extent is spatially highly variable and ice coverage is in fact shrinking in the Amundsen-Bellinghausen Sea (Parkinson and Cavalieri, 2012). We note that a record low of circumpolar Antarctic sea-ice extent has been measured in late 2016, but it is unclear whether this reflects a random fluctuation or marks an overall trend reversal.
Both the cooling of the surface Southern Ocean and the relatively stable Antarctic sea-ice extent, in the multi-model mean, are not simulated by current global climate models in so called “historical” experiments with observed radiative forcing. It should be mentioned in this context that historical radiative forcing is subject to large uncertainties, especially with regard to spatial and temporal variability. Armour et al. (2016) hypothesize that Southern Ocean warming could be delayed by circumpolar upwelling and equatorward transport. They suggest the Southern Ocean responds to greenhouse gas forcing on the centennial, or longer, timescale over which the deep ocean waters themselves, which are upwelled to the surface, are warmed.
While this mechanism by itself, however, cannot explain the Southern Ocean surface cooling, it needs to be taken into account when discussing recently observed trends and projections into the future.
As the multi-model mean is an estimate of the externally driven climate variability, the recent decadal trends in the Southern Ocean SST and Antarctic sea-ice extent may be an expression of internal variability which is strongly damped when averaging over a large number of historical runs (Polvani and Smith, 2013). In fact strong internal decadal to centennial variability in Southern Ocean SST and Antarctic sea-ice extent is simulated in some climate models with patterns similar to the observed trends during the recent decades (Latif et al.
2013, Wang and Dommenget 2016), which would readily explain the discrepancies between the average climate model response to observed historical forcing and the observed changes.
This explanation is consistent with the study of Jones et al. (2016) who analyzed recent atmospheric, surface ocean and sea-ice observations and assessed their trends in the context of paleoclimate records of the past two centuries and climate model simulations. Their study concludes that climate model simulations with anthropogenic forcing are not compatible with the observations—except for the positive trend in SAM—and that therefore these models likely underestimate internal variability, which in reality might overwhelm the global warming signal. This suggests that the Southern Ocean surface cooling and the expansion of the Antarctic sea-ice cover may not be driven by the strengthening of the SAM . In fact, the observed variability of the SAM index is well within the range simulated in pre-industrial control integrations of models participating in the Climate Model Intercomparison Project
phase 5 (CMIP5), which by definition yield estimates of internal climate variability (Fig. 2).
Some model studies, however, have linked the surface cooling trend to the SAM trend (Purich et al., 2015; Kostov et al., 2016).
Meehl et al. (2016) also stress the importance of internal variability and highlight the role of remote forcing from the tropics. They show that in some climate models, the negative phase of the IPO is characterized by teleconnections with anomalies similar to the observed low- level atmosphere circulation changes near Antarctica since 2000, which are conducive to expanding Antarctic sea-ice extent. This is consistent with the study of Ding et al. (2012) who conclude that the SAM index reflects the superposition of both high-latitude and tropically forced variability.
Climate models suffer from large biases in the Southern Ocean, which could be a reason for the difference between the multi-model mean trends calculated from the historical simulations and the observations. For example, the models exhibit significant SST biases in that region (e.g. Flato et al. 2013). Moreover, the models, among others due to the too coarse resolution in their ocean components, do not realistically simulate the deep convection and formation of Antarctic Bottom Water (AABW; Heuze et al., 2013). In the present climate, AABW is formed from High Salinity Shelf Water (HSSW), which is produced during the austral winter over the continental shelf, by mixing processes as the HSSW slides down the continental slope. At a few sites, the shelf water salinity is sufficiently high that, on cooling to the freezing point, the surface water density becomes high enough to allow it to sink to great depths. Instead of shelf convection the models simulate open-ocean deep convection and this is at the heart of the long-term internal variability simulated by them. The AABW formed by open ocean deep convection in models only has by chance the same properties as observed.
Such biases limit the applicability of the models when using them to understand past climate variability and to project future Southern Ocean sector climate change.
It is possible that the historical simulations do not include all external driving mechanisms, which could be another reason why the climate model simulations, when averaged, do not reproduce the recent decadal Southern Ocean SST and Antarctic sea-ice extent trends. For example, the models do not carry interactive continental ice sheets and are thus missing a major consequence of global warming: the melting of Antarctic ice shelves and destabilization of the ice sheet (Joughin et al., 2014; Feldmann and Levermann, 2015; Wåhlin et al, 2010; Khazendar et al., 2016; Christianson et al., 2016). The consequences of this additional freshwater input to the Southern Ocean are manifold and not yet fully understood.
It could explain, for example, the delay of Southern Ocean surface warming through enhanced stability of the water column and the associated decrease in the formation rate of AABW as well as warming at depth (van Wijk and Rintoul, 2014; Fogwill et al., 2015; Phipps et al., 2016). The claim that meltwater also drove the expansion of Antarctic sea ice during the recent decades (Bintanja et al, 2013) has been challenged, however, and its effect on sea ice in climate projections may be model-dependent (Swart and Fyfe, 2013; Bintanja et al, 2015). The wind-driven equatorward sea ice expansion actually has about the right magnitude to explain the freshening of surface and intermediate waters in the Southern Ocean (Haumann et al., 2016).
Abyssal Southern Ocean
While the surface Southern Ocean in large areas cooled, the abyssal Southern Ocean depicted a persistent warming (Purkey and Johnson 2012, Schmidtko et al., 2014, Desbruyères et al.
2016). This warming has considerably contributed to sea level rise. In fact the highest warming rates in the abyssal ocean layer (4000-6000 m) are found around the Southern Ocean, from where Antarctic Bottom Water spreads into the rest of the abyssal global ocean.
Model simulations suggest that warming of the abyssal Southern Ocean could strengthen the Atlantic Meridional Overturning Circulation (AMOC; Patara and Böning, 2014). Purkey and Johnson (2012) additionally report a statistically significant reduction in AABW volume between the 1980s and 2000s within the Southern Ocean and along the bottom-most, southern branches of the meridional overturning circulation (MOC). Budget calculations and the global AABW contraction pattern are consistent with a global-scale slowdown of the bottom, southern limb of the MOC.
Southern Ocean heat and carbon sink
The Southern Ocean south of 30°S may account for 75 % ± 22 % of the global oceanic heat uptake during the historical period as shown by model simulations (Frölicher et al. 2015).
However, there are large differences between models at which latitudes the additional heat is stored. While most models simulate an increased heat storage between 60°S and 80°S, a few models show a reduction in this area. Winton et al. (2013) investigate the effects of a changing ocean circulation associated with global warming. They find that reduced deep- convection in the Southern Ocean leads to increased heat accumulation at mid-depth in the high southern latitudes. They further emphasize that changing ocean currents impact the heat transport such that the oceanic heat uptake shifts from lower to higher latitudes. The resulting larger potential for additional heat uptake could act as a negative feedback on global warming.
This may have played a role in the recent global warming hiatus, in which storage of heat at deeper layers by the overturning in the Atlantic and Southern Ocean is suggested to have made an important contribution (Chen and Tung, 2014; Yan et al., 2016).
The Southern Ocean is an important carbon sink, because this region south of 35˚S accounts for 40% of the global ocean’s uptake of anthropogenic CO2 (Frölicher et al. 2015). Global warming may slow the uptake of atmospheric CO2 by the Southern Ocean and in fact previous work suggested that the strength of the Southern Ocean carbon sink fell during the 1990s. This raised concerns that such a decline in carbon uptake would exacerbate the rise of atmospheric CO2 and thus spur global warming. The newer data by Landschützer et al. (2015) show that the Southern Ocean carbon sink strengthened again over the past decade, which illustrates the variable nature of marine CO2-uptake which is strongly controlled by ocean dynamical processes. These, however, are not well understood, as discussed below (section 5).
3. A hypothesis of an internal Southern Ocean mode driving recently observed trends An explanation for the temperature changes in both the surface and abyssal Southern Ocean, and the expansion of Antarctic sea-ice focusing on an internal mode of ocean variability has been put forward by Latif et al. (2013) on the basis of the Kiel Climate Model (KCM; Park et al. 2009). The hypothesis, which may be regarded as a null hypothesis, relies on deep convection variability in the Southern Ocean, specifically in the Weddell Sea. Martin et al.
(2013) describe a quasi-oscillatory centennial-scale mode of open-ocean deep convection in the KCM with temperature changes of opposite sign at the surface and in the deep Southern Ocean. For example, periods of no deep convection in the Weddell Sea go along with anomalously cold SSTs and anomalously warm temperatures in the middle and deep Southern Ocean, and with enhanced sea-ice extent. During the convective state the signs of the anomalies are reversed.
The quasi-periodic occurrence of the deep convection causes variability in globally averaged SAT as large as 0.4°C/century, an intensified SAM and southward shift of the westerlies, and significant changes in Southern Ocean and Atlantic Ocean SSH and heat content, the ACC and the global MOC (Park and Latif, 2008; Latif et al., 2013; Martin et al., 2015; Pedro et al.,
2016). Deep convection is stimulated by a strong build-up of heat at mid-depth, where the heat is provided by the lower branch of the AMOC, a mechanism previously described from a number of uncoupled ocean model simulations (Mikolajewicz and Maier-Reimer, 1990;
Pierce et al., 1995). The deep convection oscillation is driven by the competing roles of changes of this heat content and salinity variations at the surface on the stability of the water column. When the heat reservoir is virtually depleted a coincidental strong freshening event at the sea surface from either anomalous high precipitation or sea ice melt rates shuts down the convection. The accumulation of heat during the non-convective regime and its subsequent release to the atmosphere during the convective regime can be viewed as a nonlinear recharge oscillator. The slow recharge process, which is clearly seen in global ocean heat content, is responsible for the centennial timescale of the phenomenon (Martin et al., 2013).
During phases of deep convection, the heat is rapidly released to the atmosphere, similar to what was observed during the Weddell Polynya (Moore et al. 2002). This was a major climatic event with the occurrence of a very large region (350,000 km2) of open water or polynya within the ice-covered Weddell Sea during the austral winters of 1974-1976, which resulted in the convective overturning of the water column and formation of vast amounts of cold and dense Antarctic Bottom Water (Gordon, 1978, 2001). Similarities of the deep convection phase of the centennial-scale oscillation in the KCM to the Weddell Sea polynya observed in the mid-1970s are noticed by Martin et al. (2013). On the basis of the model results, the Weddell Sea polynya could be part of a longer-term cycle in Southern Ocean deep convection and ocean heat content. As discussed above, AABW formation exclusively through open-ocean deep convection, as in the KCM and other climate models, is unrealistic.
Nevertheless, the recharge mechanism could still be an important mechanism for the generation of internal decadal to centennial variability in the Southern Ocean, as shown, for example, by the similarity of surface and abyssal ocean temperature changes in observations and the KCM (Latif et al. 2013). The impact of deep-convection shutdown on abyssal warming was quantified by Zanowski et al. (2015) to be about 10 % ± 8 % in an experiment with the earth system model GFDL-ESM2G. For the individual ocean basins, the response including uncertainty ranges from -5 % to +47 % but may be model-dependent.
The studies with the KCM support the conjecture that internal decadal to centennial variability originating in the Southern Ocean did contribute to the observed SST, sea level pressure, sea ice extent and abyssal temperature trends during the recent decades. We note that the observed trends are spatially inhomogeneous and that individual, regionally different responses to global warming explain a large part of the variability. While the modeled internal variability does not match the observed spatial pattern exactly, the simulations clearly show that the Southern Ocean can drive climate variability which has the potential to mask anthropogenic climate change locally, regionally and even globally. However, the deep convection variability strongly varies from climate model to climate model and also among different versions of the KCM (Fig. 2; de Lavergne et al., 2014; Reintges et al., 2017).
Common model behavior includes: The oceanic stratification in the convection region sets the timescale of the deep-convection variability, i.e. models with a strong (weak) stratification vary on long (short) timescales, and sea-ice volume influences the modeled mean state in the Southern Ocean with large (small) sea-ice volume being associated with a non-convective (convective) default state (Reintges et al., 2017).
4. Predictability of Southern Ocean variability
Here we only concentrate on diagnostic predictability which is derived from long control integrations of climate models. We consider potential predictability (Boer and Lambert, 2008). Potential predictability is not predictability in the classical sense but an indirect
approach which attempts to quantify the fraction of long-term variability that may be distinguished from the internally generated unpredictable natural variability “noise” at the timescale of interest. The long-term variability “signal” that rises above this noise, if it exists and is of appreciable magnitude, is presumed to be the result of processes in the physical system, which are predictable with sufficient knowledge and information.
Climate models suggest the Southern Ocean is a region of high decadal predictability potential, when employing a multi-model approach and using the measure of potential predictability (Boer and Lambert, 2008). For example, with regard to decadal mean SATs the middle and high northern and southern latitudes stick out as regions exhibiting high values of potential predictability. With regard to 25-year averages of the SATs, the regions of relatively high potential predictability, with variance fractions of up to 25 %, are in the subpolar North Atlantic and the Southern Ocean especially in its Atlantic sector, pointing to an important role of the MOC. Zhang et al. (2017a) performed a diagnosis of decadal predictability of Southern Ocean SST in a multi-millennial control integration of a climate model. They find that the leading most predictable mode, which is centennial and has a uniform pattern over the Southern Ocean, is predictable up to 20 years. The mode is related to an internal mode of the model and shares similarities to the recharge oscillator mechanism described by Martin et al.
(2013) and Latif et al. (2013). The study of Zhang et al. (2017a) is consistent with the perfect model study of Pohlmann et al. (2004) investigating SAT prognostic potential predictability.
They also found enhanced decadal predictability in the Southern Ocean.
Global warming may have a significant impact on decadal predictability in the Southern Ocean. As shown by de Lavergne et al. (2014), enhanced surface freshening (net increase in precipitation minus evaporation) associated with the increase of atmospheric greenhouse gases (GHGs) causes cessation of the open-ocean deep convection in CMIP5 climate model projections. This leads to a strong reduction of internal deep-convection variability and enhances the detectability of global warming-related signals.
5. Climate model limitations
Important processes influencing Southern Ocean variability are not explicitly resolved in most current climate models and instead—often not adequately—parameterized. This may not only influence the statistics of natural variability but also determine the Southern Ocean’s response to anthropogenic forcing in models. Ocean mesoscale eddies and submesoscale variability is widely underrepresented (or simply not resolved) in climate models. These small-scale ocean dynamics have important influence on heat and freshwater transports, the circulation response to wind changes and the uptake of CO2 in the Southern Ocean. In the atmosphere, climate models project that the SAM index will further strengthen during the course of the 21st century if GHG emissions continue to grow unabatedly. This trend may be masked by consequences of stratospheric ozone recovery, which could counteract the GHG-forced change in austral summer but currently is not accounted for in all climate models (Arblaster et al., 2011). This may be viewed as a deficit in the experimental design, i.e. the offline radiative forcing, rather than a climate model bias.
Climate models simulate warmer Antarctic and Southern Ocean surface temperatures than currently observed. Differences between observed and modeled mean state and trends either can be associated with uncertainties in the atmospheric component, e.g. the misrepresentation of radiative processes and clouds (Schneider and Reusch, 2016; McCoy et al., 2015), or in the oceanic component (e.g. overturning circulation; Wang et al., 2014; Armour et al., 2016).
Another example is the ACC which is the strongest current in the world ocean and a major pathway for interoceanic exchange of heat and salt and largely driven by the mid-latitude
westerly winds. While some climate model studies show that the intensification of the westerlies may drive an increase of the ACC transport (Bi et al. 2002, Saenko et al. 2005, Fyfe and Saenko 2006), other model studies show no change (Hallberg and Gnanadesikan 2006, Meredith and Hogg 2006, Hogg et al. 2008, Screen et al. 2009) or even a reduction (Yang et al. 2008, Wang et al. 2011) in the transport of this current. On interannual timescales, the high-resolution simulations exhibit an “eddy-saturated” ocean state in response to the increase in the wind stress, which does not affect the total circumpolar transport, but enhances the eddy field, driving an increase in the poleward heat flux. In addition, recent observations show that there has been no increase in the meridional tilt of density surfaces across the ACC (Böning et al. 2008), which indicates that the ACC transport is insensitive to changes in the wind stress on decadal timescales.
This controversy calls for the use of eddy-resolving ocean components in climate models to better represent the Southern Ocean’s natural variability and its response to external, specifically anthropogenic forcing. Moreover, recent work suggests that the atmospheric components of climate models must resolve daily oceanic variability (Zhou et al. 2015) and the variability associated with the oceanic eddies in oceanic frontal regions to enhance the representation of air-sea interactions and the simulation of large-scale ocean currents (Ma et al. 2016).
Biases in the representation of the Southern Ocean in climate models may have important implications. Bordbar et al. (2015), for example, investigated the influence of long-term internal variabilityon centennial projections of dynamic sea level (DSL) which is controlled by ocean circulation changes. They find in several regions of the world ocean, including the Southern Ocean, that the long-term internal DSL variability introduces a large uncertainty about the future evolution in regional sea level. Yet the signal-to-noise-ratio for the detection of an anthropogenic DSL signal in the Southern Ocean is favorable, because virtually all climate models project a stronger SAM and in response stronger ACC. The models, however, do not explicitly incorporate the potentially stabilizing feedback by the mesoscale eddies, raising questions about the confidence we can have in the climate model projections of the future ACC and related quantities such as Southern Ocean carbon uptake.
6. Conclusions
During the recent decades, the Southern Ocean sector climate with regard to key parameters evolved very differently than most other regions on the globe. Just one example is the cooling of large parts of the surface Southern Ocean and the expanding Antarctic sea ice cover, despite most of the Earth’s surface considerably warmed as expected from the strongly rising atmospheric greenhouse gas concentrations. Long-term observations and climate models suggest that the Southern Ocean is a region of strong decadal to centennial natural variability.
Further, many different processes with different timescales interfere such that the response to global warming seems particularly slow—in contrast to, for instance, the northern high latitudes. This makes the Southern Ocean a region where anthropogenic climate signals may be hard to detect during the next few decades.
The Southern Ocean is a region of limited observations, which hampers constraining climate models and disentangling the reasons for the observed variability during the recent decades.
At this stage of research, neither anthropogenic forcing nor internal variability can be determined as the sole driver of the observed cooling trend in Southern Ocean SST and the expansion of Antarctic sea-ice, also because uncertainties in forcing and response exist. On the one hand, intensified SAM, SST cooling, growing sea-ice cover, and other trends may be related to anthropogenic forcing associated with increasing GHG concentrations and global warming. The latter also causes enhanced disintegration of the Antarctic ice sheet with
implications for the aforementioned trends as discussed above. On the other hand, internal decadal to centennial variability may cause the observed changes, where the internal variability can either originate in the Southern Ocean itself (e.g., Martin et al. 2013) or be due to remote forcing, for example by the AMO through atmospheric teleconnections (Zhang et al. 2017b). Since the observed changes vary regionally, both anthropogenic forcing and internal variability as well as their superposition may be possible causes of local trends.
Moreover, there is considerable uncertainty associated with the forcing itself but also in the response to the forcing. While we know all forcing agents, we still do not fully understand all the consequences and interfering effects of different forcing agents such as growing atmospheric GHG concentrations, stratospheric ozone depletion and recovery, and aerosols (e.g. Arblaster and Meehl 2006, Arblaster et al. 2011, Thompson et al. 2011).
Major multi-national efforts are needed to significantly enhance our ability to monitor Southern Ocean sector variability, as Pope et al. (2017) argue exemplary for satellite data. A result of the limited data coverage is our dependence on climate models to understand the mechanisms of Southern Ocean sector climate variability. The Kiel Climate Model (KCM), which has been discussed in some detail in this study, like many other climate models suffers from large biases. Shelf convection, for example, the main formation mechanism of the very dense Antarctic Bottom Water, is not present and mesoscale eddy variability not resolvedin most climate models. It is unclear at this stage of research how model bias affects Southern Ocean decadal to centennial variability and predictability. Yet we believe on the basis of the level of similarity with the few observations that the climate models are realistic enough to conclude that the Southern Ocean is an important source of internal decadal variability and that this variability has significant climate impacts, even outside the Southern Ocean sector.
The oceanic uptake of atmospheric carbon dioxide (CO2) as well is influenced by the natural variability of the Southern Ocean and its atmospheric forcing.
Finally, climate models suggest the Southern Ocean is a region of high decadal predictability potential. However, there are only very few studies to date explicitly investigating Southern Ocean predictability. An internationally coordinated assessment of Southern Ocean predictability and its relevance for climate forecasts over land areas would be welcome. This should go hand in hand with an enhanced ocean observing system, as measurements in the Southern Ocean are rather limited, especially in ice-covered areas and the deep layers below 2,000 meters.
Acknowledgements
We thank two anonymous reviewers and the editor for their very helpful comments on an earlier version of the manuscript. This work was supported by CLIMPRE InterDec project (01LP1609B) and the PALMOD project (01LP1503D) both funded by the Bundesministerium für Bildung und Forschung (BMBF), Germany. The study is a contribution the Cluster of Excellence “The Future Ocean” at the University of Kiel (EXC80/2).
Conflict of interest
On behalf of all authors, the corresponding author states that there is no conflict of interest.
References
1. Solomon S, Ivy DJ, Kinnison D, Mills MJ, Neely III RR, Schmidt A (2016) Emergence of healing in the Antarctic ozone layer. Science 353:269-274. doi: 10.1126/science.aae0061
2. Philander SG (1990) El Nino, La Nina and the Southern Oscillation. International Geophysical Series, 46, Academic Press, 293 pp
3. L’Heureux ML, Thompson DWJ (2006) Observed relationships between the El Nino–Southern Oscillation and the extratropical zonal-mean circulation. J. Climate, 19, 276–287.
4. Ding Q, Steig EJ, Battisti DS, Wallace JM (2012) Influence of the Tropics on the Southern Annular Mode. J. Climate, 25, 6330–6348, doi: 10.1175/JCLI-D-11-00523.1.
5. Power S, Casey T, Folland C et al. (1999) Inter-decadal modulation of the impact of ENSO on Australia. Climate Dynamics 15:319-324. doi:10.1007/s003820050284
6. Meehl GA, Arblaster JM, Bitz CM, Chung CTY, Teng H (2016) Antarctic sea-ice expansion between 2000 and 2014 driven by tropical Pacific decadal climate variability. Nat Geosci 9:590-596. doi: 10.1038/NGEO2751
7. Mantua NJ, Hare SR, Zhang Y, Wallace JM, Francis RC (1997) A Pacific interdecadal climate oscillation with impacts on salmon production. Bull. Amer. Meteor. Soc., 78, 1069–1079.
8. Pezza AB, Simmonds I, Renwick JA (2007) Southern hemisphere cyclones and anticyclones: recent trends and links with decadal variability in the Pacific Ocean. Int. J. Climatol., 27: 1403–1419. doi:10.1002/joc.1477
9. Knight JR, Allan RJ, Folland CK, Vellinga M, Mann ME (2005) A signature of persistent natural thermohaline circulation cycles in observed climate. Geophys. Res. Lett., 32, L20708, doi:10.1029/2005GL024233 10. Li X, Holland DM, Gerber EP, Yoo C (2014) Impacts of the north and tropical Atlantic Ocean on the Antarctic
Peninsula and sea ice. Nature 505:538–542. doi: 10.1038/nature12945
11. Simpkins GR, McGregor S, Taschetto AS, Ciasto LM, England MH (2014) Tropical Connections to Climatic Change in the Extratropical Southern Hemisphere: The Role of Atlantic SST Trends. J Climate 27:4923-4936. doi:
10.1175/JCLI-D-13-00615.1
12. Thompson DWJ, Solomon S (2002) Interpretation of recent Southern Hemisphere climate change. Science, 296, 895– 899
13. Marshall GJ (2003) Trends in the southern annular mode from observations and reanalyses. J. Climate, 16, 4134–
4143
14. Visbeck M (2009) A station-based southern annular mode index from 1884 to 2005. J Climate 22: 940–950. doi:
10.1175/2008JCLI2260.1
15. Meredith MP, Hogg AM (2006) Circumpolar response of Southern Ocean eddy activity to a change in the Southern Annular Mode, Geophys. Res. Lett., 33, L16608, doi:10.1029/2006GL026499.
16. Sen Gupta A, England MH (2007) Coupled Ocean–Atmosphere Feedback in the Southern Annular Mode. J.
Climate, 20, 3677–3692, doi: 10.1175/JCLI4200.1.
17. White WB, Peterson RG (1996) An Antarctic circumpolar wave in surface pressure, wind, temperature, and sea ice extent. Nature, 380, 699–702
18. White WB, Chen S-C, Peterson RG (1998) The Antarctic Circumpolar Wave: A Beta Effect in Ocean–Atmosphere Coupling over the Southern Ocean. J. Phys. Oceanogr., 28, 2345–2361, doi: 10.1175/1520-
0485(1998)028<2345:TACWAB>2.0.CO;2
19. Giarolla E, Matano RP (2013) The Low-Frequency Variability of the Southern Ocean Circulation. J Climate 26:6081- 6091. doi: 10.1175/JCLI-D-12-00293.1
20. Le Quéré C, Rödenbeck C, Buitenhuis ET, Conway TJ, Langenfelds R, Gomez A, Labuschagne C, Ramonet M, Nakazawa T, Metzl N, Gillett N, Heimann M (2007) Saturation of the southern ocean CO2 sink due to recent climate change. Science 316, 1735–1738, doi:10.1126/science.1136188
21. Lovenduski NS, Gruber N, Doney SC (2008) Toward a mechanistic understanding of the decadal trends in the Southern Ocean carbon sink, Global Biogeochem. Cycles, 22, GB3016, doi:10.1029/2007GB003139
22. Landschützer P, Gruber N, Haumann FA, Rödenbeck C, Bakker DCE, van Heuven S, Hoppema M, Metzl N, Sweeney C, Takahashi T, Tilbrook B, Wanninkhof R (2015) The reinvigoration of the Southern Ocean carbon sink. Science 349:1221-1224. doi: 10.1126/science.aab2620
23. Thompson, DWJ., Wallace JM (2000) Annular modes in the extratropical circulation. Part I: Month-to-month variability. J. Climate, 13, 1000–1016.
24. Thompson DWJ, Solomon S, Kushner PJ, England MH, Grise KM, Karoly DJ. (2011) Signatures of the Antarctic ozone hole in Southern Hemisphere surface climate change. Nat Geosci 4:741-749. doi: 10.1038/NGEO1296 25. Son SW, Gerber EP et al (2010) Impact of stratospheric ozone on Southern Hemisphere circulation change: A
multimodel assessment. J Geophys Res-Atmos 115. doi: 10.1029/2010JD014271
26. Böning CW, Dispert A, Visbeck M, Rintoul SR, Schwarzkopf FU (2008) The response of the Antarctic Circumpolar Current to recent climate change. Nat Geosci 1:864–869
27. Patara L, Böning CW, Biastoch A (2016) Multi-decadal trends in Southern Ocean eddy activity in 1/12° ocean model simulations. Geophys Res Lett 43. doi:10.1002/2016GL069026
28. Meredith, MP (2016) Understanding the structure of changes in the Southern Ocean eddy field. Geophys Res Lett 43:5829–5832. doi:10.1002/2016GL069677
29. Domingues R, Goni G, Swart S, Dong S (2014) Wind forced variability of the Antarctic Circumpolar Current south of Africa between 1993 and 2010. J Geophys Res-Oceans 119:1123-1145. doi:10.1002/2013JC008908
30. Parkinson CL, Cavalieri DJ (2012) Antarctic sea ice variability and trends, 1979-2010. Cryosphere 6:871-880. doi:
10.5194/tc-6-871-2012
31. Cavalieri DJ, Parkinson CL (2012) Arctic sea ice variability and trends, 1979–2010. Cryosphere 6:881-889.
doi:10.5194/tc-6-881-2012
32. Holland PR, Kwok R (2012) Wind-driven trends in Antarctic sea-ice drift. Nat Geosc, 5(12), 872-875.
doi:10.1038/ngeo1627
33. Haumann FA, Notz D, Schmidt H (2014) Anthropogenic influence on recent circulation-driven Antarctic sea ice changes. Geophys Res Lett 41, 8429–8437. doi:10.1002/2014GL061659
34. Purich A, Cai W, England MH, Cowan T (2015) Evidence for link between modelled trends in Antarctic sea ice and underestimated westerly wind changes. Nat Comm 7:10409. doi: 10.1038/ncomms10409
35. Ferreira D, Marshall J, Bitz CM, Solomon S, Plumb A (2015) Antarctic ocean and sea ice response to ozone depletion: a two-time-scale problem. J Clim 28:1206–1226. doi:10.1175/JCLI-D-14-00313.1
36. Kostov Y, Marshall J, Hausmann U, Armour KC, Ferreira D, Holland MM (2017) Fast and slow responses of Southern Ocean sea surface temperature to SAM in coupled climate models. Clim Dyn 48: 1595-1609.
doi:10.1007/s00382-016-3162-z
37. Hosking JS, Orr A, Marshall GJ, Turner J, Phillips T (2013) The influence of the Amundsen-Bellingshausen seas low on the climate of West Antarctica and its repre- sentation in coupled climate model simulations. J Clim 26:6633–
6648. doi:10.1175/JCLI-D-12-00813.1
38. Raphael MN, Marshall GJ, Turner J, Fogt RL, Schneider D, Dixon DA, Hosking JS Jones JM, Hobbs WR (2016) The Amundsen Sea low: variability, change, and impact on Antarctic climate. B Am Meteorol Soc 97:111–121.
doi:10.1175/bams- d-14-00018.1
39. Comiso JC, Gersten RA, Stock LV, Turner J, Perez GJ, Cho K (2017) Positive Trend in the Antarctic Sea Ice Cover and Associated Changes in Surface Temperature. J Climate, 30, 2251-2267. doi: 10.1175/JCLI-D-16-0408.1
40. Zhang JL (2007) Increasing Antarctic sea ice under warming atmospheric and oceanic conditions. J Clim 20, 2515–
2529. doi:10.1175/Jcli4136.1
41. Goosse H, Zunz V (2014) Decadal trends in the Antarctic sea ice extent ultimately controlled by ice-ocean feedback. Cryosphere 8, 453–470. doi:10.5194/tc- 8-453-2014
42. Venables HJ, Meredith MP (2014) Feedbacks between ice cover, ocean stratification, and heat content in Ryder Bay, western Antarctic peninsula. J Geophys Res 119, 5323–5336. doi:10.1002/2013JC 009669
43. Hobbs WR, Massom R, Stammerjohn S, Reid P, Williams G, Meier W (2016) A review of recent changes in Southern Ocean sea ice, their drivers and forcings. Global Planet Change 143:228-250. doi:
10.1016/j.gloplacha.2016.06.008
44. Turner J,and Coauthors (2009) Non-annular atmospheric circulation change induced by stratospheric ozone depletion and its role in the recent increase of Antarctic sea ice extent. Geophys Res Lett 36:L08502.
doi:10.1029/2009GL037524
45. Sigmond M, Fyfe JC (2010) Has the ozone hole contributed to increased Antarctic sea ice extent? Geophys Res Lett 37:L18502. doi:10.1029/2010GL044301
46. Previdi M, Polvani LM (2014) Climate system response to stratospheric ozone depletion and recovery. QJR Meteorol Soc 140:2401–2419. doi:10.1002/qj.2330
47. Parkinson CL, Cavalieri DJ (2012) Antarctic sea ice variability and trends, 1979-2010. Cryosphere 6: 871-880.
doi:10.5194/tc-6-871-2012
48. Armour KC, Marshall J, Scott JR, Donohoe A, Newsom ER (2016) Southern Ocean warming delayed by circumpolar upwelling and equatorward transport. Nat Geosci 9:549-555. doi: 10.1038/NGEO2731
49. Polvani LM, Smith KL (2013) Can natural variability explain observed Antarctic sea ice trends? New modeling evidence from CMIP5. Geophys Res Lett 40:3195–3199. doi:10.1002/grl.50578
50. Latif M, Martin T, Park W (2013) Southern Ocean Sector Centennial Climate Variability and Recent Decadal Trends. J Climate 26:7767-7782. doi: 10.1175/JCLI-D-12-00281.1
51. Wang G, Dommenget D (2016) The leading modes of decadal SST variability in the Southern Ocean in CMIP5 simulations. Clim Dynam 47:1775-1792. doi: 10.1007/s00382-015-2932-3
52. Jones JM, Gille ST et al (2016) Assessing recent trends in high-latitude Southern Hemisphere surface climate.
Nature Climate Change 6:917-926. doi: 10.1038/NCLIMATE3103
53. Flato G, Marotzke J et al (2013) Evaluation of Climate Models. In: Stocker TF, Qin D et al (ed) Climate Change 2013: The Physical Science Basis. Contribution of Working Group I to the Fifth Assessment Report of the Intergovernmental Panel on Climate Change, Cambridge University Press, Cambridge, United Kingdom and New York, NY, USA
54. Heuze C, Heywood KJ, Stevens DP, Ridley JK (2013) Southern Ocean bottom water characteristics in CMIP5 models. Geophys Res Lett 7:1409-1414. doi: 10.1002/grl.50287
55. Joughin I, Smith BE, Medley B (2014) Marine Ice Sheet Collapse Potentially Underway for the Thwaites Glacier Basin, West Antarctica. Science. doi:10.1126/science.1249055
56. Feldmann J, Levermann A (2015) Collapse of the West Antarctic Ice Sheet after local destabilization of the Amundsen Basin. PNAS 112(46):14191-14196. doi:10.1073/pnas.1512482112
57. Wåhlin AK, Yuan X, Björk G, Nohr C (2010) Inflow of Warm Circumpolar Deep Water in the Central Amundsen Shelf. J. Phys. Oceanogr., 40, 1427–1434, doi: 10.1175/2010JPO4431.1
58. Khazendar A, Rignot E, Schroeder DM, Seroussi H, Schodlok MP, Scheuchl B, Mouginot J, Sutterley TC, Velicogna I (2016) Rapid submarine ice melting in the grounding zones of ice shelves in West Antarctica. Nat Comm 7.
doi:10.1038/ncomms13243
59. Christianson K, et al. (2016) Sensitivity of Pine Island Glacier to observed ocean forcing. Geophys Res Lett 43:10,817–10,825. doi:10.1002/2016GL070500
60. van Wijk EM, Rintoul SR (2014) Freshening drives contraction of Antarctic Bottom Water in the Australian Antarctic Basin. Geophys Res Lett 41(5):1657–1664. doi:10.1002/2013GL058921.
61. Fogwill CJ, Phipps SJ, Turney CSM, Golledge NR (2015) Sensitivity of the Southern Ocean to enhanced regional Antarctic ice sheet meltwater input. Earth’s Future 3:317–329. doi:10.1002/2015EF000306.
62. Phipps SJ, Fogwill CJ, Turney CSM (2016) Impacts of marine instability across the East Antarctic Ice Sheet on Southern Ocean dynamic. Cryosphere 10(5):2317-2328. doi:10.5194/tc-10-2317-2016
63. Bintanja R, Van Oldenborgh GJ, Drijfhout SS, Wouters B, Katsman CA (2013) Important role for ocean warming and increased ice-shelf melt in Antarctic sea-ice expansion. Nature Geosci 6(5):376–379. doi:10.1038/ngeo1767 64. Swart NC, Fyfe JC (2013) The influence of recent Antarctic ice sheet retreat on simulated sea ice area trends.
Geophys Res Lett 40(16):4328–4332. doi: 10.1002/grl.50820
65. Bintanja R, Van Oldenborgh GJ, Katsman, CA (2015) The effect of increased fresh water from Antarctic ice shelves on future trends in Antarctic sea ice. Ann Glaciol 56:120-126. doi: 10.3189/2015AoG69A001
66. Haumann FA, Gruber N, Münnich M, Frenger I, Kern S (2016) Sea-ice transport driving Southern Ocean salinity and its recent trends. Nature 537:89–92. doi:10.1038/nature19101
67. Purkey SG, Johnson GC (2012) Global Contraction of Antarctic Bottom Water between the 1980s and 2000s. J Climate 25:5830-5844. doi: 10.1175/JCLI-D-11-00612.1
68. Schmidtko S, Heywood KJ, Thompson AF, Aoki A. (2014) Multidecadal warming of Antarctic waters. Science 346, 1227-1231. doi: 10.1126/science.1256117.
69. Desbruyères DG, Purkey SG, McDonagh EL, Johnson GC, King BA (2016) Deep and abyssal ocean warming from 35 years of repeat hydrography. Geophys Res Lett 43:10356–10365. doi: 10.1002/2016GL070413
70. Patara L, Böning CW (2014) Abyssal ocean warming around Antarctica strengthens the Atlantic overturning circulation. Geophys Res Lett 41, 3972-3978. doi: 10.1002/ 2014GL059923.
71. Frölicher T, Sarmiento JL, Paynter DJ, Dunne JP, Krasting JP, Winton M (2015) Dominance of the Southern Ocean in Anthropogenic Carbon and Heat Uptake in CMIP5 Models. J Climate 28:862–886. doi: 10.1175/JCLI-D-14- 00117.1
72. Winton M, Griffies SM, Samuels BL, Sarmiento JL, Frölicher TL (2013) Connecting changing ocean circulation with changing climate. J Climate 26:2268–2278. doi:10.1175/JCLI-D-12-00296.1
73. Chen X, Tung, K-K (2014) Varying planetary heat sink led to global-warming slowdown and acceleration. Science 345(6199), 897-903. doi:10.1126/science.1254937
74. Yan, X.-H., Boyer, T., Trenberth, K., Karl, T. R., Xie, S.-P., Nieves, V., Tung, K.-K. and Roemmich, D. (2016), The global warming hiatus: Slowdown or redistribution?. Earth's Future, 4: 472–482. doi:10.1002/2016EF000417 75. Park W, Keenlyside N, Latif M, Ströh A, Redler R, Roeckner E, Madec G (2009) Tropical Pacific Climate and Its
Response to Global Warming in the Kiel Climate Model. J Climate 22:71–92. doi:10.1175/2008JCLI2261.1 76. Martin T, Latif M, Park W (2013) Multi-centennial variability controlled by Southern Ocean convection in the Kiel
Climate Model. Clim Dynam 40:2005–2022. doi: 10.1007/s00382-012-1586-7
77. Park W, Latif M (2008) Multidecadal and multicentennial variability of the meridional overturning circulation.
Geophys Res Lett 35:L22703. doi:10.1029/2008GL035779
78. Martin T, Park W, Latif M (2015) Southern Ocean Forcing of the North Atlantic at Multi-centennial Time Scales in the Kiel Climate Model. Deep Sea Res II 114:39–48. doi:10.1016/j.dsr2.2014.01.018,
79. Pedro JB, Martin T, Steig EJ, Jochum M, Park W, Rasmussen SO (2016) Southern Ocean deep convection as a driver of Antarctic warming events. Geophys Res Lett 43:2192-2199. doi:10.1002/2016GL067861
80. Mikolajewicz U, Maier-Reimer E (1990) Internal secular variability in an ocean general circulation model. Clim Dyn 4:145–156
81. Pierce DW, Barnett TP, Mikolajewicz U (1995) Competing roles of heat and freshwater flux in forcing thermohaline oscillations. J Phys Oceanogr 25(9):2046–2064
82. Moore GWK, Alverson K, Renfrew IA (2002) A reconstruction of the air–sea interaction associated with the Weddell Polynya. J Phys Oceanogr 32:1685–1698. doi: 10.1175/1520-0485(2002)032<1685:AROTAS>2.0.CO;2 83. Gordon AL (1978) Deep Antarctic convection west of Maud rise. J Phys Oceanogr 8(4):600–612
84. Gordon AL (2001) Bottom water formation. Encyclopedia of Ocean Sciences, Steele JH, Turekian KK, Thorpe SA, Eds., Academic Press, 334–340. doi:10.1006/rwos.2001.0006
85. Zanowski H, Hallberg R, Sarmiento JL (2015) Abyssal Ocean Warming and Salinification after Weddell Polynyas in the GFDL CM2G Coupled Climate Model. J. Phys. Oceanogr. 45:2755–2772. doi:10.1175/JPO-D-15-0109.1 86. de Lavergne C, Palter JB, Galbraith ED, Bernardello R, Marinov I (2014) Cessation of deep convection in the open
Southern Ocean under anthropogenic climate change. Nat Clim Change 4(4):278–282. doi:10.1038/nclimate2132 87. Reintges A, Martin T, Latif M, Park W (2017) Physical controls of Southern Ocean deep-convection variability in
CMIP5 models and the Kiel Climate Model. Geophys Res Lett 44. doi: 10.1002/2017GL074087.
88. Boer GJ, Lambert SJ (2008) Multi-model decadal potential predictability of precipitation and temperature.
Geophys Res Lett 35. doi: 10.1029/2008GL033234
89. Zhang L, Delworth TL, Jia L (2017a) Diagnosis of decadal predictability of Southern Ocean sea surface temperature in the GFDL CM2.1 model. J Climate. doi:10.1175/JCLI-D-16-0537.1
90. Pohlmann H, Botzet M, Latif M, et al. (2004) Estimating the decadal predictability of a coupled AOGCM. J Climate 17:4463-4472. doi:10.1175/3209.1
91. Arblaster JM, Meehl GA, Karoly DJ (2011) Future climate change in the Southern Hemisphere: Competing effects of ozone and greenhouse gases. Geophys Res Lett 38:L02701. doi:10.1029/2010GL045384
92. Schneider D, Reusch D (2016) Antarctic and Southern Ocean Surface Temperatures in CMIP5 Models in the Context of the Surface Energy Budget. J Climate 29:1689–1716. doi: 10.1175/JCLI-D-15-0429.1
93. McCoy DT, Hartmann DL, Zelinka MD, Ceppi P, Grosvenor DP (2015) Mixed-phase cloud physics and Southern Ocean cloud feedback in climate models, J Geophys Res Atmos 120:9539–9554. doi:10.1002/2015JD023603 94. Wang C, Zhang L, Lee S-K, Wu L, Mechoso CR (2014) A global perspective on CMIP5 climate model biases Nat Clim
Ch 4:201–205. doi:10.1038/nclimate2118
95. Bi DH, Budd WF, Hirst AC, Wu XR (2002) Response of the antarctic circumpolar current transport to global warming in a coupled model. Geophys Res Lett 29. doi: 10.1029/2002GL015919
96. Saenko OA, Fyfe JC, England MH (2005) On the response of the oceanic wind-driven circulation to atmospheric CO2 increase. Clim Dynam 25:415-426. doi: 10.1007/s00382-005-0032-5
97. Fyfe JC, Saenko OA (2006) Simulated changes in the extratropical Southern Hemisphere winds and currents.
Geophys Res Lett 33. doi: 10.1029/2005GL025332
98. Hallberg R, Gnanadesikan A (2006) The role of eddies in determining the structure and response of the wind- driven southern hemisphere overturning: Results from the Modeling Eddies in the Southern Ocean (MESO) project. J Phys Oceanogr 36:2232-2252. doi: 10.1175/JPO2980.1
99. Hogg AM, Meredith MP, Blundell JR, Wilson C (2008) Eddy heat flux in the Southern Ocean: Response to variable wind forcing. J Climate 21:608-620. doi: 10.1175/2007JCLI1925.1
100. Screen JA, Gillett NP, Stevens DP, Marshall GJ, Roscoe HK (2009) The Role of Eddies in the Southern Ocean Temperature Response to the Southern Annular Mode. J Climate 22:806-818. doi: 10.1175/2008JCLI2416.1 101. Yang XY, Huang RX, Wang J, Wang, DX (2008) Delayed baroclinic response of the Antarctic circumpolar current to
surface wind stress. Sci China Ser D 51:1036-1043. doi: 10.1007/s11430-008-0074-8
102. Wang Z, Kuhlbrodt T, Meredith MP (2011) On the response of the Antarctic Circumpolar Current transport to climate change in coupled climate models. J Geophys Res-Oceans 116. doi: 10.1029/2010JC006757
103. Zhou G, Latif M, Greatbatch RJ, Park W (2015) Atmospheric Response to the North Pacific Enabled by Daily Sea Surface Temperature Variability. Geophys Rese Lett 42:7732-7739. Doi:10.1002/2015GL065356
104. Ma X et al (2016) Western boundary currents regulated by interaction between ocean eddies and the atmosphere. Nature 535:533–537. doi:10.1038/nature18640
105. Bordbar MH, Martin T, Latif M, Park W (2015) Effects of long-term variability on projections of twenty-first- century dynamic sea level. Nature Climate Change 5:343-347. doi: 10.1038/nclimate2569
106. Zhang L, Delworth TL, Zeng F (2017b) The impact of multidecadal Atlantic meridional overturning circulation variations on the Southern Ocean. Clim Dynam. doi: 10.1007/s00382-016-3190-8
107. Arblaster JM, Meehl GA (2006) Contributions of external forcings to southern annular mode trends. J Climate 19:2896-2905. doi: 10.1175/JCLI3774.1
108. Pope A, Wagner P, Johnson R, Shutler JD, Baeseman J, Newman L (2017) Community review of Southern Ocean satellite data needs. Antarctic Science 29(2):97–138. doi: 10.1017/S0954102016000390
Figures
Figure 1: The seasonal SAM index measuring the pressure difference between the middle and high latitudes of the Southern Hemisphere. The overall linear trend of the time series is shown in red and a 11-year running mean in blue. The index is calculated on the basis of 12 stations.
https://climatedataguide.ucar.edu/climate-data/marshall-southern-annular-mode-sam-index- station-based.
Figure 2: Power spectra of the SAM index from 12 CMIP5 and KCM pre-industrial control simulations (gray lines) and the observed index (bold black line). The spectra are based on a monthly SAM index computed from modeled mean sea level pressure following the example of Marshall (2003). The model selection follows Reintges et al. (2017).
Figure 3: Linear trend of sea surface temperature (SST) over the last 40 years, 1976-2016 (°C), i.e. since shutdown of the Weddell Polynya,. Data is from ERSST v4
(https://www.ncdc.noaa.gov/data-access/marineocean-data/extended-reconstructed-sea- surface-temperature-ersst-v4).